
Introduction
Glances is a versatile system monitoring tool that provides a comprehensive overview of various system resources in real-time. It displays statistics about CPU, memory, load, network interfaces, disk I/O, and more, all within a single, command-line interface.
Viewing System Metrics with Glances
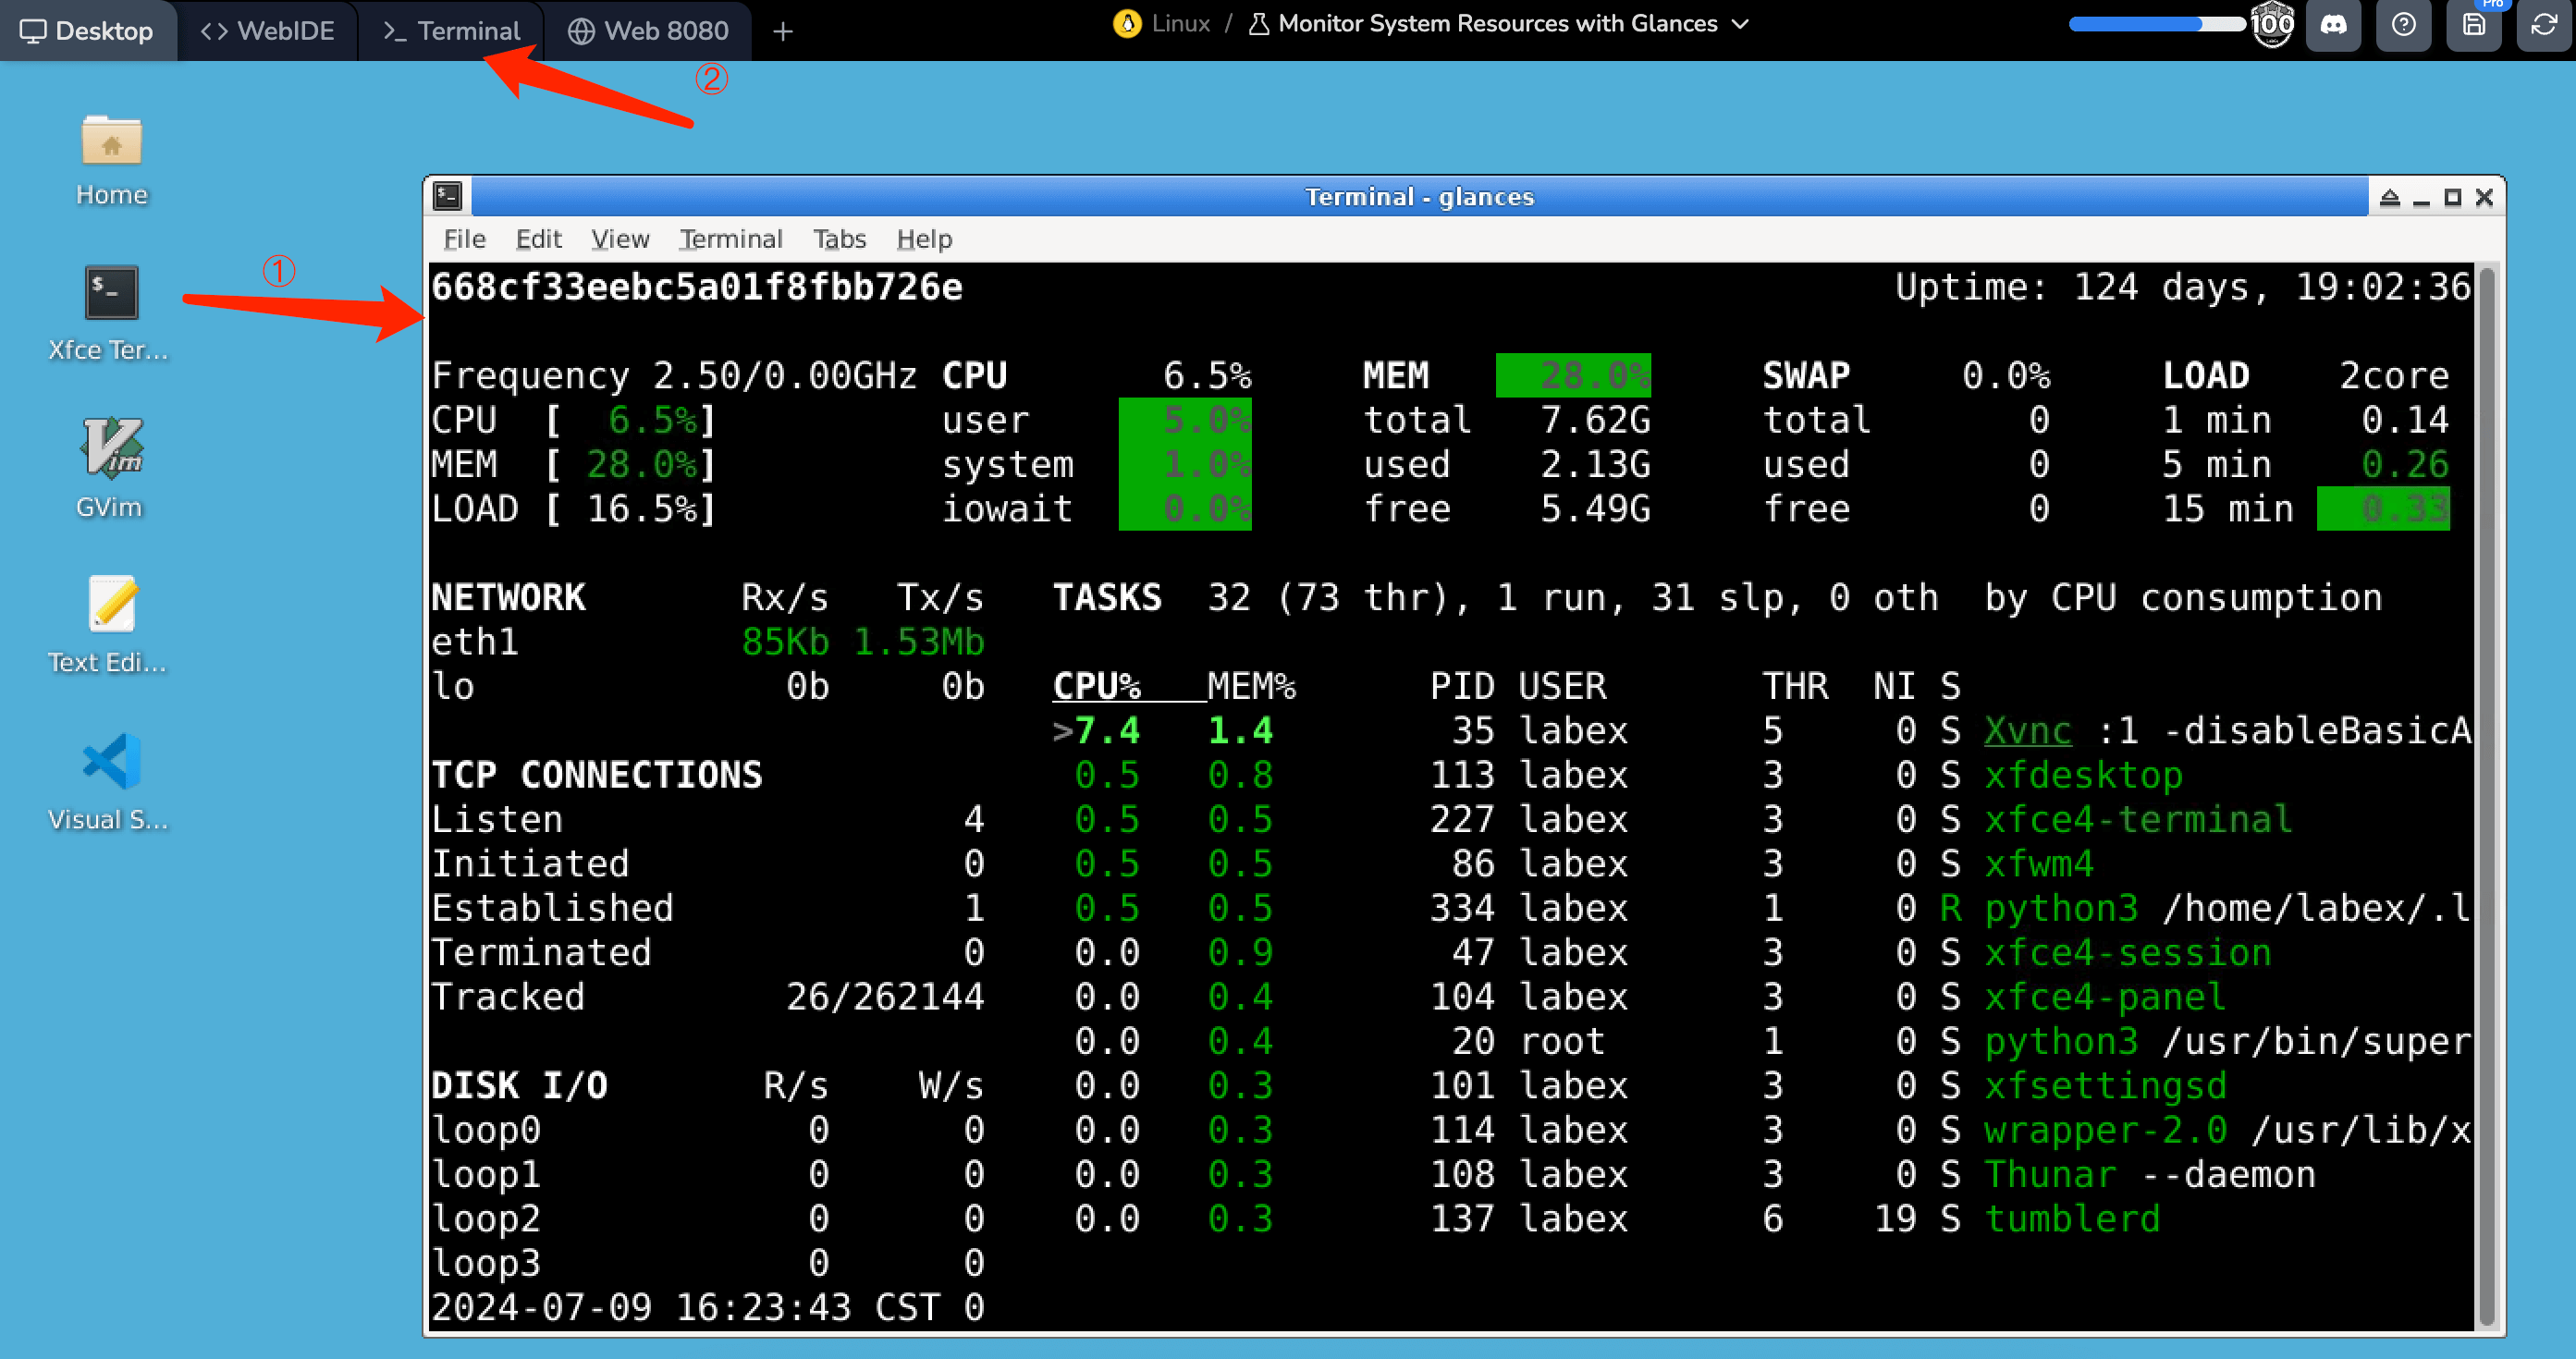
Open the terminal ( ① or ② in the figure ) in the environment and enter the following command:
glances
When you run this command, Glances will open an interface in your terminal that continuously updates to show real-time system information. The default view includes sections for CPU usage, memory utilization, swap space, network throughput, disk I/O, and active processes. Each section is clearly labeled, making it easy to understand at a glance what resources are being utilized and how.
Navigating the Interface
Within the Glances interface, you can use certain keyboard shortcuts to navigate and customize what data you see:
- Arrow keys: Navigate through the list of active processes.
- c: Sort processes by CPU usage.
- m: Sort processes by memory usage.
- p: Sort processes by name.
- d: Show/hide disk I/O stats.
- n: Show/hide network stats.
- h: Display help about keyboard shortcuts.
- q: Quit the application.
Summary
Glances is an efficient and user-friendly tool that provides a detailed snapshot of your system's performance and health. Whether you're monitoring a server or your personal computer, Glances offers a powerful way to keep an eye on the resources that matter most. Its flexibility and ease of use make it an excellent choice for system administrators and regular users alike.


