
Introduction
In this project, you will learn how to create a weather trend chart that displays the temperature data for a city throughout the year. The chart will allow users to switch between the current month's data and the next 7 days' data, providing a comprehensive view of the weather trends.
👀 Preview
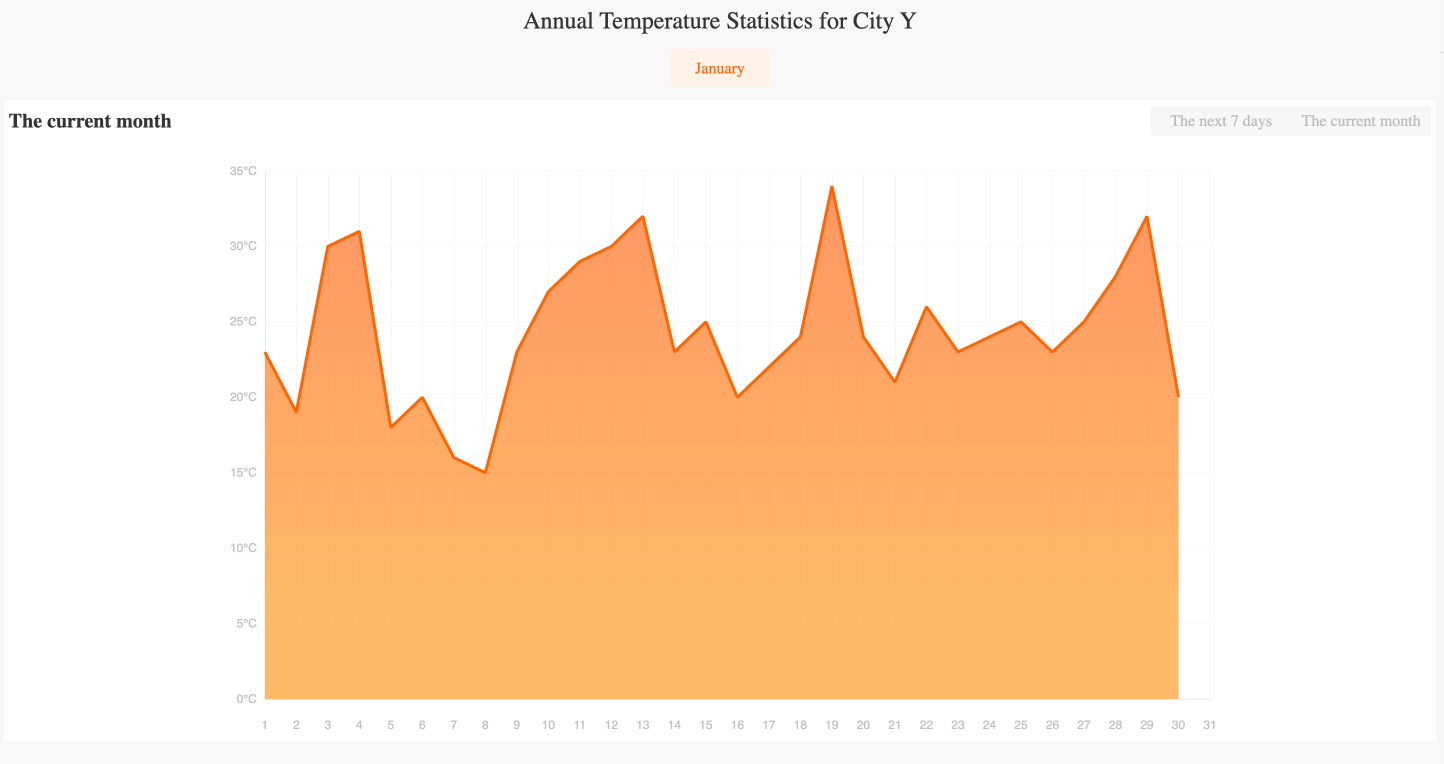
"The current month" and "The next 7 days" switching effect is shown in the figure below:
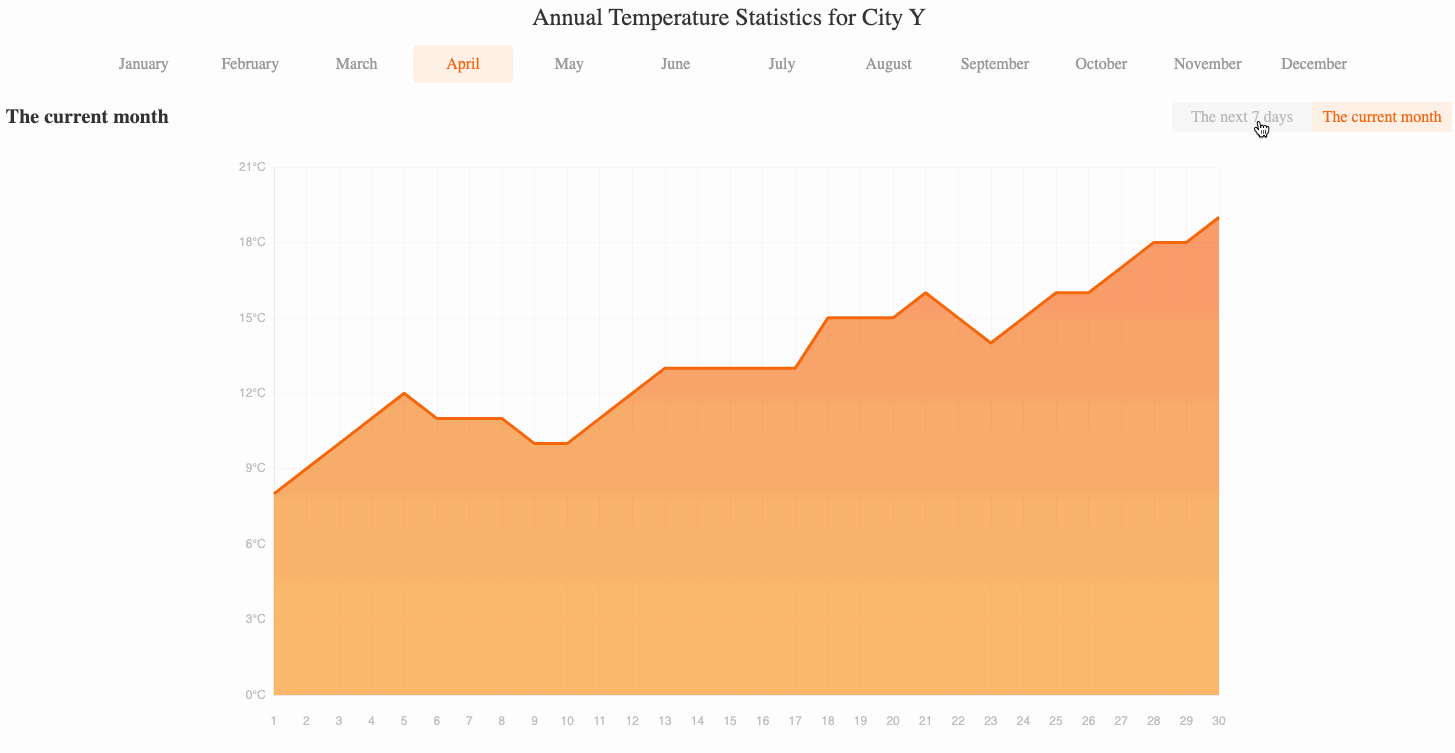
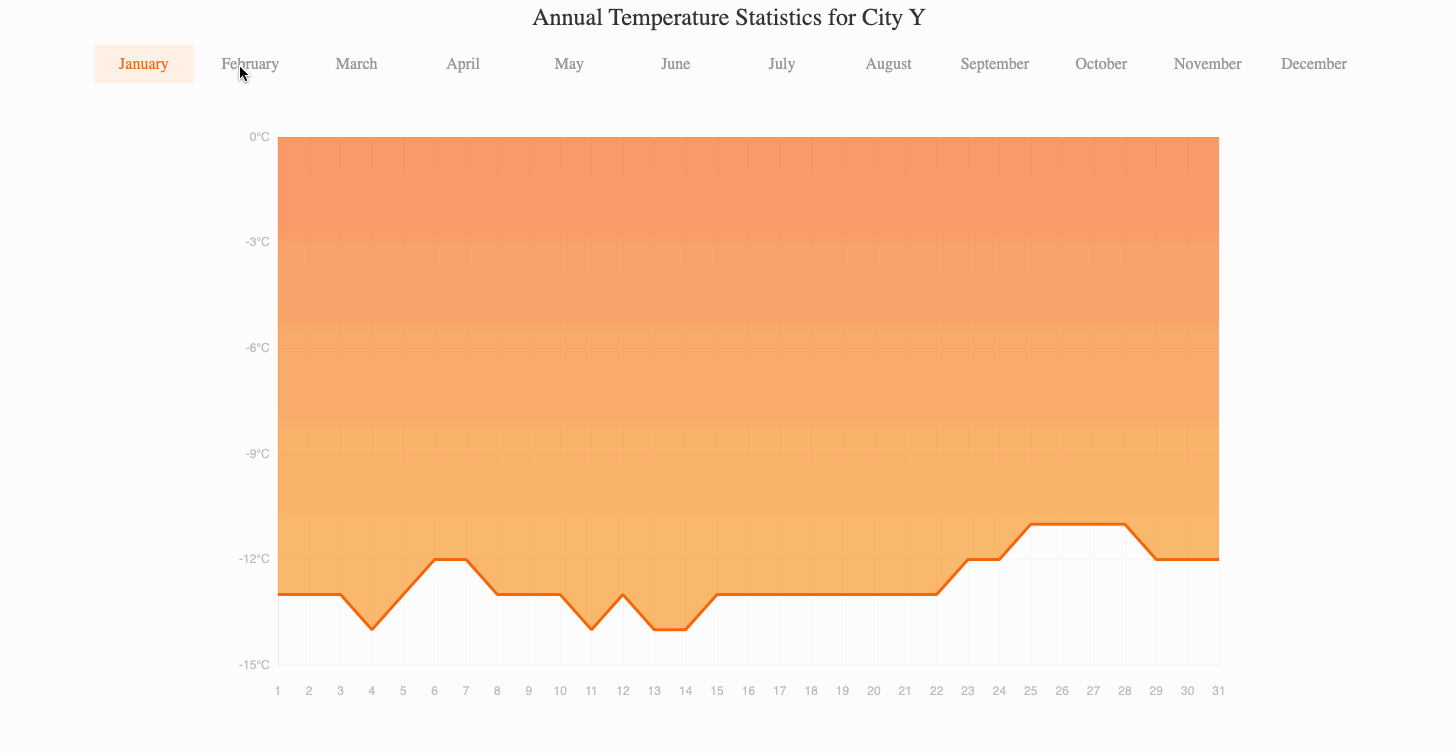
The month switching effect is as follows:
🎯 Tasks
In this project, you will learn:
- How to fetch weather data from a JSON file using Axios
- How to render a list of months and handle the click event to change the displayed data
- How to implement tabs to switch between the current month's data and the next 7 days' data
- How to initialize and customize an Echarts chart to display the weather data
🏆 Achievements
After completing this project, you will be able to:
- Fetch data from a JSON file using Axios
- Create a responsive and interactive user interface with Vue.js
- Use Echarts to create a customized chart with advanced features
- Handle user interactions and update the chart accordingly
- Apply your knowledge of front-end development, data visualization, and user experience design
Skills Graph
%%%%{init: {'theme':'neutral'}}%%%%
flowchart RL
html(("`HTML`")) -.-> html/BasicStructureGroup(["`Basic Structure`"])
javascript(("`JavaScript`")) -.-> javascript/BasicConceptsGroup(["`Basic Concepts`"])
javascript(("`JavaScript`")) -.-> javascript/AdvancedConceptsGroup(["`Advanced Concepts`"])
javascript(("`JavaScript`")) -.-> javascript/NetworkingGroup(["`Networking`"])
html/BasicStructureGroup -.-> html/basic_elems("`Basic Elements`")
html/BasicStructureGroup -.-> html/viewport("`Viewport Declaration`")
javascript/BasicConceptsGroup -.-> javascript/loops("`Loops`")
javascript/BasicConceptsGroup -.-> javascript/functions("`Functions`")
javascript/AdvancedConceptsGroup -.-> javascript/es6("`ES6 Features`")
javascript/NetworkingGroup -.-> javascript/http_req("`HTTP Requests`")
subgraph Lab Skills
html/basic_elems -.-> lab-300337{{"`Weather Trend Chart with Vue and Echarts`"}}
html/viewport -.-> lab-300337{{"`Weather Trend Chart with Vue and Echarts`"}}
javascript/loops -.-> lab-300337{{"`Weather Trend Chart with Vue and Echarts`"}}
javascript/functions -.-> lab-300337{{"`Weather Trend Chart with Vue and Echarts`"}}
javascript/es6 -.-> lab-300337{{"`Weather Trend Chart with Vue and Echarts`"}}
javascript/http_req -.-> lab-300337{{"`Weather Trend Chart with Vue and Echarts`"}}
end