Real-Time Sales Dashboard with Echarts

JavaScriptJavaScriptIntermediate
Practice Now

Introduction

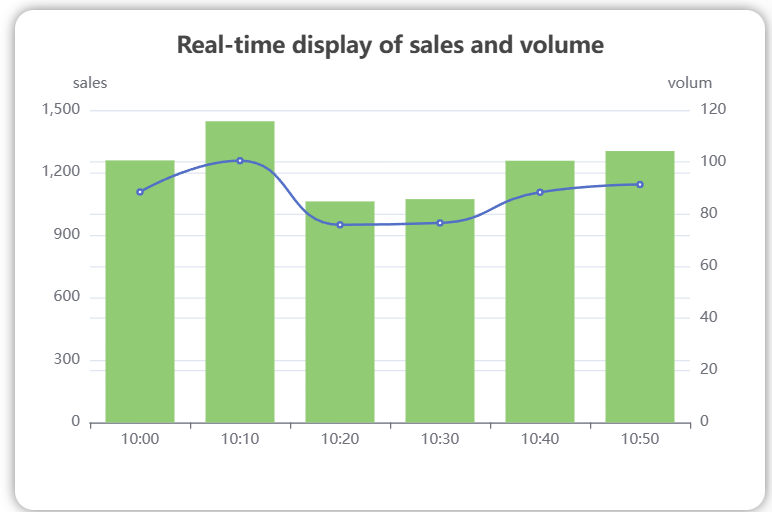
In this project, you will learn how to create a real-time sales dashboard using the Echarts library. The dashboard will display the sales and volume data in a visually appealing and easy-to-understand format.

👀 Preview

finished

🎯 Tasks

In this project, you will learn:

  • How to set up the project and get the necessary files
  • How to complete the "yAxis" setting in the index.js file
  • How to correctly assign the values from the backend data to the appropriate chart options in the renderChart function

🏆 Achievements

After completing this project, you will be able to:

  • Render data into charts using the Echarts library
  • Structure and organize your code for a data visualization project
  • Work with asynchronous data retrieval and update the chart in real-time

Skills Graph

%%%%{init: {'theme':'neutral'}}%%%% flowchart RL javascript(("`JavaScript`")) -.-> javascript/BasicConceptsGroup(["`Basic Concepts`"]) javascript(("`JavaScript`")) -.-> javascript/AdvancedConceptsGroup(["`Advanced Concepts`"]) javascript/BasicConceptsGroup -.-> javascript/variables("`Variables`") javascript/BasicConceptsGroup -.-> javascript/functions("`Functions`") javascript/BasicConceptsGroup -.-> javascript/obj_manip("`Object Manipulation`") javascript/AdvancedConceptsGroup -.-> javascript/es6("`ES6 Features`") subgraph Lab Skills javascript/variables -.-> lab-300331{{"`Real-Time Sales Dashboard with Echarts`"}} javascript/functions -.-> lab-300331{{"`Real-Time Sales Dashboard with Echarts`"}} javascript/obj_manip -.-> lab-300331{{"`Real-Time Sales Dashboard with Echarts`"}} javascript/es6 -.-> lab-300331{{"`Real-Time Sales Dashboard with Echarts`"}} end

Set Up the Project Structure

In this step, you will set up the project files and structure. Follow the steps below to complete this step:

Open the project folder. The directory structure is as follows:

├── echarts.js
├── index.css
├── index.html
└── index.js

Click on Go Live button in the bottom right corner of WebIDE, to run the project.

Next, open "Web 8080" on the top of the VM and manually refresh it to see the page.

Completing the yAxis Setting

In this step, you will learn how to complete the "yAxis" setting in the index.js file.

  1. Open the index.js file.

  2. Find the yAxis configuration in the option object.

  3. Update the yAxis configuration to meet the following requirements:

    • The first item should have name as "sales" and position on the left side of the chart.
    • The second item should have name as "volume" and position on the right side of the chart.

Your updated yAxis configuration should look like this:

yAxis: [
  {
    type: "value",
    name: "sales",
    position: "left"
  },
  {
    type: "value",
    name: "volum",
    position: "right"
  }
],

Completing the renderChart Function

In this step, you will learn how to complete the renderChart function in the index.js file.

  1. Open the index.js file.
  2. Find the renderChart function.
  3. Complete the code in the renderChart function to correctly assign the values from saleObj and countObj to the time for the X-axis, and sales and volume for the Y-axis.

Your updated renderChart function should look like this:

async function renderChart() {
  const result = await Ajax();
  document.querySelector("#result").innerText = JSON.stringify(result);
  const myChart = echarts.init(document.getElementById("main"));

  // Assign the values from `saleObj` and `countObj` to the appropriate options
  option.xAxis.data = Object.keys(result.data.saleObj);
  option.series[0].data = Object.values(result.data.saleObj);
  option.series[1].data = Object.values(result.data.countObj);

  myChart.setOption(option, true);
  document.querySelector("#data").innerText = JSON.stringify(charData);
}

After completing these steps, your sales dashboard project should be fully functional and display the real-time sales and volume data correctly. The final page effect is as follows:

Image Description

Summary

Congratulations! You have completed this project. You can practice more labs in LabEx to improve your skills.

Other JavaScript Tutorials you may like