Hard Work Pays Off

JavaScriptJavaScriptBeginner
Practice Now

Introduction

In this project, you will learn how to create a statistical chart of crop yields in a city over the past five years using ECharts. The project aims to demonstrate how practical problems can be analyzed through statistics on crop yields, which directly affect people's livelihood.
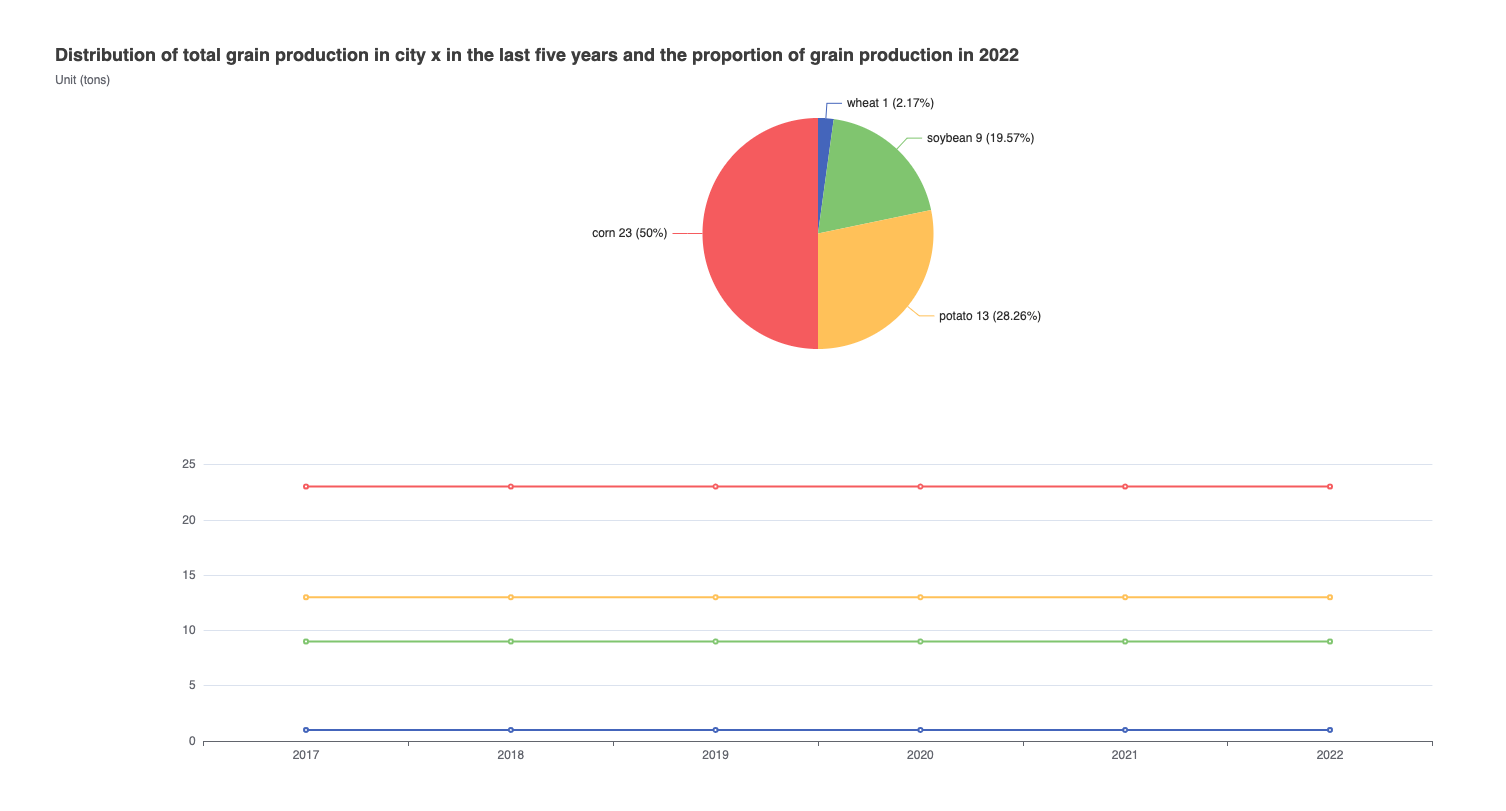
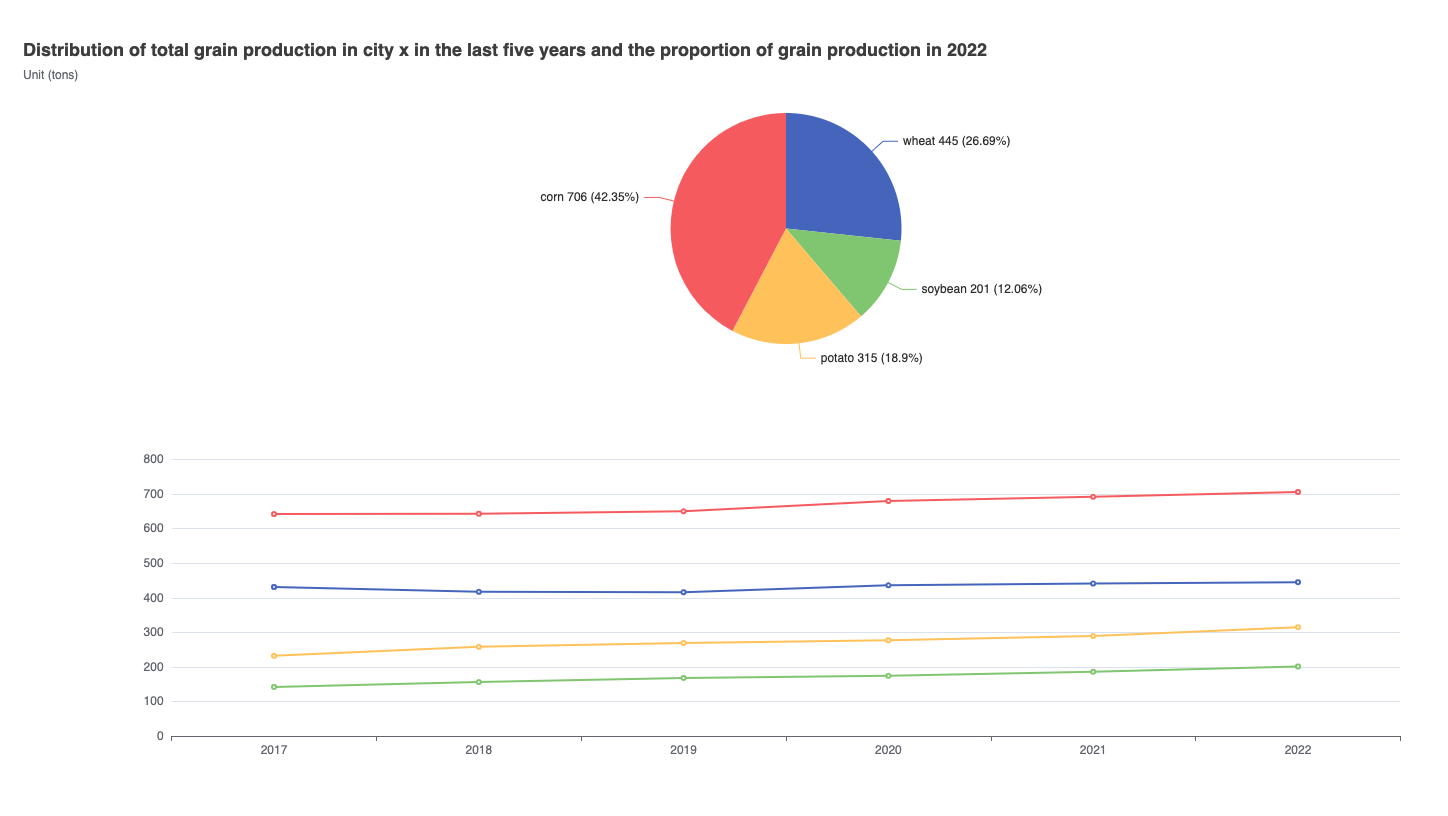
👀 Preview

Image Description

🎯 Tasks

In this project, you will learn:

  • How to set up the project environment and understand the provided files
  • How to fetch the data from a JSON file and process it to update the ECharts visualization
  • How to customize the appearance and layout of the line chart and pie chart

🏆 Achievements

After completing this project, you will be able to:

  • Use the Axios library to fetch data from a JSON file
  • Manipulate the ECharts option object to update the visualization
  • Customize the charts by adjusting the title, layout, and other properties

Skills Graph

%%%%{init: {'theme':'neutral'}}%%%% flowchart RL javascript(("`JavaScript`")) -.-> javascript/BasicConceptsGroup(["`Basic Concepts`"]) javascript(("`JavaScript`")) -.-> javascript/AdvancedConceptsGroup(["`Advanced Concepts`"]) javascript(("`JavaScript`")) -.-> javascript/NetworkingGroup(["`Networking`"]) javascript/BasicConceptsGroup -.-> javascript/array_methods("`Array Methods`") javascript/AdvancedConceptsGroup -.-> javascript/es6("`ES6 Features`") javascript/NetworkingGroup -.-> javascript/http_req("`HTTP Requests`") subgraph Lab Skills javascript/array_methods -.-> lab-300329{{"`Hard Work Pays Off`"}} javascript/es6 -.-> lab-300329{{"`Hard Work Pays Off`"}} javascript/http_req -.-> lab-300329{{"`Hard Work Pays Off`"}} end

Set Up the Project Structure

In this step, you will set up the project structure and prepare the necessary files and folders.

Open the project folder in your code editor. The directory structure is as follows:

├── data.json
├── index.html
└── js
    ├── axios.min.js
    └── echarts.min.js

Where:

  • index.html is the main page.
  • js/echarts.min.js is the ECharts file.
  • js/axios.min.js is the axios file.
  • data.json is the grain production data in tons for the corresponding year.

Click on Go Live button in the bottom right corner of WebIDE, to run the project.

Next, open the "Web 8080" on the top of the VM and manually refresh the page to see the following effect in your browser:

Image Description

Fetch the Data

In this step, you will complete the data request and display the crop yield data correctly in the line chart and pie chart.

  1. In the index.html file, locate the // TODO section.
  2. Use the axios.get() method to fetch the data from the data.json file.
axios.get("./data.json").then((res) => {
  let data = res.data.data;
  // TODO: Process the data and update the option object
});
  1. Inside the .then() callback, process the data from the data.json file and update the option object accordingly.

    • Create an object dataObj to store the data for each crop type.
    • Create an array sourceTip to store the labels for the data.
    • Loop through the data and populate the dataObj and sourceTip arrays.
    • Create a new newSource array and populate it with the data from dataObj and sourceTip.
    • Update the option.dataset.source with the newSource array.
    • Call myChart.setOption(option) to update the chart with the new data.
// TODO
let dataObj = {
  wheat: ["wheat"],
  soybean: ["soybean"],
  potato: ["potato"],
  corn: ["corn"]
};
let sourceTip = ["all"];

axios.get("./data.json").then((res) => {
  let data = res.data.data;

  for (const key1 in data) {
    sourceTip.push(key1);
    for (const key2 in data[key1]) {
      dataObj[key2].push(data[key1][key2]);
    }
  }

  let newSource = [];
  newSource.push(sourceTip);
  for (const key in dataObj) {
    newSource.push(dataObj[key]);
  }

  option.dataset.source = newSource;
  myChart.setOption(option);
});
  1. Save the index.html file and refresh the page. You should now see the updated line chart and pie chart with the correct data.
Image Description

Summary

Congratulations! You have completed this project. You can practice more labs in LabEx to improve your skills.

Other JavaScript Tutorials you may like