The Boundless Sea of Learning

JavaScriptJavaScriptBeginner
Practice Now

Introduction

In this project, you will learn how to create a data visualization chart using the ECharts library. The project aims to help Lucy, an online learning platform user, to better visualize her daily study time.

👀 Preview

finished

🎯 Tasks

In this project, you will learn:

  • How to fetch data from a JSON file and process it to extract the necessary information.
  • How to use the ECharts library to create a bar chart that displays the weekly and monthly study duration statistics.
  • How to implement interactivity to allow the user to switch between the weekly and monthly views.
  • How to resize the chart dynamically when the window is resized.

🏆 Achievements

After completing this project, you will be able to:

  • Fetch data from a JSON file and manipulate it for visualization.
  • Configure and customize an ECharts bar chart to display study duration statistics.
  • Add interactivity to the chart and handle user interactions.
  • Ensure the chart remains responsive and adapts to window resizing.

Skills Graph

%%%%{init: {'theme':'neutral'}}%%%% flowchart RL javascript(("`JavaScript`")) -.-> javascript/BasicConceptsGroup(["`Basic Concepts`"]) javascript(("`JavaScript`")) -.-> javascript/AdvancedConceptsGroup(["`Advanced Concepts`"]) javascript(("`JavaScript`")) -.-> javascript/DOMManipulationGroup(["`DOM Manipulation`"]) javascript(("`JavaScript`")) -.-> javascript/NetworkingGroup(["`Networking`"]) javascript/BasicConceptsGroup -.-> javascript/functions("`Functions`") javascript/BasicConceptsGroup -.-> javascript/array_methods("`Array Methods`") javascript/AdvancedConceptsGroup -.-> javascript/es6("`ES6 Features`") javascript/DOMManipulationGroup -.-> javascript/dom_select("`DOM Selection`") javascript/NetworkingGroup -.-> javascript/http_req("`HTTP Requests`") subgraph Lab Skills javascript/functions -.-> lab-299849{{"`The Boundless Sea of Learning`"}} javascript/array_methods -.-> lab-299849{{"`The Boundless Sea of Learning`"}} javascript/es6 -.-> lab-299849{{"`The Boundless Sea of Learning`"}} javascript/dom_select -.-> lab-299849{{"`The Boundless Sea of Learning`"}} javascript/http_req -.-> lab-299849{{"`The Boundless Sea of Learning`"}} end

Set Up the Project Structure

In this step, you will set up the project files and structure. Follow the steps below to complete this step:

Open the project folder. The directory structure is as follows:

├── css
│   └── style.css
├── data.json
├── index.html
└── js
    ├── axios.min.js
    └── echarts.min.js

In this structure:

  • index.html is the main page.
  • js/echarts.min.js is the ECharts file.
  • js/axios.min.js is the axios file.
  • css/style.css is the style file.
  • data.json is the data file for study duration.

Click on Go Live button in the bottom right corner of WebIDE, to run the project.

Next, open "Web 8080" on the top of the VM and manually refresh it to see the page.

Fetching the Data

In this step, you will learn how to fetch the data from the data.json file and store it in the necessary data structures.

  1. Open the index.html file in your code editor.
  2. Locate the // TODO section in the JavaScript code.
  3. Create two objects to store the weekly and monthly data:
// TODO
let weekData = {
  x: [],
  y: []
};

let monthData = {
  x: [],
  y: []
};
  1. Implement the mySetOption() function to update the chart's options based on the data passed to it.
function mySetOption(data) {
  option.xAxis.data = data.x;
  option.series[0].data = data.y;
  myChart.setOption(option);
}
  1. Use the axios.get() method to fetch the data from the data.json file. The response from the API call will contain the data in the res.data.data property.
axios.get("./data.json").then((res) => {
  const data = res.data.data;

  // Process the data here
});
  1. Inside the callback function of the then() method, iterate through the data object and process the study duration data for each day. Calculate the total study duration for each week and month, and store the results in the weekData and monthData objects, respectively.
for (const key in data) {
  let weekCount = (monthCount = 0),
    weekNum = 1;

  for (let i = 0; i < data[key].length; i++) {
    weekCount += data[key][i];
    monthCount += data[key][i];

    if (
      (i + 1) % 7 === 0 ||
      (data[key].length - i <= 7 && i === data[key].length - 1)
    ) {
      weekData.x.push(`Week ${weekNum++} (${key})`);
      weekData.y.push(weekCount);
      weekCount = 0;
    }
  }
  monthData.x.push(key);
  monthData.y.push(monthCount);
}
  1. After processing the data, call the mySetOption() function and pass the weekData object to display the weekly statistics by default.
mySetOption(weekData);
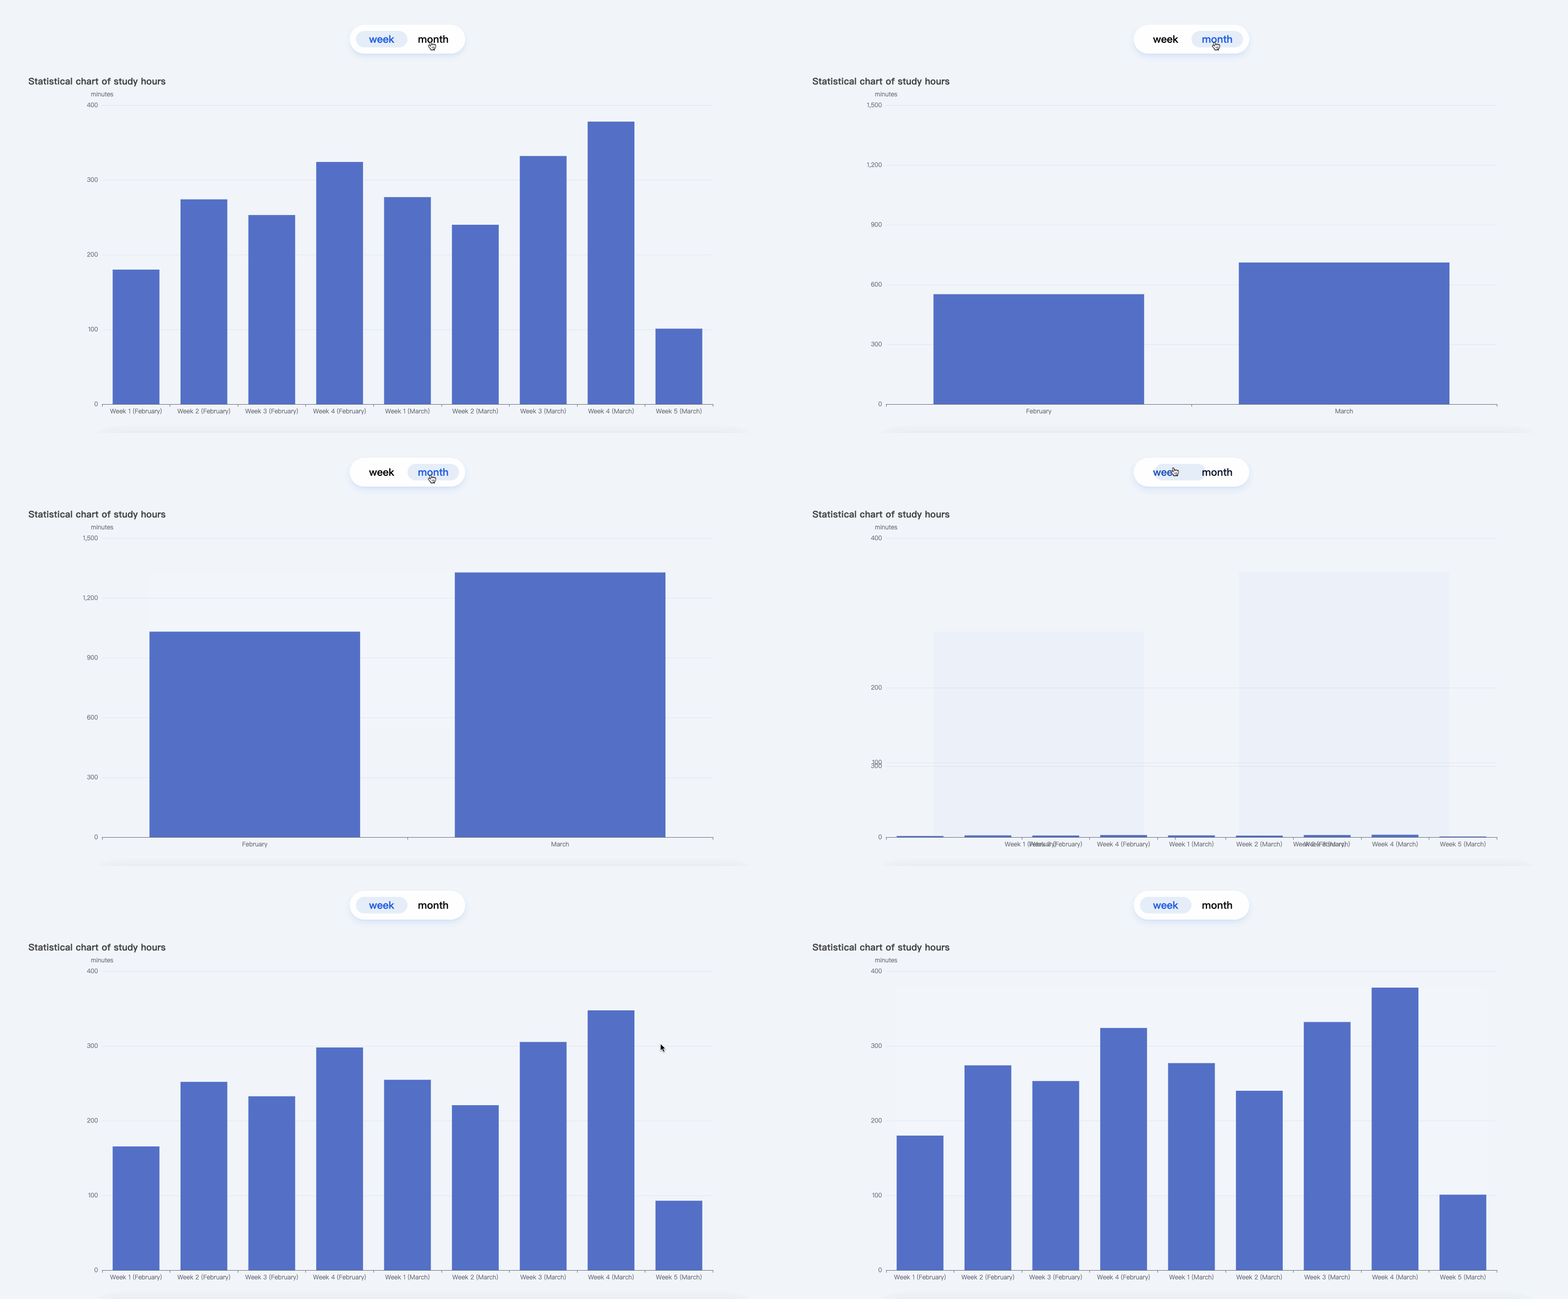
  1. The effect of the code after this step of processing is as follows:
// TODO
let weekData = {
    x: [],
    y: []
  },
  monthData = {
    x: [],
    y: []
  };

function mySetOption(data) {
  option.xAxis.data = data.x;
  option.series[0].data = data.y;
  // reset
  myChart.setOption(option);
}

axios.get("./data.json").then((res) => {
  const data = res.data.data;

  for (const key in data) {
    let weekCount = (monthCount = 0),
      weekNum = 1;

    for (let i = 0; i < data[key].length; i++) {
      weekCount += data[key][i];
      monthCount += data[key][i];

      if (
        (i + 1) % 7 === 0 ||
        (data[key].length - i <= 7 && i === data[key].length - 1)
      ) {
        weekData.x.push(`Week ${weekNum++} (${key})`);
        weekData.y.push(weekCount);
        weekCount = 0;
      }
    }
    monthData.x.push(key);
    monthData.y.push(monthCount);
  }
  mySetOption(weekData);
});
Displaying the Chart

In this step, you will learn how to switch the display of charts using the ECharts library.

  1. Open the index.html file in your code editor.
  2. Locate the mySetOption section in the JavaScript code.
  3. Add event listeners for the tabs (weekly and monthly) after the function mySetOption to update the chart when the user clicks on it.
function mySetOption(data) {
  option.xAxis.data = data.x;
  option.series[0].data = data.y;
  // reset
  myChart.setOption(option);
}

document.querySelector(".tabs").addEventListener("click", function (e) {
  if (e.target.id === "week") {
    mySetOption(weekData);
  } else if (e.target.id === "month") {
    mySetOption(monthData);
  }
});

With these steps, you have completed the project. The chart will now display the weekly and monthly study duration statistics based on the data fetched from the data.json file. The final page effect is as follows:

Image Description
✨ Check Solution and Practice

Summary

Congratulations! You have completed this project. You can practice more labs in LabEx to improve your skills.

Other JavaScript Tutorials you may like