Data Visualization with Echarts and JSON

HTMLHTMLBeginner
Practice Now

Introduction

In this project, you will learn how to fetch data from a JSON file, render the protein content of different foods, and create an Echarts pie chart to visualize the data. This project aims to provide you with a hands-on experience in working with data manipulation and data visualization using JavaScript.
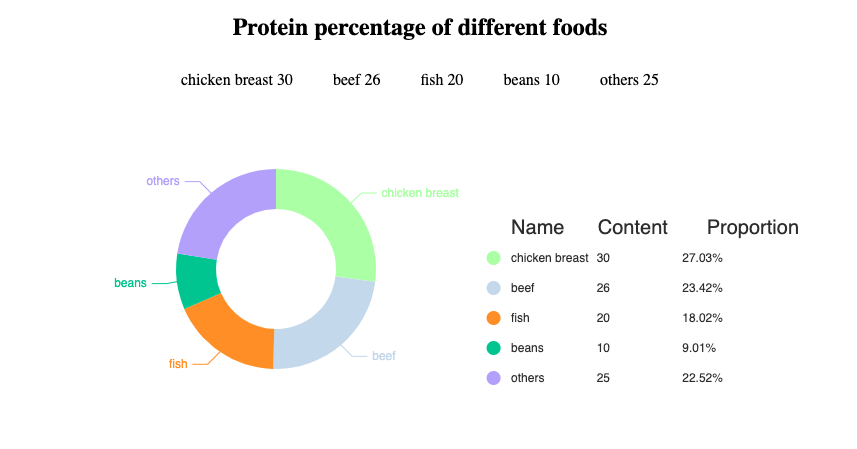
👀 Preview

finished

🎯 Tasks

In this project, you will learn:

  • How to fetch data from a JSON file using the Fetch API
  • How to render the protein content of different foods on the web page
  • How to create an Echarts pie chart to visualize the protein content data

🏆 Achievements

After completing this project, you will be able to:

  • Fetch data from a JSON file and process the data
  • Dynamically render HTML elements based on the fetched data
  • Use the Echarts library to create an interactive pie chart
  • Integrate data visualization into a web application

Skills Graph

%%%%{init: {'theme':'neutral'}}%%%% flowchart RL html(("`HTML`")) -.-> html/BasicStructureGroup(["`Basic Structure`"]) javascript(("`JavaScript`")) -.-> javascript/BasicConceptsGroup(["`Basic Concepts`"]) javascript(("`JavaScript`")) -.-> javascript/AdvancedConceptsGroup(["`Advanced Concepts`"]) javascript(("`JavaScript`")) -.-> javascript/NetworkingGroup(["`Networking`"]) html/BasicStructureGroup -.-> html/viewport("`Viewport Declaration`") javascript/BasicConceptsGroup -.-> javascript/array_methods("`Array Methods`") javascript/AdvancedConceptsGroup -.-> javascript/es6("`ES6 Features`") javascript/NetworkingGroup -.-> javascript/http_req("`HTTP Requests`") subgraph Lab Skills html/viewport -.-> lab-300160{{"`Data Visualization with Echarts and JSON`"}} javascript/array_methods -.-> lab-300160{{"`Data Visualization with Echarts and JSON`"}} javascript/es6 -.-> lab-300160{{"`Data Visualization with Echarts and JSON`"}} javascript/http_req -.-> lab-300160{{"`Data Visualization with Echarts and JSON`"}} end

Set Up the Project Structure

In this step, you will set up the project files and structure. Follow the steps below to complete this step:

Open the project folder. The directory structure is as follows:

├── css
├── index.html
├── lib
└── mock
    └── data.json

Among them:

  • index.html is the main page.
  • css is the folder that stores the project styles.
  • lib is the folder that stores the project dependencies.
  • mock/data.json is the JSON data used in the project request.

Click on Go Live button in the bottom right corner of WebIDE, to run the project.

Next, open "Web 8080" on the top of the VM and refresh it manually and you will see the page.

Fetch Data and Render the Protein Content

In this step, you will learn how to fetch data from the provided JSON file and render the protein content of different foods.

  1. Open the index.html file in the project directory.
  2. Locate the TODO comment in the index.html file, which is inside the <script> tag.
  3. Inside the fetchData function, add the following code to fetch the data from the MockURL and render the protein content:
let dataList = ref([]);
async function fetchData() {
  // TODO: code to be added
  let data = await fetch(MockURL).then((res) => res.json());
  data.unshift({
    name: "header",
    icon: "none"
  });
  echartsInit(data);
  dataList.value = data.slice(1);
}

return {
  echartsInit,
  fetchData
};
  1. In the onMounted hook, call the fetchData function to fetch the data and render the protein content. Finally, it returns within return.
onMounted(() => {
  fetchData();
});
return {
  echartsInit,
  fetchData,
  dataList
};
  1. Add the following code under TODO: code to be added to render the fetched data in HTML to display the data.
<div class="protein-item" v-for="data in dataList" :key="data.name">
  {{data.name}} {{data.value}}
</div>
  1. Save the index.html file and refresh the page. You should now see the protein content of different foods displayed in the .protein-container element.

The completed effect is as follows:

Completed effect

Congratulations! You have completed the "Food Protein Revealed" project. You have learned how to fetch data from a JSON file, render the protein content, and create an Echarts pie chart to visualize the data.

Summary

Congratulations! You have completed this project. You can practice more labs in LabEx to improve your skills.

Other HTML Tutorials you may like