Introduction
Kubernetes Dashboard is a web-based user interface that simplifies the management and monitoring of Kubernetes clusters. It provides an intuitive way to deploy and manage applications, as well as view and analyze cluster resources. This lab will guide you through deploying and accessing Kubernetes Dashboard.
Start the Kubernetes Cluster
Before deploying the Kubernetes Dashboard, ensure that your cluster is running. We will use Minikube for this lab.
Open a terminal and navigate to the project directory:
cd ~/projectStart the Minikube cluster:
minikube startMinikube creates a local Kubernetes cluster, making it easy to test features like the Dashboard. The setup may take a few minutes.
Verify that Minikube is running by checking its status:
minikube statusIf the cluster is not running, restart it with
minikube deletefollowed byminikube start.
Deploy Kubernetes Dashboard
Kubernetes Dashboard is not included by default in the cluster. Deploy it using the official deployment YAML file.
Run the following command to deploy the Dashboard:
kubectl apply -f https://raw.githubusercontent.com/kubernetes/dashboard/v2.3.1/aio/deploy/recommended.yamlThis command creates all necessary resources for the Dashboard, including a Deployment, a Service, and Role-Based Access Control (RBAC) settings.
Verify that the Dashboard is running:
kubectl get pods -n kubernetes-dashboardLook for a pod with the name
kubernetes-dashboardand ensure its status isRunning.Verify the namespace for the Dashboard:
kubectl get ns | grep kubernetes-dashboardThe namespace
kubernetes-dashboardshould exist.
Create a Service Account and Role Binding
By default, Kubernetes Dashboard restricts access. To log in with admin privileges, you need to create a service account and bind it to a cluster role.
Create a file named
dashboard-admin.yaml:nano ~/project/dashboard-admin.yamlAdd the following content to the file:
apiVersion: v1
kind: ServiceAccount
metadata:
  name: admin-user
  namespace: kubernetes-dashboard
---
apiVersion: rbac.authorization.k8s.io/v1
kind: ClusterRoleBinding
metadata:
  name: admin-user
roleRef:
  apiGroup: rbac.authorization.k8s.io
  kind: ClusterRole
  name: cluster-admin
subjects:
  - kind: ServiceAccount
    name: admin-user
    namespace: kubernetes-dashboard
This file defines a service account admin-user and grants it admin privileges across the cluster.
Press Ctrl+X, Y, then Enter to save the file.
Apply the configuration:
kubectl apply -f dashboard-admin.yamlVerify the service account and role binding:
kubectl get sa -n kubernetes-dashboardYou should see the
admin-userservice account listed.kubectl get clusterrolebindingYou should see the
admin-usercluster role binding listed.
Access Kubernetes Dashboard
Now that the Dashboard is running and permissions are configured, access it via a browser.
Generate a login token:
kubectl -n kubernetes-dashboard create token admin-userCopy the generated token. This will be used to log in.
Edit the Dashboard Service to expose it on a NodePort:
kubectl edit service -n kubernetes-dashboard kubernetes-dashboardFind the
typefield underspecand change its value toNodePort. Save and exit.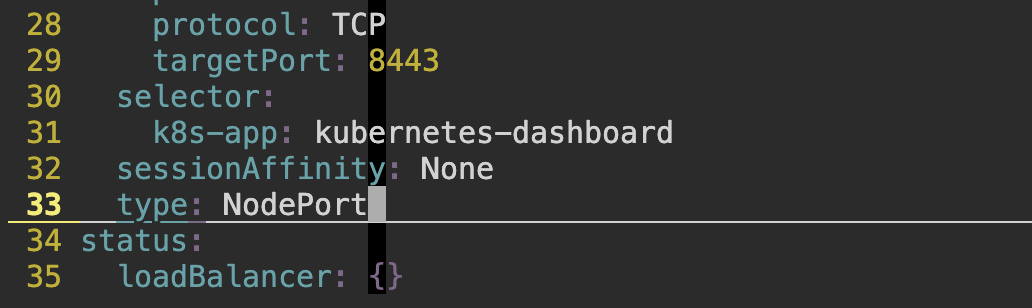
Find the NodePort assigned to the Dashboard:
kubectl get service -n kubernetes-dashboardNAME TYPE CLUSTER-IP EXTERNAL-IP PORT(S) AGE dashboard-metrics-scraper ClusterIP 10.104.164.172 <none> 8000/TCP 20m kubernetes-dashboard NodePort 10.108.222.153 <none> 443:30587/TCP 20mNote the port number listed under the
PORT(S)column (e.g.,30587). This is the port you will use to access the Dashboard.Retrieve the node's IP address:
kubectl get node -o wideNAME STATUS ROLES AGE VERSION INTERNAL-IP EXTERNAL-IP OS-IMAGE KERNEL-VERSION CONTAINER-RUNTIME minikube Ready control-plane 35m v1.26.1 192.168.58.2 <none> Ubuntu 20.04.5 LTS 5.15.0-56-generic docker://20.10.23The
INTERNAL-IPcolumn provides the node's IP address.Open the Firefox browser on the desktop and navigate to the following URL:
https://<node-ip>:<node-port>Replace
<node-ip>with the node's IP address and<node-port>with the port from Step 3.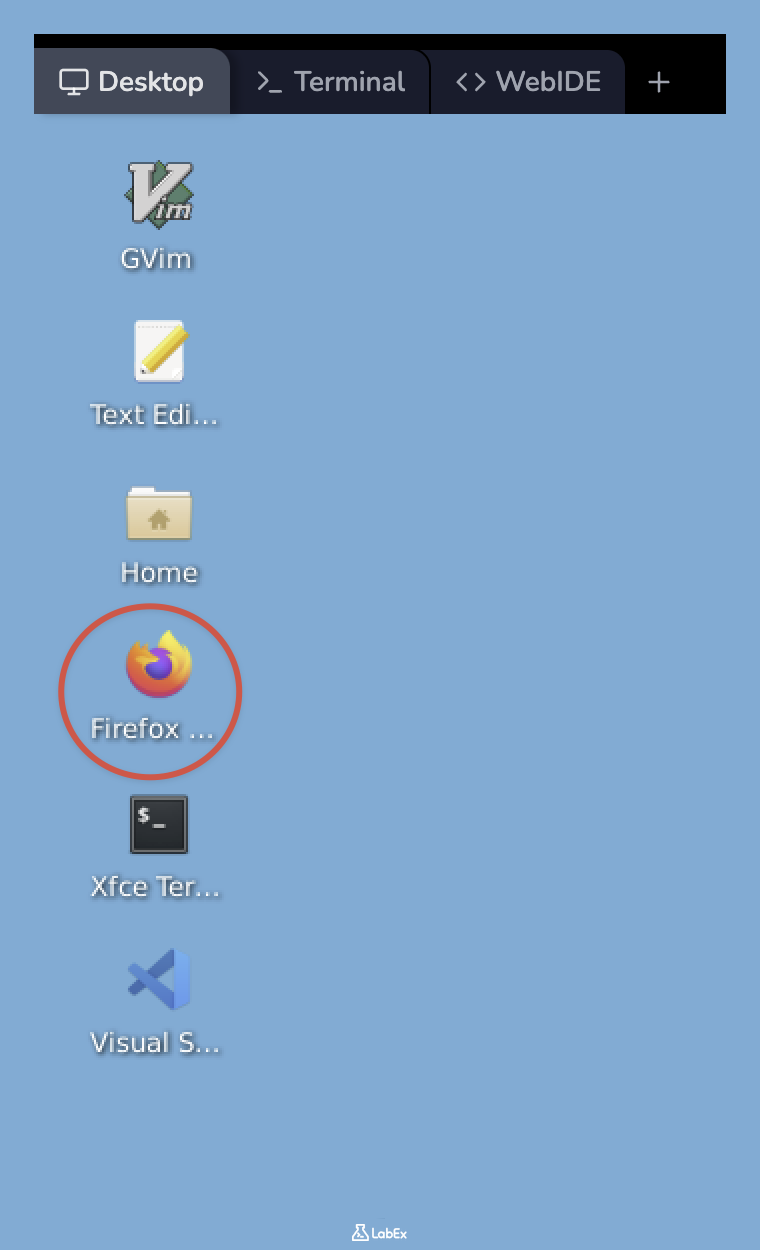
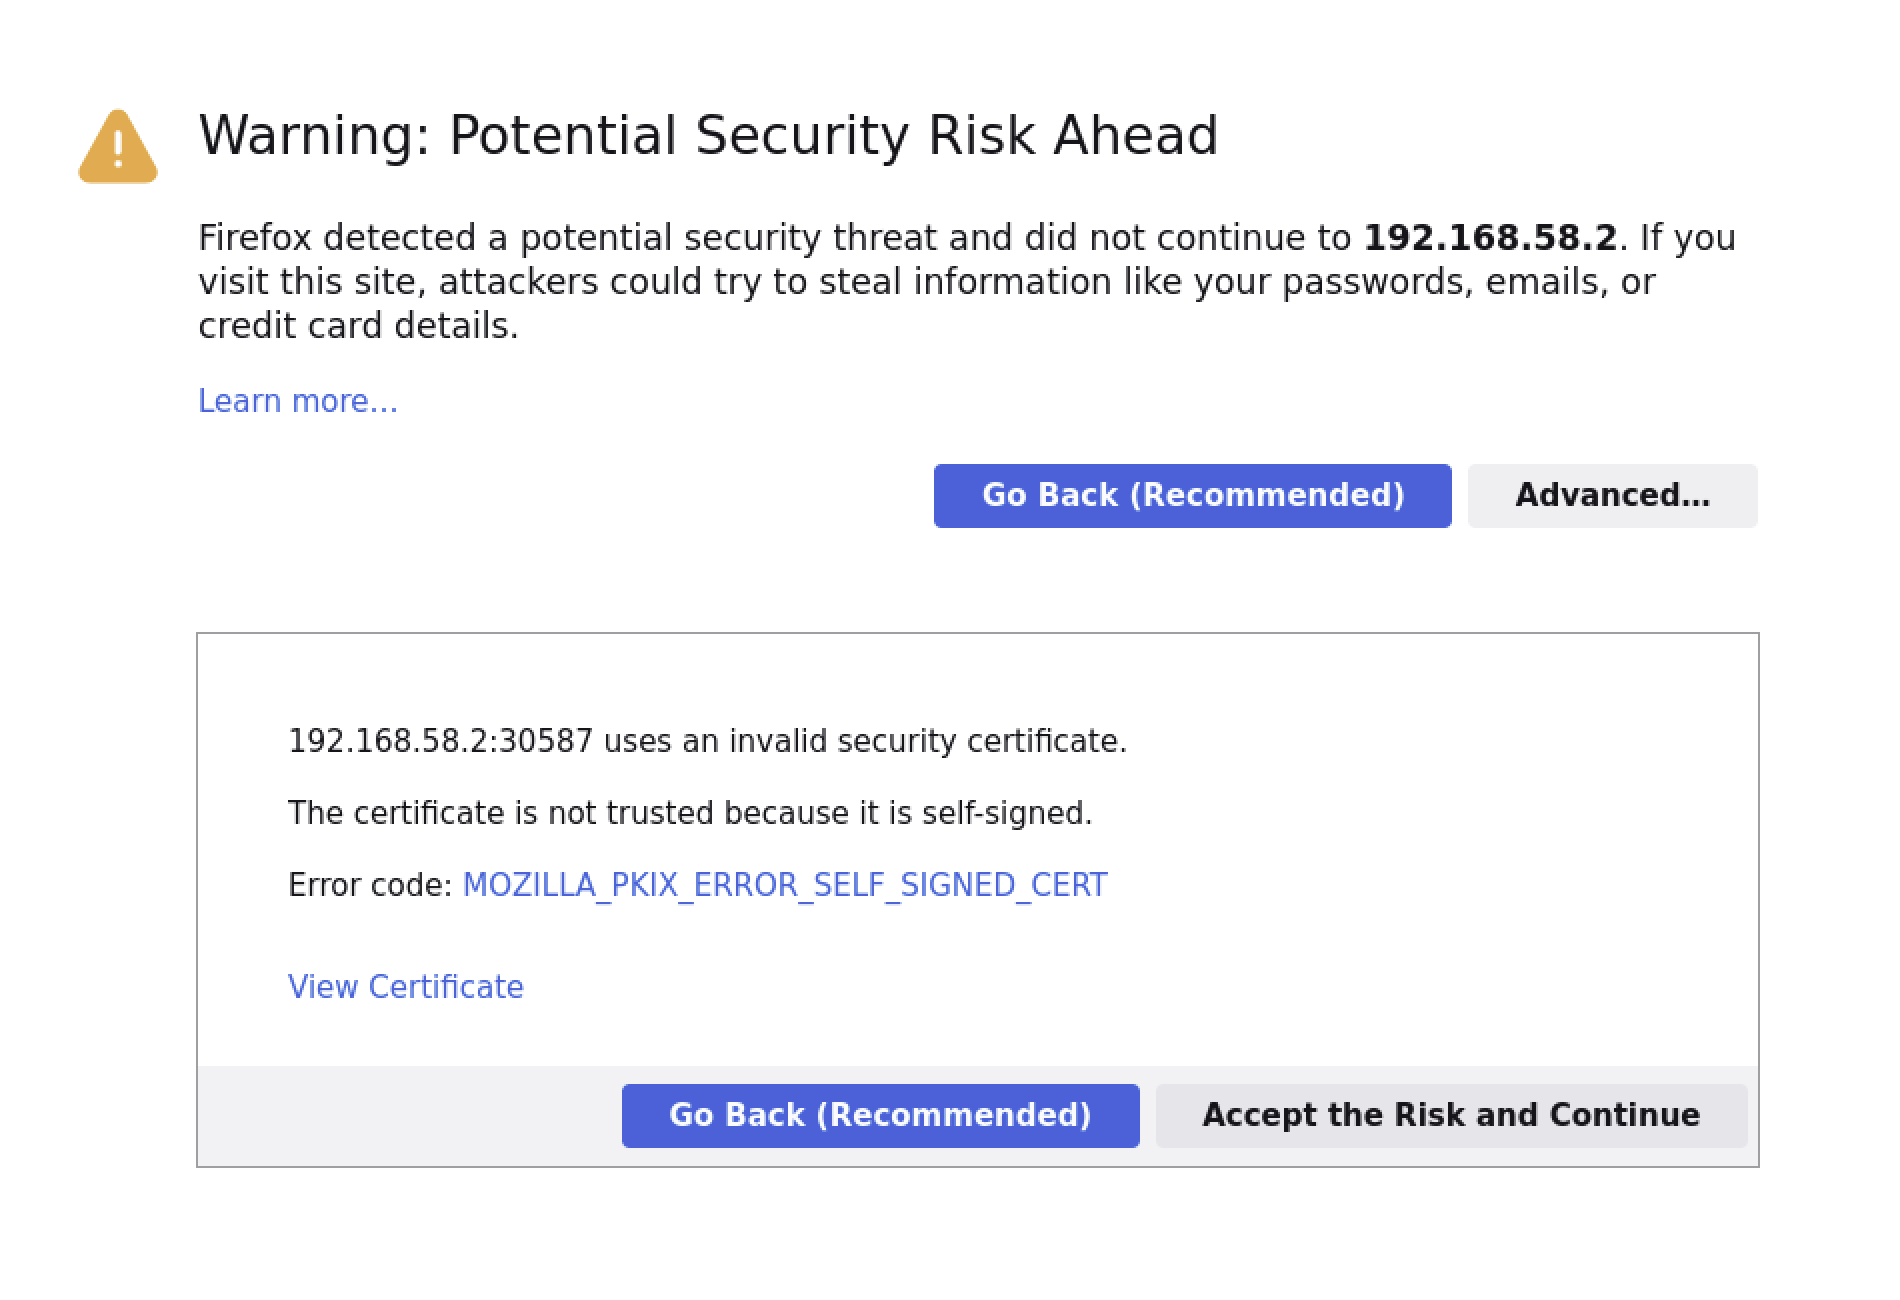
If prompted with a security warning, proceed by selecting "Advanced" and then "Accept the Risk and Continue."
- On the login page, select the Token option, paste (right click) the token from Step 1, and click "Sign In."
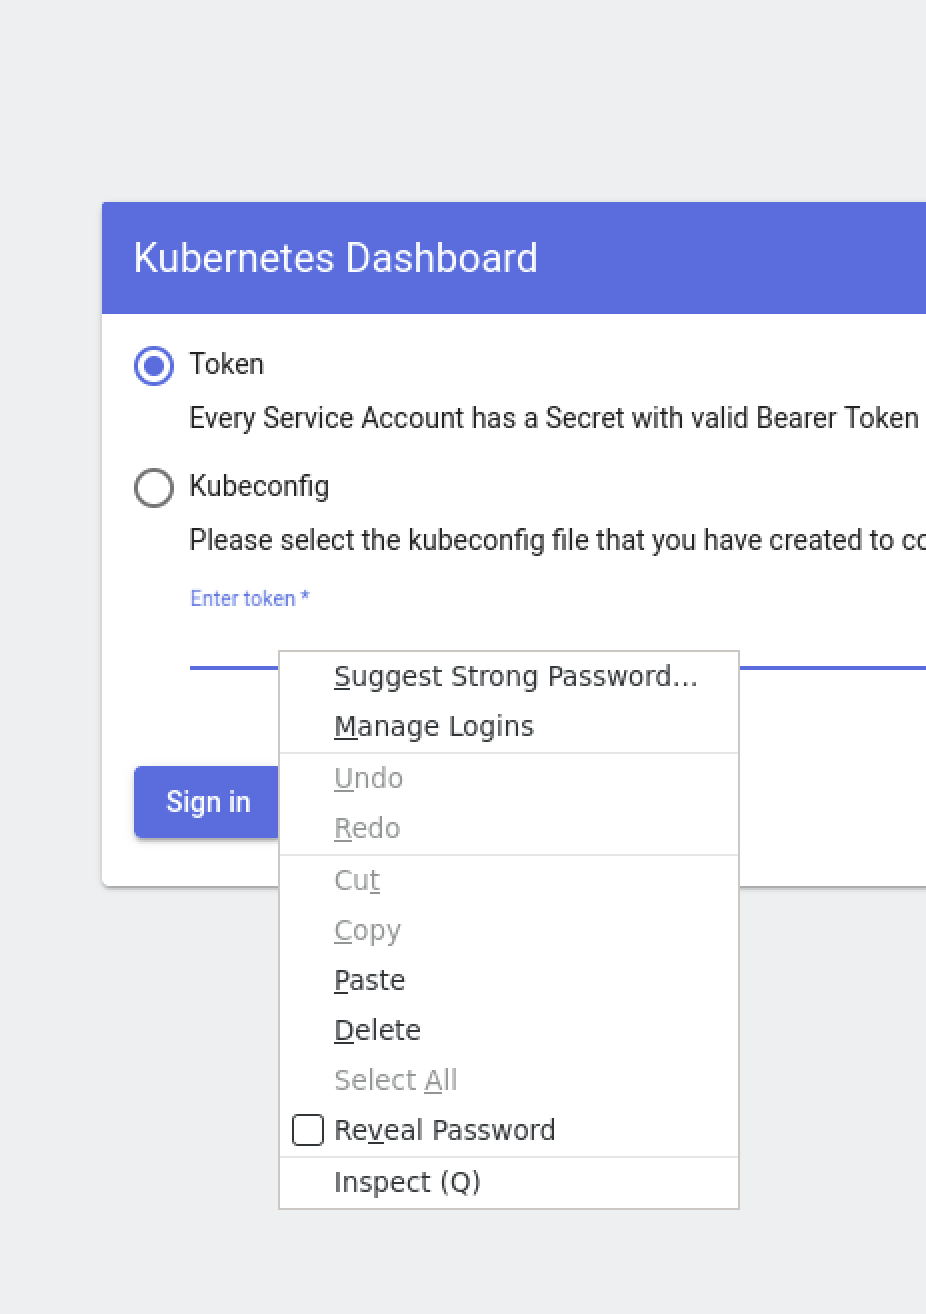
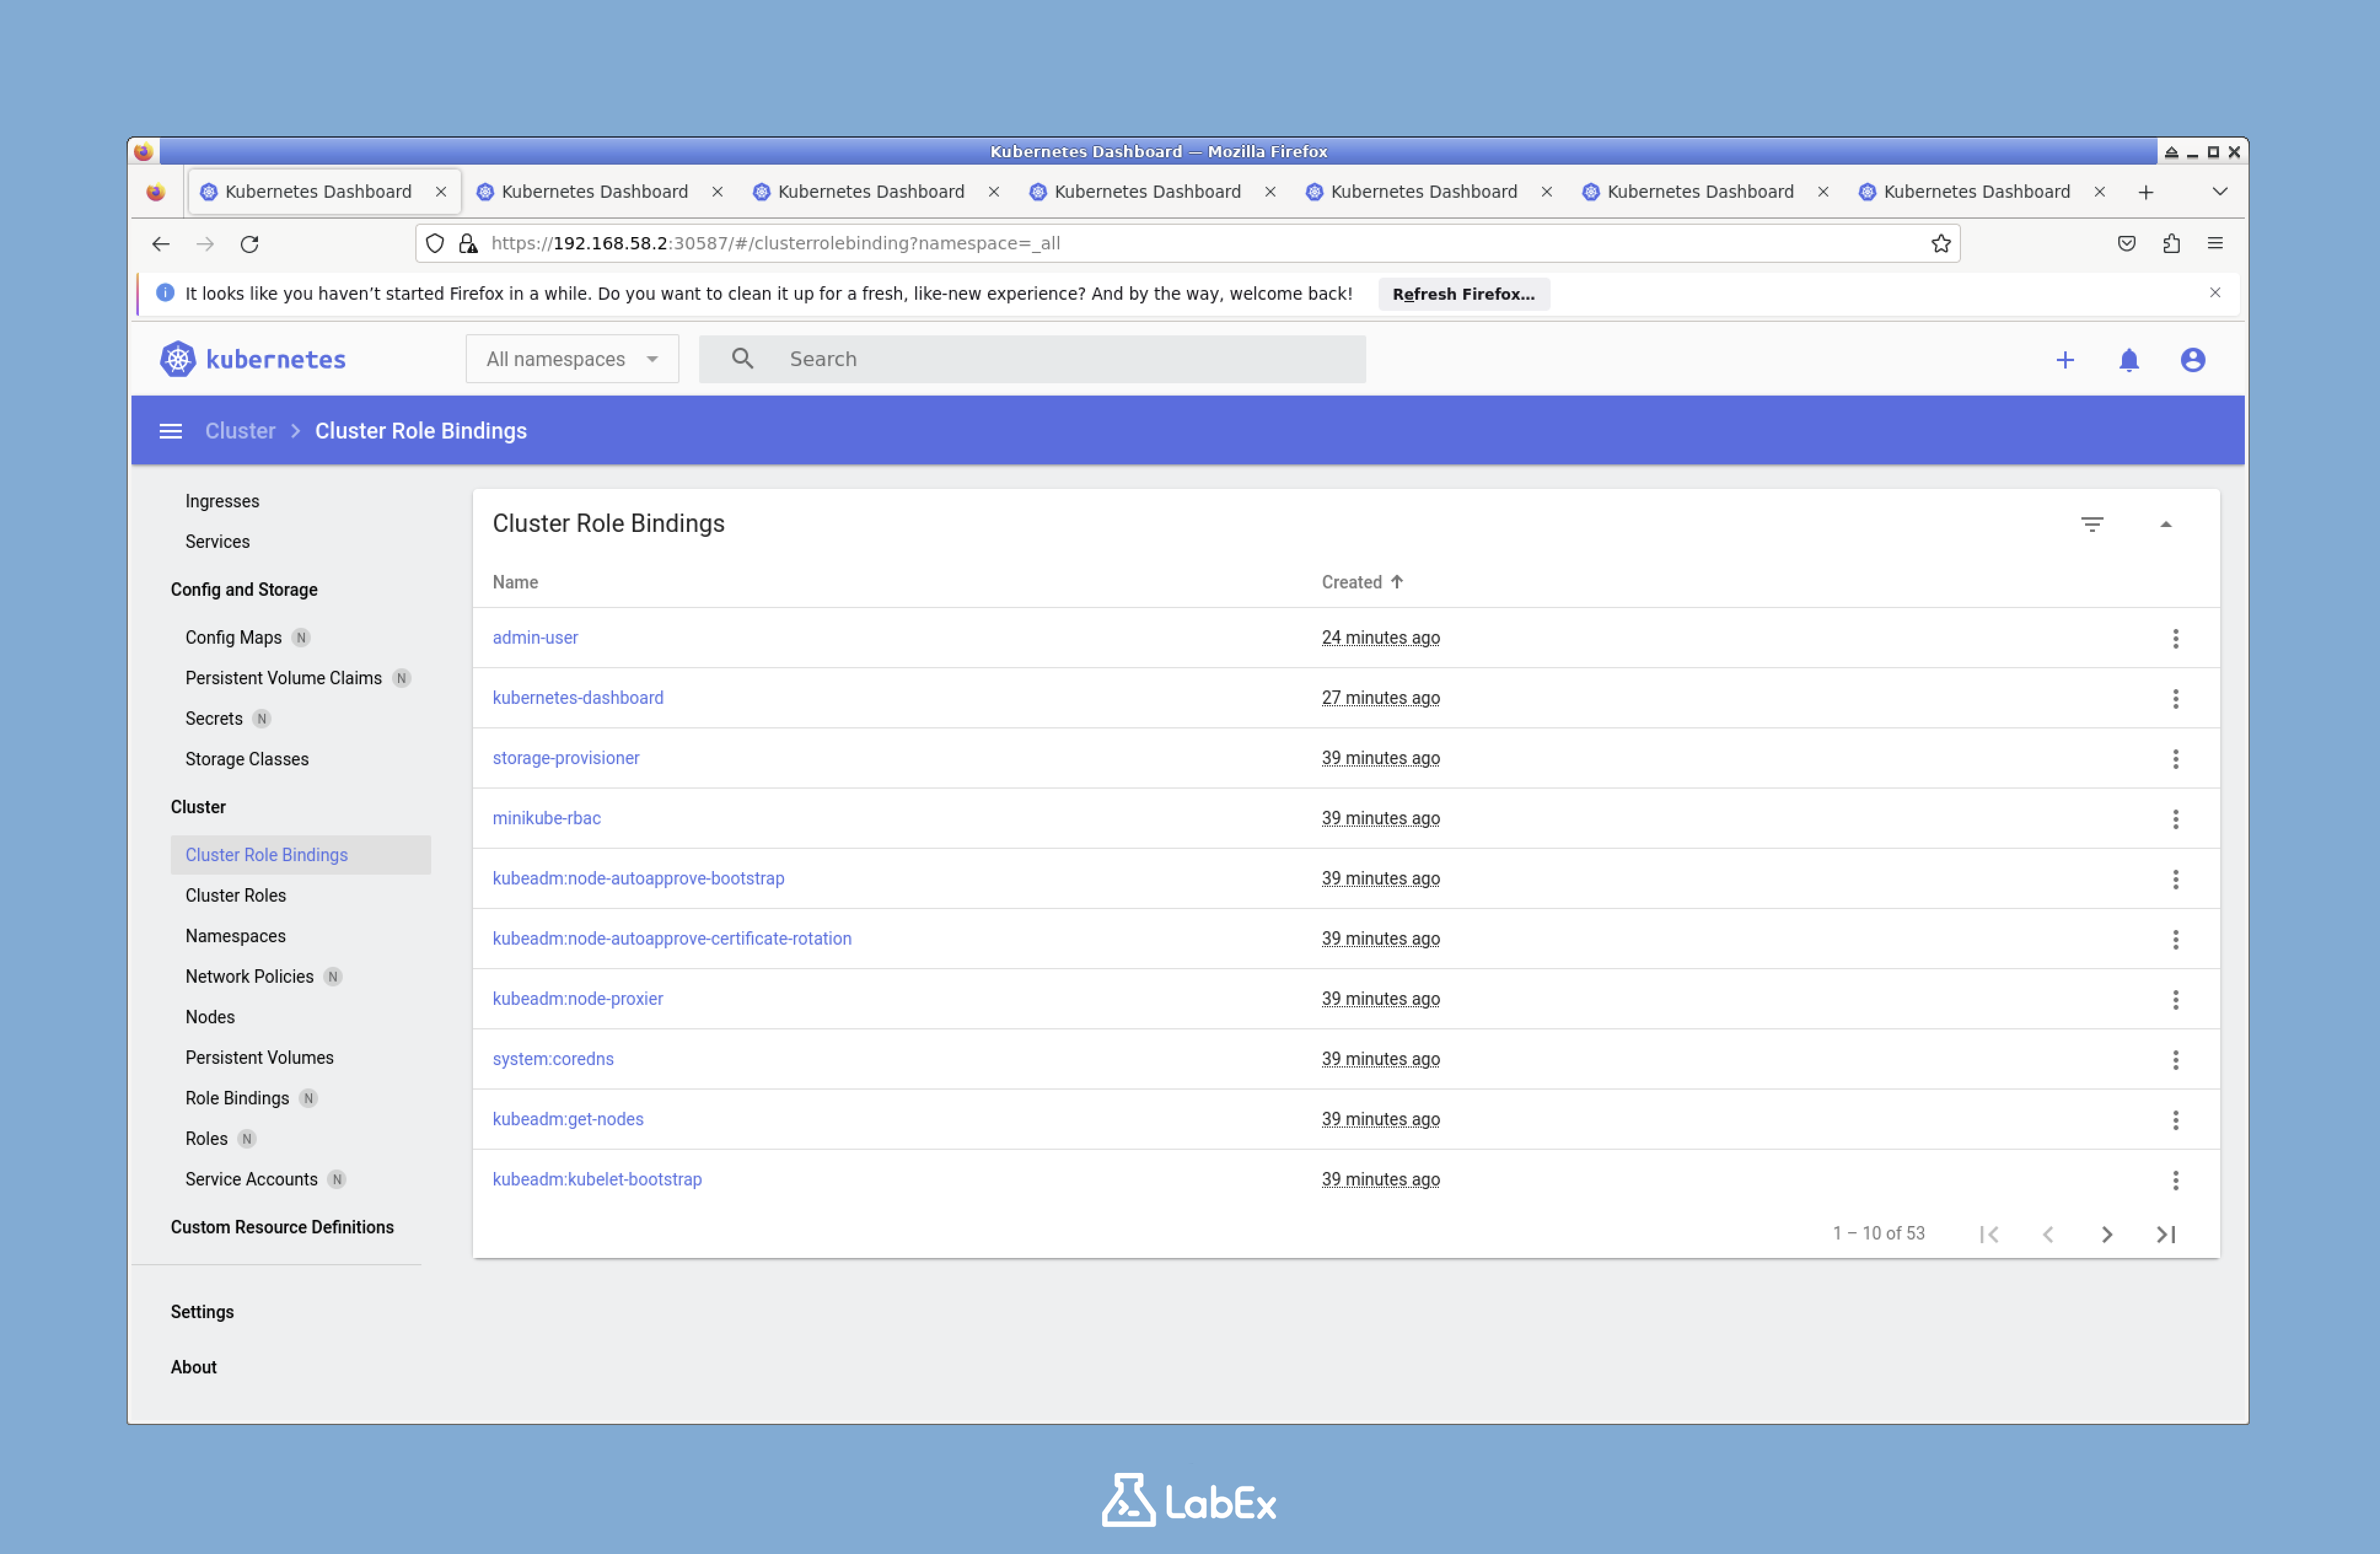
You should now be logged into the Kubernetes Dashboard, where you can explore cluster resources and manage workloads.
Summary
In this lab, you learned how to:
- Deploy Kubernetes Dashboard to a local cluster.
- Create a service account and bind it to a cluster role for admin access.
- Access the Dashboard via a browser using a NodePort service.
With Kubernetes Dashboard, you can visually manage applications, monitor resources, and explore cluster configurations. This tool simplifies Kubernetes operations, especially for beginners transitioning from command-line workflows. Keep exploring its features to make the most of your Kubernetes environment!