Introduction
In this lab, you will explore and debug Kubernetes applications. You will start a local Kubernetes cluster using Minikube, deploy a sample application, and learn various debugging techniques such as inspecting application configuration, viewing logs, running commands inside pods, and examining cluster events. These skills are essential for developing and troubleshooting Kubernetes-based applications.
Start the Kubernetes Cluster
In this step, you'll learn how to start and verify a local Kubernetes cluster using Minikube. This is an essential first step for developing and testing Kubernetes applications on your local machine.
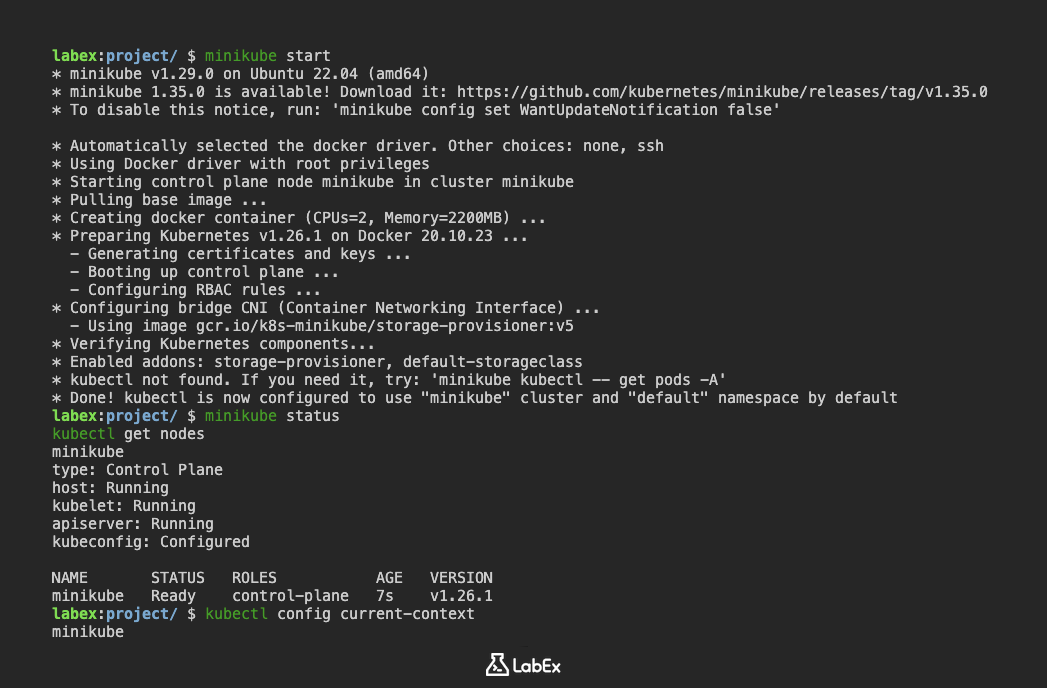
First, start the Minikube cluster:
minikube start
Example output:
😄  minikube v1.29.0 on Ubuntu 22.04
✨  Automatically selected the docker driver
📌  Using Docker driver with root permissions
🔥  Creating kubernetes in kubernetes cluster
🔄  Restarting existing kubernetes cluster
🐳  Preparing Kubernetes v1.26.1 on Docker 20.10.23 ...
🚀  Launching Kubernetes ...
🌟  Enabling addons: storage-provisioner, default-storageclass
🏄  Done! kubectl is now configured to use "minikube" cluster and "default" namespace
Now, verify the cluster status using multiple commands:
minikube status
kubectl get nodes
Example output:
minikube
type: Control Plane
host: Running
kubelet: Running
apiserver: Running
kubeconfig: Configured

NAME       STATUS   ROLES           AGE   VERSION
minikube   Ready    control-plane   1m    v1.26.1
These commands confirm that:
- Minikube is running successfully
- A local Kubernetes cluster has been created
- The cluster is ready to use
- You have a single-node cluster with control plane capabilities
Let's check the cluster's context to ensure you're connected to the correct cluster:
kubectl config current-context
Example output:
minikube
This verifies that kubectl is configured to use the Minikube cluster.
Deploy a Sample Application
In this step, you'll learn how to create and deploy a simple Kubernetes application using YAML manifests. We'll create both a Pod and a Deployment to demonstrate different ways of deploying applications.
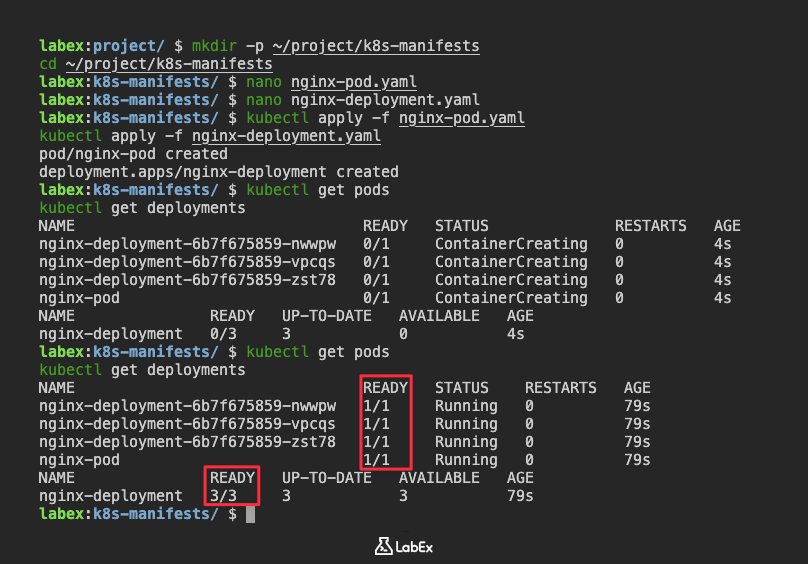
First, create a directory for your Kubernetes manifests:
mkdir -p ~/project/k8s-manifests
cd ~/project/k8s-manifests
Create a simple NGINX Pod manifest:
nano nginx-pod.yaml
Add the following content:
apiVersion: v1
kind: Pod
metadata:
  name: nginx-pod
  labels:
    app: nginx
spec:
  containers:
    - name: nginx
      image: nginx:latest
      ports:
        - containerPort: 80
Press Ctrl+X, then Y, and Enter to save and exit.
Now, create a Deployment manifest:
nano nginx-deployment.yaml
Add the following content:
apiVersion: apps/v1
kind: Deployment
metadata:
  name: nginx-deployment
  labels:
    app: nginx
spec:
  replicas: 3
  selector:
    matchLabels:
      app: nginx
  template:
    metadata:
      labels:
        app: nginx
    spec:
      containers:
        - name: nginx
          image: nginx:latest
          ports:
            - containerPort: 80
Apply the manifests to create the resources:
kubectl apply -f nginx-pod.yaml
kubectl apply -f nginx-deployment.yaml
Example output:
pod/nginx-pod created
deployment.apps/nginx-deployment created
Verify the created resources:
kubectl get pods
kubectl get deployments
Example output:
NAME                                READY   STATUS    RESTARTS   AGE
nginx-pod                           1/1     Running   0          1m
nginx-deployment-xxx-yyy            1/1     Running   0          1m
nginx-deployment-xxx-zzz            1/1     Running   0          1m
nginx-deployment-xxx-www            1/1     Running   0          1m

NAME               READY   UP-TO-DATE   AVAILABLE   AGE
nginx-deployment   3/3     3            3           1m
Wait for the deployment to create the replicas. The READY column should show 3/3 when all replicas are ready.
Key differences between Pod and Deployment:
- Pod: Single instance of an application
- Deployment: Manages multiple replicas and provides self-healing
Check Application Configuration
In this step, you'll learn how to inspect and retrieve the configuration details of Kubernetes Deployments and Pods using various kubectl commands. Understanding how to examine resource configurations is crucial for troubleshooting and understanding your application's setup.
First, let's retrieve the YAML configuration of the Pod we created in the previous step:
kubectl get pod nginx-pod -o yaml
Example output (partial):
apiVersion: v1
kind: Pod
metadata:
  name: nginx-pod
  namespace: default
  labels:
    app: nginx
spec:
  containers:
    - image: nginx:latest
      imagePullPolicy: Always
      name: nginx
      ports:
        - containerPort: 80
      resources: {}
  dnsPolicy: ClusterFirst
  restartPolicy: Always
Now, let's examine the Deployment configuration:
kubectl get deployment nginx-deployment -o yaml
Example output (partial):
apiVersion: apps/v1
kind: Deployment
metadata:
  name: nginx-deployment
  namespace: default
  labels:
    app: nginx
spec:
  replicas: 3
  selector:
    matchLabels:
      app: nginx
  template:
    metadata:
      labels:
        app: nginx
    spec:
      containers:
        - name: nginx
          image: nginx:latest
          ports:
            - containerPort: 80
Use kubectl describe to get more detailed information about resources:
kubectl describe pod nginx-pod
kubectl describe deployment nginx-deployment
Example output for describe pod (partial):
Name:         nginx-pod
Namespace:    default
Priority:     0
Node:         minikube/172.17.0.2
Start Time:   [timestamp]
Labels:       app=nginx
Annotations:  <none>
Status:       Running
IP:           172.17.0.5
Containers:
  nginx:
    Container ID:   docker://[container-id]
    Image:          nginx:latest
    Image ID:       docker-pullable://nginx@[image-digest]
    Port:           80/TCP
    Host Port:      0/TCP
    State:          Running
    Ready:          True
    Restart Count:  0
Conditions:
  Type              Status
  Initialized       True
  Ready             True
  ContainersReady   True
  PodScheduled      True
You can also use JSON output for more machine-readable formats:
kubectl get pod nginx-pod -o json
Key things to look for when inspecting configurations:
- Resource metadata (name, labels, namespace)
- Container image and ports
- Replica count (for Deployments)
- Resource status and conditions
View Logs of an Application
In this step, you'll learn how to view and inspect logs for Kubernetes Pods using kubectl logs. Viewing logs is crucial for understanding application behavior, debugging issues, and monitoring application performance.
First, list the available Pods to ensure you're working with the correct resources:
kubectl get pods
Example output:
NAME                                READY   STATUS    RESTARTS   AGE
nginx-pod                           1/1     Running   0          20m
nginx-deployment-xxx-yyy            1/1     Running   0          20m
nginx-deployment-xxx-zzz            1/1     Running   0          20m
nginx-deployment-xxx-www            1/1     Running   0          20m
View logs for a specific Pod:
## View logs for the nginx-pod
kubectl logs nginx-pod
Example output:
/docker-entrypoint.sh: /docker-entrypoint.d/ is not empty, will attempt to perform configuration
/docker-entrypoint.sh: Looking for shell scripts in /docker-entrypoint.d/
/docker-entrypoint.sh: Launching /docker-entrypoint.d/10-listen-on-ipv6-by-default.sh
...
2023/xx/xx [notice] xxxx#x: signal process started
View logs for a Deployment's Pods:
## View logs for a specific pod in the deployment
POD_NAME=$(kubectl get pods -l app=nginx | grep nginx-deployment | head -n 1 | awk '{print $1}')
kubectl logs $POD_NAME
Explore additional log viewing options:
## View last 50 lines of logs
kubectl logs nginx-pod --tail=50

## Follow logs in real-time
kubectl logs -f nginx-pod
Example of following logs:
[real-time log output will be displayed]
Exit the real-time log view by pressing Ctrl + C.
For multi-container Pods, specify the container name:
## If a Pod has multiple containers
kubectl logs nginx-pod -c nginx
Key log viewing techniques:
- View entire log history
- Limit log lines
- Follow logs in real-time
- Specify container in multi-container Pods
Debug Using kubectl exec
In this step, you'll learn how to use kubectl exec to run commands inside a Kubernetes Pod, which is essential for debugging and investigating container environments.
First, verify the available Pods:
kubectl get pods
Example output:
NAME                                READY   STATUS    RESTARTS   AGE
nginx-pod                           1/1     Running   0          30m
nginx-deployment-xxx-yyy            1/1     Running   0          30m
nginx-deployment-xxx-zzz            1/1     Running   0          30m
nginx-deployment-xxx-www            1/1     Running   0          30m
Run an interactive shell in the nginx-pod:
kubectl exec -it nginx-pod -- /bin/bash
Example interactions inside the Pod:
## Check nginx configuration
cat /etc/nginx/nginx.conf

## Verify installed packages
apt update && apt list --installed

## Exit the pod shell
exit
Make sure to exit the interactive shell to return to the shell prompt.
Run specific commands without entering an interactive shell:
## Check nginx version
kubectl exec nginx-pod -- nginx -v

## List files in the web root
kubectl exec nginx-pod -- ls /usr/share/nginx/html
For Deployment Pods, select a specific Pod:
## Get a Pod name from the deployment
POD_NAME=$(kubectl get pods -l app=nginx | grep nginx-deployment | head -n 1 | awk '{print $1}')

## Run commands in the deployment's Pod
kubectl exec -it $POD_NAME -- /bin/bash
Key kubectl exec techniques:
- Run interactive shells
- Execute specific commands
- Investigate Pod internals
- Debug container configurations
Use kubectl describe for Troubleshooting
In this step, you'll learn how to use kubectl describe to diagnose and troubleshoot Kubernetes resources, providing detailed insights into Pod, Deployment, and cluster component statuses.
First, let's create a troublesome deployment to demonstrate debugging:
cd ~/project/k8s-manifests
nano problematic-deployment.yaml
Add the following content:
apiVersion: apps/v1
kind: Deployment
metadata:
  name: debug-deployment
spec:
  replicas: 2
  selector:
    matchLabels:
      app: debug
  template:
    metadata:
      labels:
        app: debug
    spec:
      containers:
        - name: debug-container
          image: non-existent-image:latest
          ports:
            - containerPort: 80
Apply the deployment:
kubectl apply -f problematic-deployment.yaml
Now, use kubectl describe to investigate the deployment:
kubectl describe deployment debug-deployment
Example output:
Name:                   debug-deployment
Namespace:              default
CreationTimestamp:      [timestamp]
Labels:                 <none>
Annotations:            deployment.kubernetes.io/revision: 1
Selector:               app=debug
Replicas:               2 desired | 0 available | 2 total | 2 unavailable
StrategyType:           RollingUpdate
MinReadySeconds:        0
RollingUpdateStrategy:  25% max unavailable, 25% max surge
Conditions:
  Type           Status   Reason
  ----           ------   ------
  Available      False    MinimumReplicasUnavailable
  Progressing    False    ProgressDeadlineExceeded
OldReplicaSets:  <none>
NewReplicaSet:   debug-deployment-xxx (2/2 replicas created)
Events:
  Type     Reason                    Age   From                   Message
  ----     ------                    ----  ----                   -------
  Warning  FailedCreate              1m    deployment-controller  Failed to create pod
  Normal   ScalingReplicaSet         1m    deployment-controller  Scaled up replica set
Describe the Pods to get more details:
kubectl describe pods -l app=debug
Example output:
Name:           debug-deployment-xxx-yyy
Namespace:      default
Priority:       0
Node:           minikube/172.17.0.2
Start Time:     [timestamp]
Labels:         app=debug
Annotations:    <none>
Status:         Pending
Conditions:
  Type           Status
  Initialized    True
  Ready          False
  PodScheduled   True
Events:
  Type     Reason                  Age   From               Message
  ----     ------                  ----  ----               -------
  Warning  FailedCreatePodSandBox  1m    kubelet            Failed to create pod sandbox
  Warning  Failed                  1m    kubelet            Failed to pull image
Describe node resources:
kubectl describe nodes minikube
Key troubleshooting techniques:
- Identify deployment and pod status
- View detailed error messages
- Understand why resources are not running
- Check node and cluster conditions
Examine Cluster Events (kubectl get events) for Clues and Timelines
In this step, you'll learn how to use kubectl get events to investigate cluster-wide events, understand system activities, and diagnose issues across your Kubernetes environment.
First, view all cluster events:
kubectl get events
Example output:
LAST SEEN   TYPE      REASON                 OBJECT                           MESSAGE
10m         Warning   FailedCreate           deployment/debug-deployment     Failed to create pod
5m          Normal    Scheduled              pod/nginx-pod                   Successfully assigned default/nginx-pod to minikube
3m          Normal    Pulled                 pod/nginx-deployment-xxx-yyy    Container image "nginx:latest" already present on machine
Filter events by namespace:
kubectl get events -n default
Use more detailed event viewing options:
## Watch events in real-time
kubectl get events -w

## Get events sorted by timestamp
kubectl get events --sort-by='.metadata.creationTimestamp'
Create a custom event-generating scenario:
cd ~/project/k8s-manifests
nano event-test-deployment.yaml
Add the following content:
apiVersion: apps/v1
kind: Deployment
metadata:
  name: event-test
spec:
  replicas: 3
  selector:
    matchLabels:
      app: event-test
  template:
    metadata:
      labels:
        app: event-test
    spec:
      containers:
        - name: nginx
          image: nginx:latest
          resources:
            limits:
              cpu: "100m"
              memory: "50Mi"
Apply the deployment and examine events:
kubectl apply -f event-test-deployment.yaml
kubectl get events
Advanced event filtering:
## Filter by event type
kubectl get events --field-selector type=Warning

## Filter by specific resource
kubectl get events --field-selector involvedObject.kind=Deployment
Key event examination techniques:
- View cluster-wide events
- Filter events by namespace
- Real-time event watching
- Identify warning and error events
Summary
In this lab, you learned how to start and verify a local Kubernetes cluster using Minikube, which is an essential first step for developing and testing Kubernetes applications on your local machine. You also learned how to create and deploy a simple Kubernetes application using YAML manifests, including both a Pod and a Deployment. Additionally, you explored various commands to inspect the configuration, view logs, debug, and troubleshoot the application, gaining a better understanding of how to manage and monitor Kubernetes applications.