Network Analysis with Wireshark

Cyber SecurityCyber SecurityBeginner
Practice Now

Introduction

In this lab, you'll embark on an exciting journey into the world of network analysis using Wireshark, a powerful tool in the cybersecurity field. Imagine you're a digital detective, tasked with understanding the complex conversations happening on a computer network. How do you see what's really going on beneath the surface? This is where Wireshark comes in.

Wireshark is like a microscope for network traffic. It allows you to capture and inspect the data traveling across a network in real-time. This capability is crucial for troubleshooting network issues, detecting unusual activity, and understanding how applications communicate.

By the end of this lab, you'll have hands-on experience with:

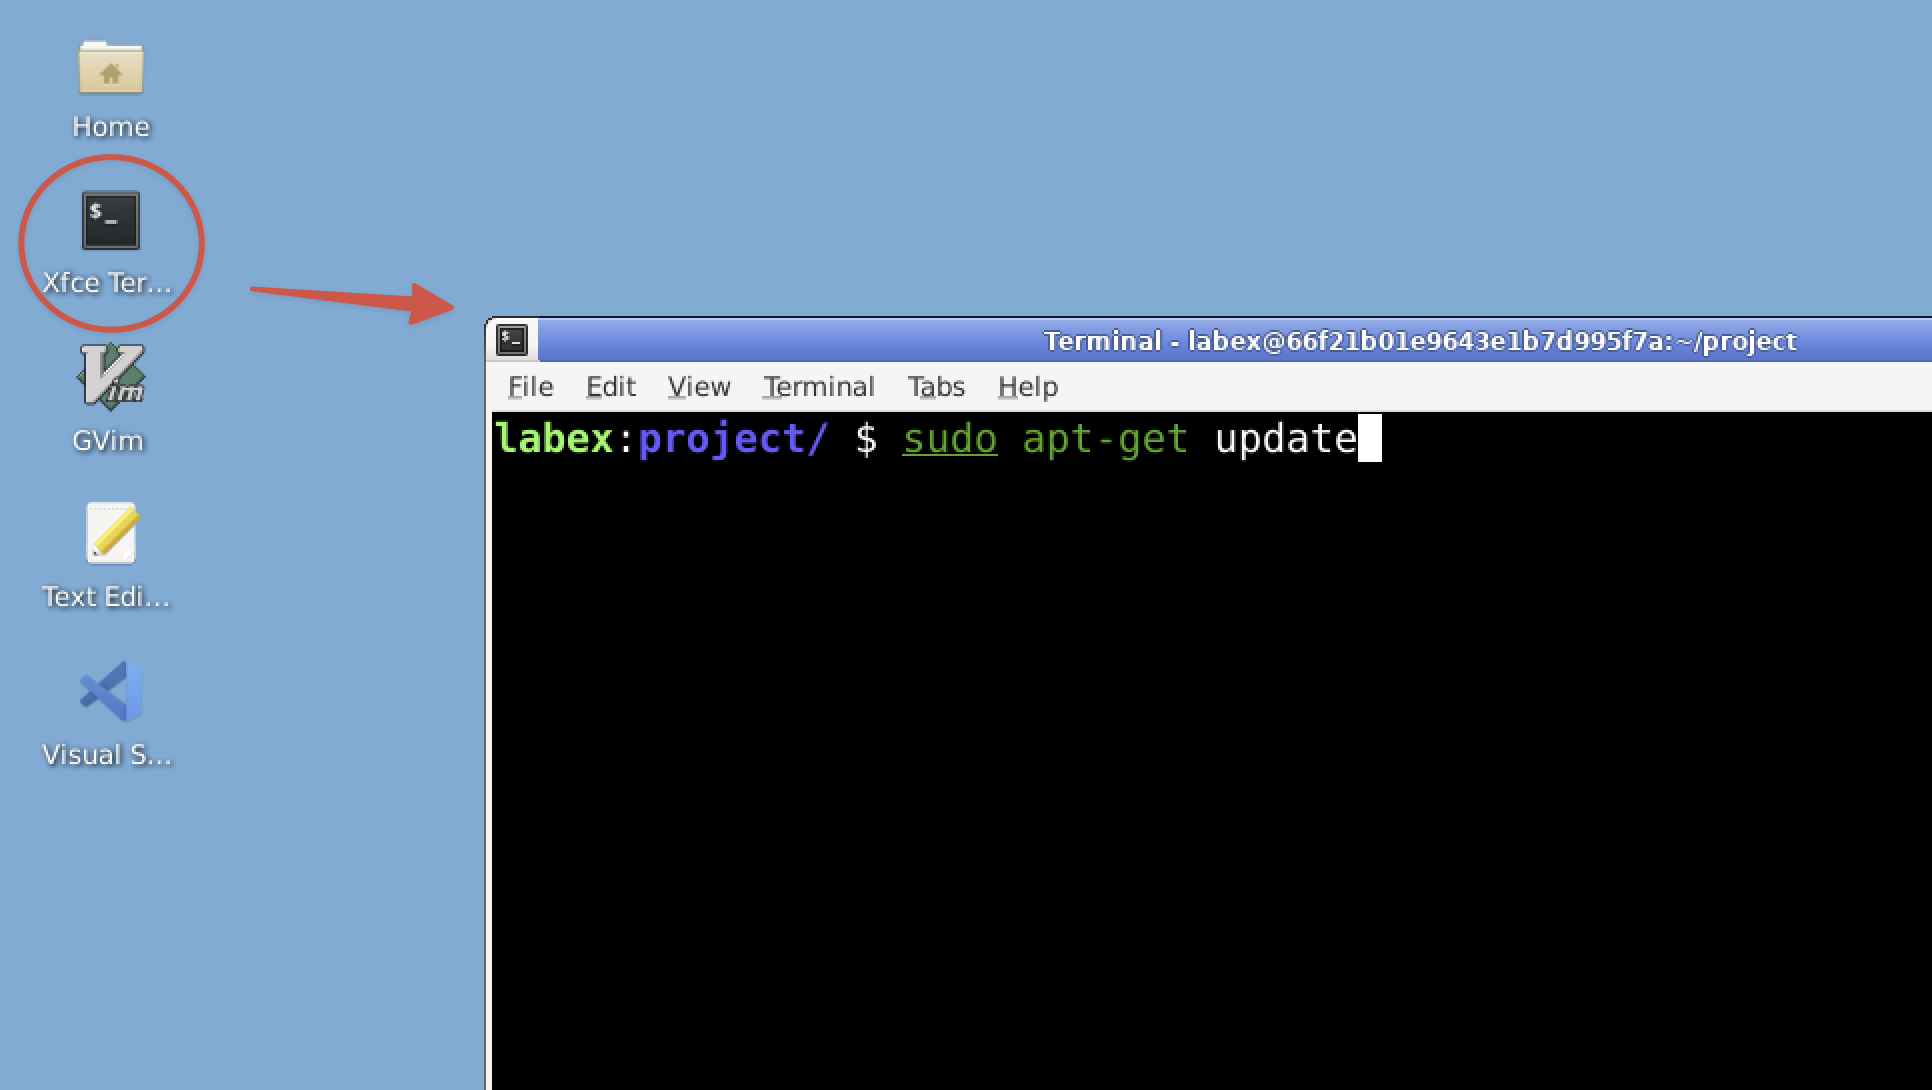
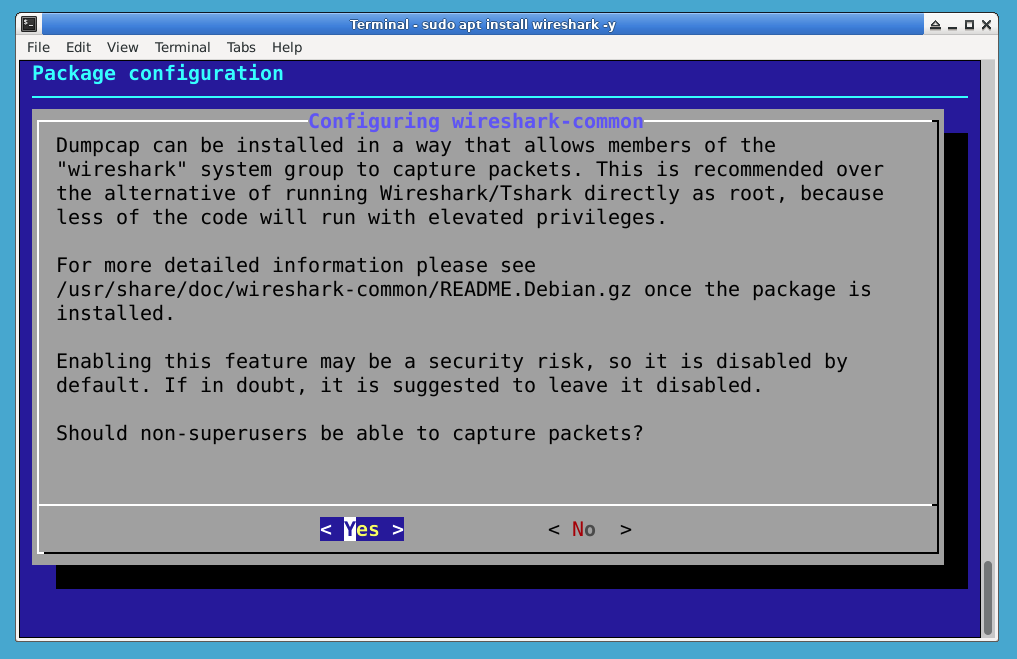
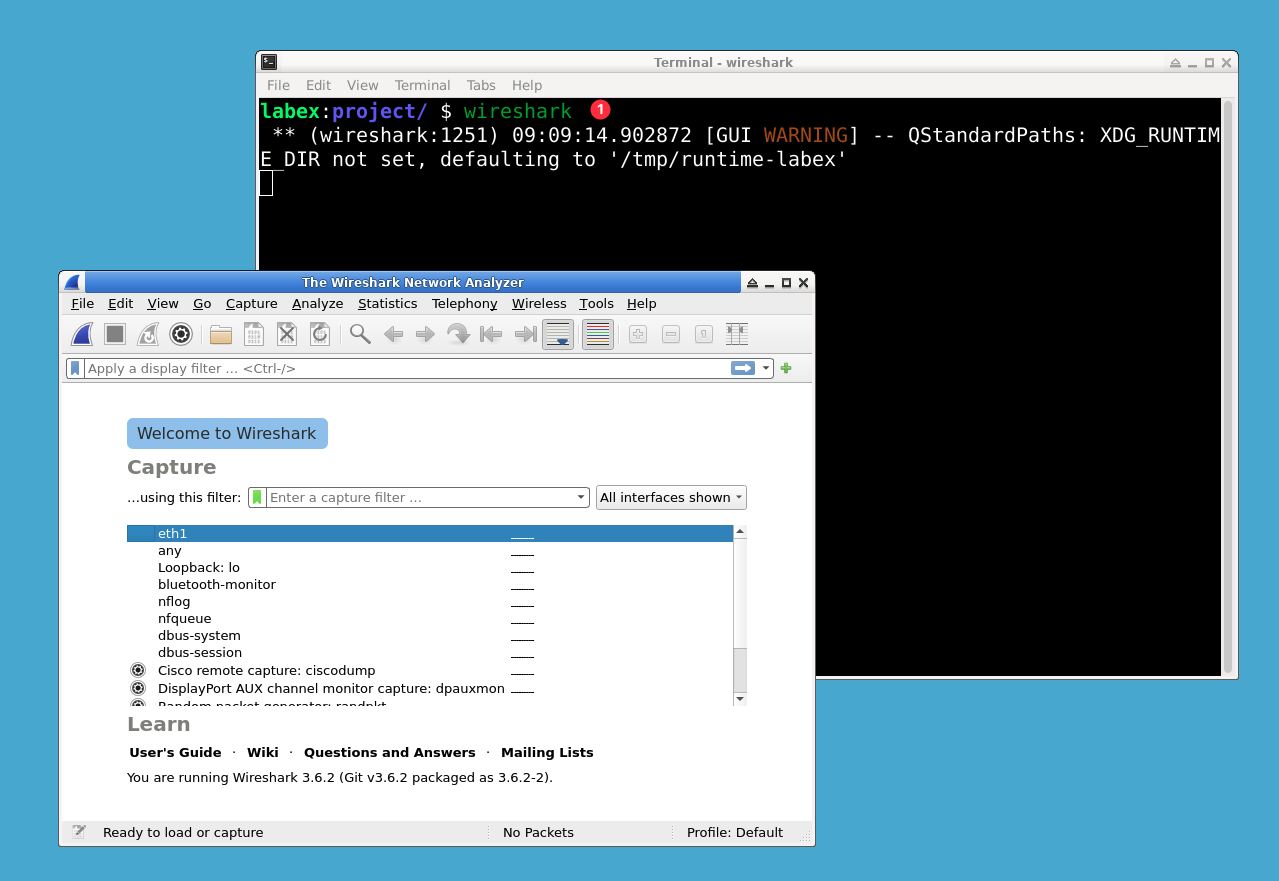
  1. Installing and setting up Wireshark
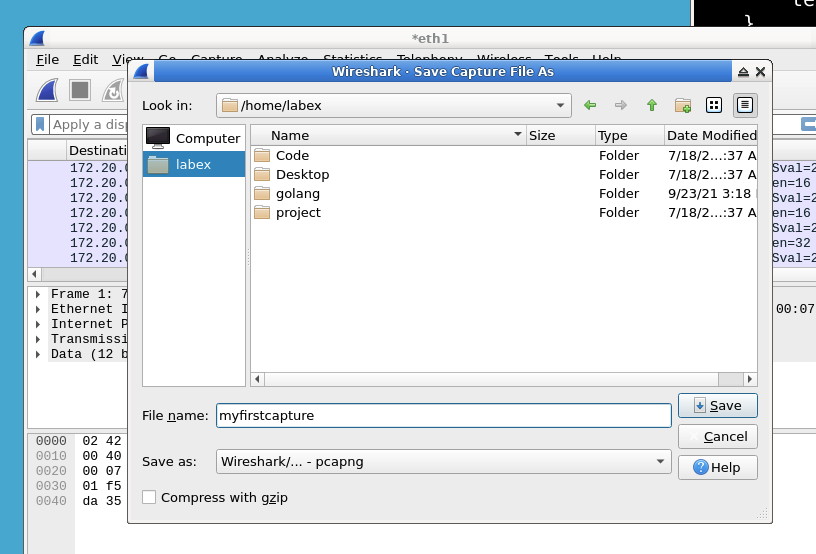
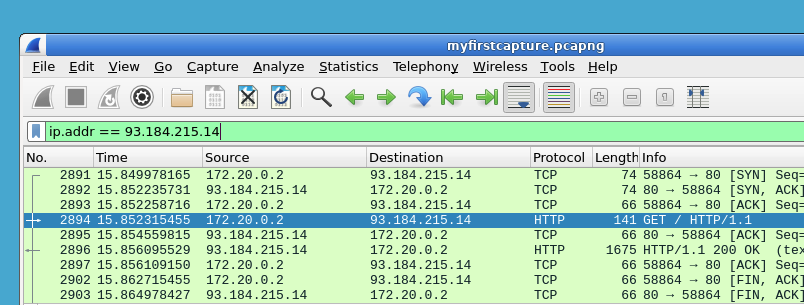
  2. Capturing network traffic
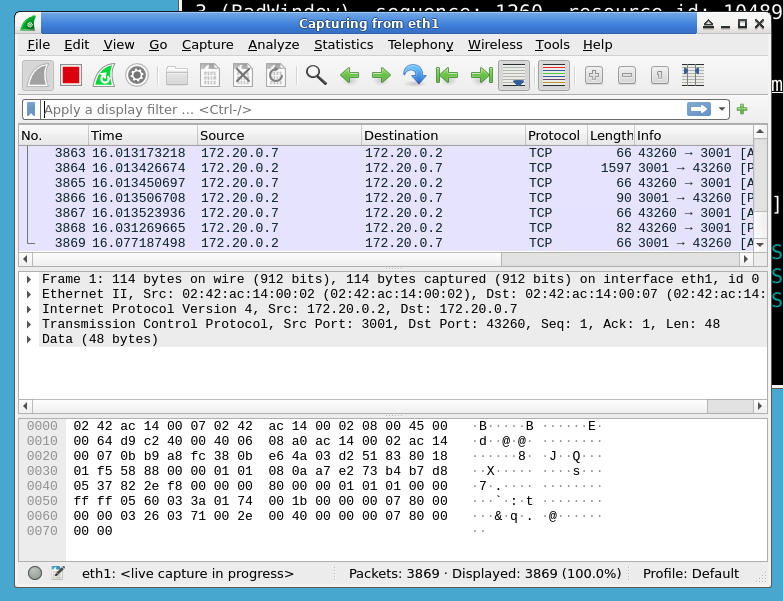
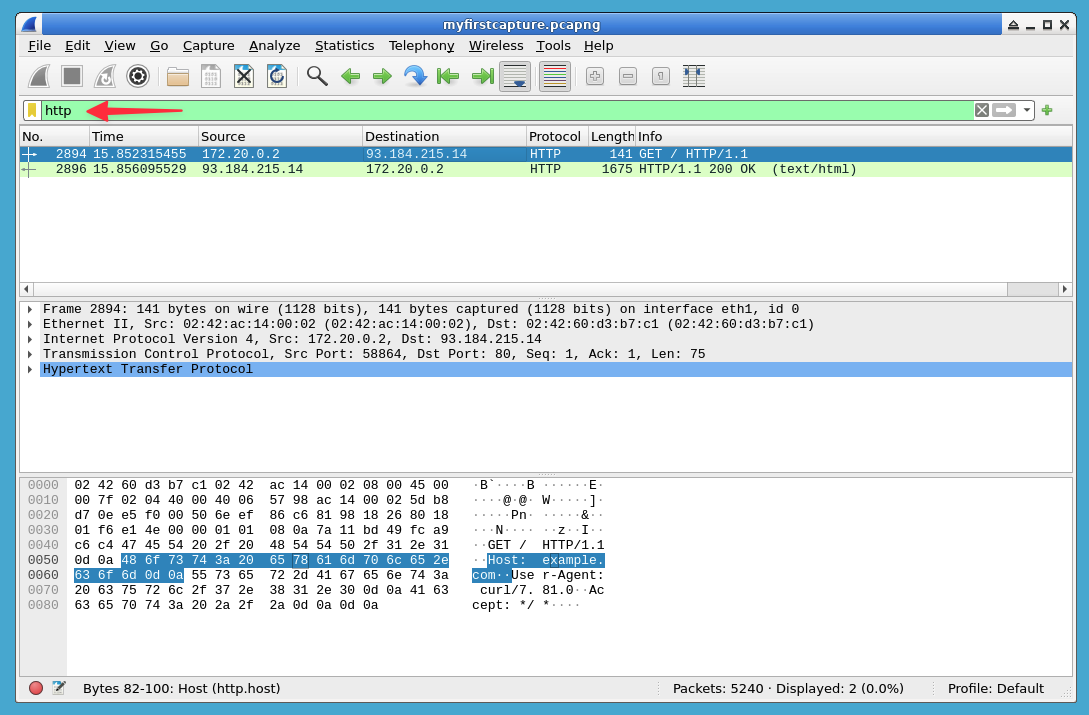
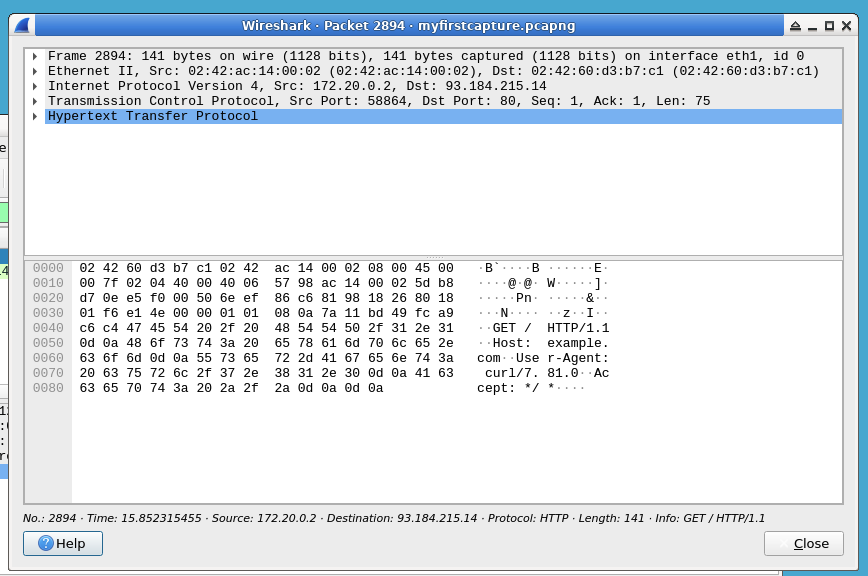
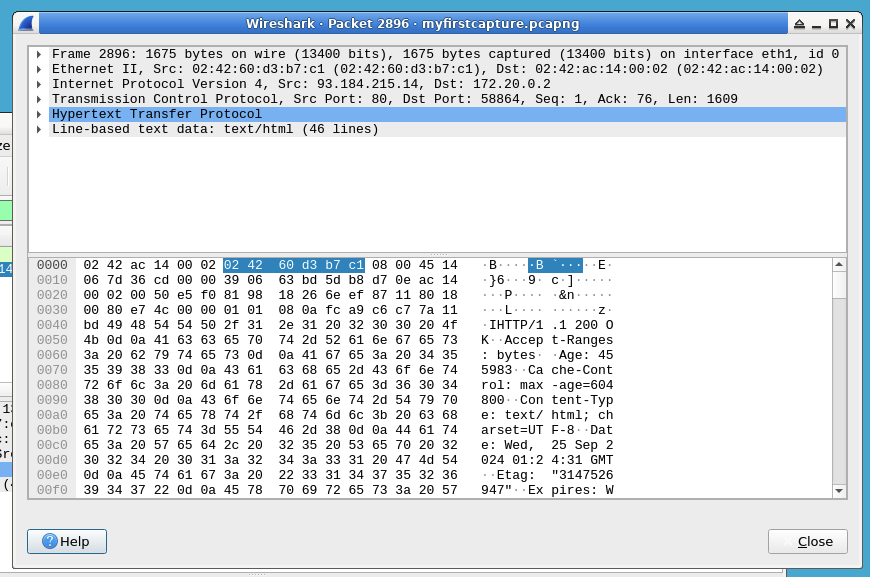
  3. Analyzing packet data
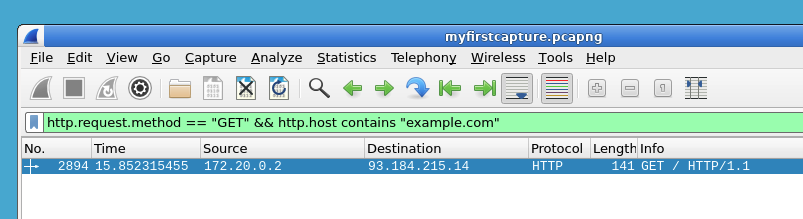
  4. Filtering network captures
  5. Identifying common protocols

Let's dive into the fascinating world of network analysis!


Skills Graph

%%%%{init: {'theme':'neutral'}}%%%% flowchart RL linux(("`Linux`")) -.-> linux/BasicFileOperationsGroup(["`Basic File Operations`"]) linux(("`Linux`")) -.-> linux/PackagesandSoftwaresGroup(["`Packages and Softwares`"]) linux(("`Linux`")) -.-> linux/UserandGroupManagementGroup(["`User and Group Management`"]) linux(("`Linux`")) -.-> linux/TextProcessingGroup(["`Text Processing`"]) linux(("`Linux`")) -.-> linux/FileandDirectoryManagementGroup(["`File and Directory Management`"]) cysec(("`Cyber Security`")) -.-> cysec/WiresharkGroup(["`Wireshark`"]) linux/BasicFileOperationsGroup -.-> linux/cat("`File Concatenating`") linux/PackagesandSoftwaresGroup -.-> linux/apt("`Package Handling`") linux/UserandGroupManagementGroup -.-> linux/groups("`Group Displaying`") linux/TextProcessingGroup -.-> linux/grep("`Pattern Searching`") linux/FileandDirectoryManagementGroup -.-> linux/pwd("`Directory Displaying`") linux/BasicFileOperationsGroup -.-> linux/ls("`Content Listing`") linux/UserandGroupManagementGroup -.-> linux/usermod("`User Modifying`") linux/UserandGroupManagementGroup -.-> linux/sudo("`Privilege Granting`") cysec/WiresharkGroup -.-> cysec/ws_installation("`Wireshark Installation and Setup`") cysec/WiresharkGroup -.-> cysec/ws_interface("`Wireshark Interface Overview`") cysec/WiresharkGroup -.-> cysec/ws_packet_capture("`Wireshark Packet Capture`") cysec/WiresharkGroup -.-> cysec/ws_display_filters("`Wireshark Display Filters`") cysec/WiresharkGroup -.-> cysec/ws_protocol_dissection("`Wireshark Protocol Dissection`") cysec/WiresharkGroup -.-> cysec/ws_follow_tcp_stream("`Wireshark Follow TCP Stream`") cysec/WiresharkGroup -.-> cysec/ws_export_packets("`Wireshark Exporting Packets`") cysec/WiresharkGroup -.-> cysec/ws_packet_analysis("`Wireshark Packet Analysis`") subgraph Lab Skills linux/cat -.-> lab-392055{{"`Network Analysis with Wireshark`"}} linux/apt -.-> lab-392055{{"`Network Analysis with Wireshark`"}} linux/groups -.-> lab-392055{{"`Network Analysis with Wireshark`"}} linux/grep -.-> lab-392055{{"`Network Analysis with Wireshark`"}} linux/pwd -.-> lab-392055{{"`Network Analysis with Wireshark`"}} linux/ls -.-> lab-392055{{"`Network Analysis with Wireshark`"}} linux/usermod -.-> lab-392055{{"`Network Analysis with Wireshark`"}} linux/sudo -.-> lab-392055{{"`Network Analysis with Wireshark`"}} cysec/ws_installation -.-> lab-392055{{"`Network Analysis with Wireshark`"}} cysec/ws_interface -.-> lab-392055{{"`Network Analysis with Wireshark`"}} cysec/ws_packet_capture -.-> lab-392055{{"`Network Analysis with Wireshark`"}} cysec/ws_display_filters -.-> lab-392055{{"`Network Analysis with Wireshark`"}} cysec/ws_protocol_dissection -.-> lab-392055{{"`Network Analysis with Wireshark`"}} cysec/ws_follow_tcp_stream -.-> lab-392055{{"`Network Analysis with Wireshark`"}} cysec/ws_export_packets -.-> lab-392055{{"`Network Analysis with Wireshark`"}} cysec/ws_packet_analysis -.-> lab-392055{{"`Network Analysis with Wireshark`"}} end

Installing Wireshark

In this step, we'll install Wireshark on our Ubuntu system. Wireshark is available in the default Ubuntu repositories, making the installation process straightforward.

  1. First, let's open the terminal. On your desktop, locate and open the Xfce Terminal.
alt text
  1. Let's update the package lists to ensure we have the latest information about available software. Run the following command:

    sudo apt update
  2. Now that our package lists are up-to-date, let's install Wireshark. Enter the following command:

    sudo apt install wireshark -y
  3. During the installation, you'll be asked if you want to allow non-superusers to capture packets. Select "Yes" using the arrow keys and press Enter. This will allow you to use Wireshark without needing to run it as root, which is safer.

alt text
  1. After the installation completes, verify that Wireshark was installed correctly by checking its version:

    wireshark --version

    You should see output displaying the Wireshark version number.

  2. To ensure that you have the necessary permissions to capture packets, add your user to the wireshark group:

    First, let's check if the wireshark group exists:

    getent group wireshark

    If the wireshark group does not exist, create the group with the command below:

    sudo groupadd wireshark

    By default, Wireshark runs with non-root privileges, which may limit its ability to capture packets from certain interfaces or protocols. To give Wireshark the necessary permissions with Dumpcap, a tool that is installed along with Wireshark, use the following commands:

    sudo chgrp wireshark /usr/bin/dumpcap
    sudo chmod 4755 /usr/bin/dumpcap
    sudo gpasswd -a $USER wireshark

Congratulations! You've just installed one of the most powerful tools in a network analyst's toolkit.

Capturing Network Traffic

Now that we have Wireshark installed, let's capture some network traffic. This is like setting up a net to catch all the data packets flowing through our network interface.

  1. Open Wireshark by typing wireshark in the terminal and pressing Enter.

  2. When Wireshark opens, you'll see a list of network interfaces. Look for an interface that says "eth0" or "eth1" - these are typically the main network interfaces.

alt text
  1. Double-click on the interface to start capturing packets. You'll see a stream of packets start to appear in the main window.
alt text
  1. Let's generate some traffic to capture. Open a new terminal window and enter the following command:

    curl http://example.com

    This command will fetch the webpage at example.com, generating some HTTP traffic.

  2. After a few seconds of capturing, click the red square "Stop" button at the top of the Wireshark window to stop the capture.

  3. You've just captured your first batch of network traffic! Each line in the capture represents a packet – a small unit of data sent across the network.

  4. To save this capture for later analysis, go to File > Save and save the file as myfirstcapture.pcapng in your home directory (/home/labex).

alt text

This process of capturing network traffic is fundamental to network analysis. In the next steps, we'll learn how to make sense of this data.

Analyzing Packet Data

Now that we've captured some network traffic, let's dive into the data and see what we can learn.

  1. Open your saved capture file in Wireshark by going to File > Open and selecting myfirstcapture.pcapng from your home directory. Or, double-click on the file to open it.

  2. In the top pane, you'll see a list of all the packets captured. Each line represents a single packet and includes information like the source and destination IP addresses, the protocol used, and a brief info field.

  3. Click on a packet to select it. In the middle pane, you'll see the packet details broken down into different protocol layers. This is like peeling an onion – each layer reveals more information about the packet.

  4. Let's look for HTTP traffic (web browsing). In the filter bar at the top of the window, type http and press Enter. This will show only HTTP packets.

alt text
  1. Find a packet with "GET" in the info field. This represents a request for a web page. Click on it to examine the details.
alt text
  1. In the packet details pane (middle), expand the "Hypertext Transfer Protocol" section. Here you can see details about the HTTP request, including the specific page requested.

  2. Now, let's look for the server's response. Find a packet with "HTTP/1.1 200 OK" in the info field. This represents a successful response from the web server.

alt text
  1. Examine this packet's details. You might be able to see the content of the web page in the "Line-based text data" section.

This analysis process is crucial for understanding network behavior. It's like reading a conversation log – you can see who's talking to whom, what they're saying, and how they're saying it.

Using Filters

Wireshark's real power comes from its ability to filter and analyze large amounts of network data quickly. In this step, we'll learn how to use filters to focus on specific types of traffic.

  1. With your capture file open in Wireshark, let's start by using some simple display filters:

    • To show only TCP traffic, type tcp in the filter bar and press Enter.
    • To show traffic to or from a specific IP address, type ip.addr == 93.184.215.14 (this is the IP address of example.com, but you can replace it with any IP address you see in your capture).
    alt text
    • To show all HTTP GET requests, type http.request.method == "GET".
  2. Let's create a more complex filter. We'll look for all HTTP GET requests to example.com:

    • In the filter bar, enter: http.request.method == "GET" && http.host contains "example.com"
    alt text
    • This filter shows all GET requests to any domain containing "example.com".
  3. Wireshark also allows you to save filters for later use. Let's save our HTTP GET filter:

    • Click on the plus sign ("+") next to the filter bar.
    • Name the filter "HTTP GETs" and click Save.
    • You can now quickly apply this filter anytime by selecting it from the Saved Filters list.
  4. Finally, let's export some of our findings. Go to Statistics > HTTP > Requests, then click on "Save as" to export the list of HTTP requests to a file.

    • Choose /home/labex and save the file as http_requests.txt.
    alt text

Using filters in this way allows you to quickly sift through large amounts of network data and focus on what's important. It's like having a super-powered magnifying glass that can instantly show you specific types of network traffic.

Summary

In this lab, you've taken your first steps into the world of network analysis with Wireshark. You've learned how to:

  1. Install and set up Wireshark on a Linux system
  2. Capture network traffic and save it for analysis
  3. Examine packet data to understand network conversations
  4. Use filters to focus on specific types of traffic

These skills form the foundation of network analysis and are crucial for anyone interested in cybersecurity or network administration. As you continue your journey, you'll find that Wireshark is an invaluable tool for understanding network behavior, troubleshooting issues, and even detecting security threats. Keep practicing and exploring – there's always more to learn in the fascinating world of network analysis!

To deepen your understanding of Wireshark and network analysis, check out the "Quick Start with Wireshark" course on LabEx. This course covers advanced topics and includes hands-on exercises to help you master this powerful tool: https://labex.io/courses/quick-start-with-wireshark.

Other Cyber Security Tutorials you may like