Introduction
In this lab, you will learn how to position titles on plots created with Matplotlib. Plot titles help viewers understand what information a visualization conveys. Matplotlib offers several options for positioning these titles - centered (the default), left-aligned, right-aligned, or with custom vertical positioning.
By the end of this lab, you will be able to:
- Create a basic plot with a centered title
- Position titles to the left or right of a plot
- Create a plot with the title at a custom position
- Use different methods to adjust title positioning
Basic Plotting with Default Title Position
In this step, you will create a simple line plot and add a centered title, which is the default position in Matplotlib.
Creating a Jupyter Notebook
After the VM startup is complete, click the top left corner to switch to the Notebook tab to access Jupyter Notebook.

You may need to wait a few seconds for Jupyter Notebook to finish loading. Due to limitations in Jupyter Notebook, the validation of operations cannot be automated.
If you encounter any issues during the lab, feel free to ask Labby for assistance. Please provide feedback after the session so we can promptly address any problems.
Importing Matplotlib
Now, let's start by importing the Matplotlib library. In the first cell of your notebook, type the following code and run it by pressing Shift+Enter:
import matplotlib.pyplot as plt
This imports the pyplot module from Matplotlib and assigns it the alias plt, which is a common convention.
Creating a Simple Plot
Next, let's create a basic line plot. In a new cell, enter the following code and run it:
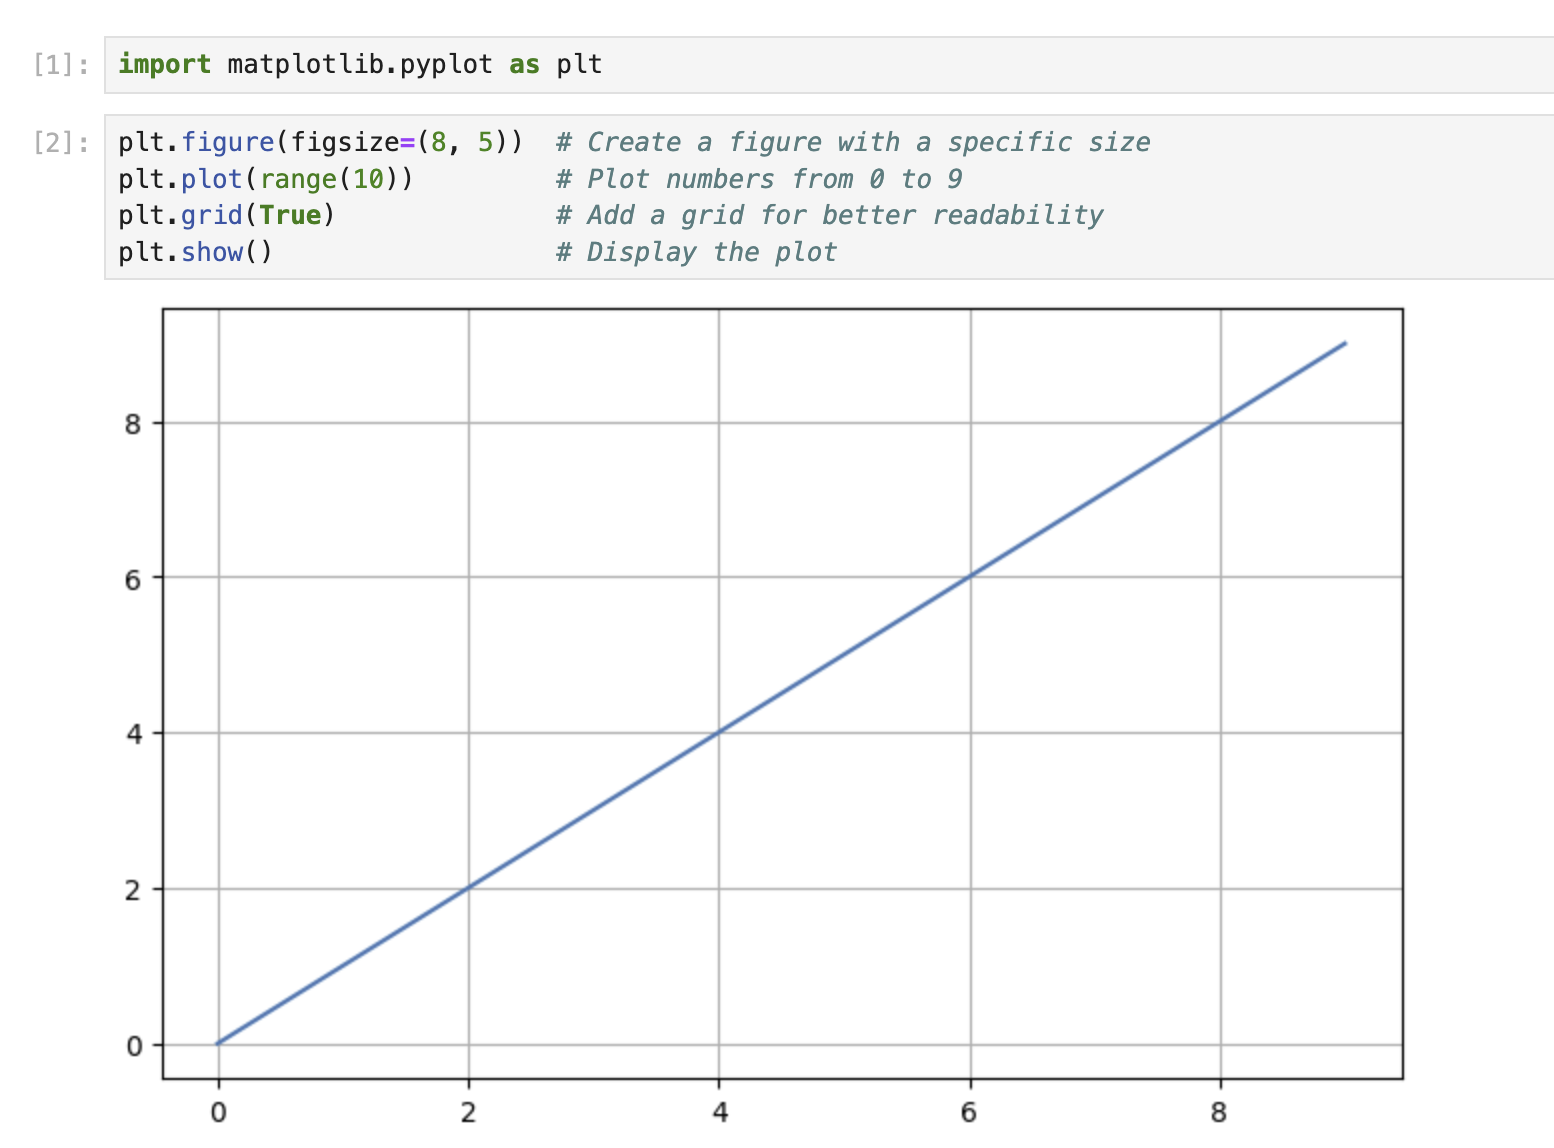
plt.figure(figsize=(8, 5))  ## Create a figure with a specific size
plt.plot(range(10))         ## Plot numbers from 0 to 9
plt.grid(True)              ## Add a grid for better readability
plt.show()                  ## Display the plot
You should see a simple line plot with values from 0 to 9 displayed in the output.
Adding a Default (Centered) Title
Now, let's add a title to our plot. The default position for a title is centered along the top of the plot. In a new cell, enter the following code:
plt.figure(figsize=(8, 5))
plt.plot(range(10))
plt.grid(True)
plt.title('My First Matplotlib Plot')  ## Add a centered title
plt.show()
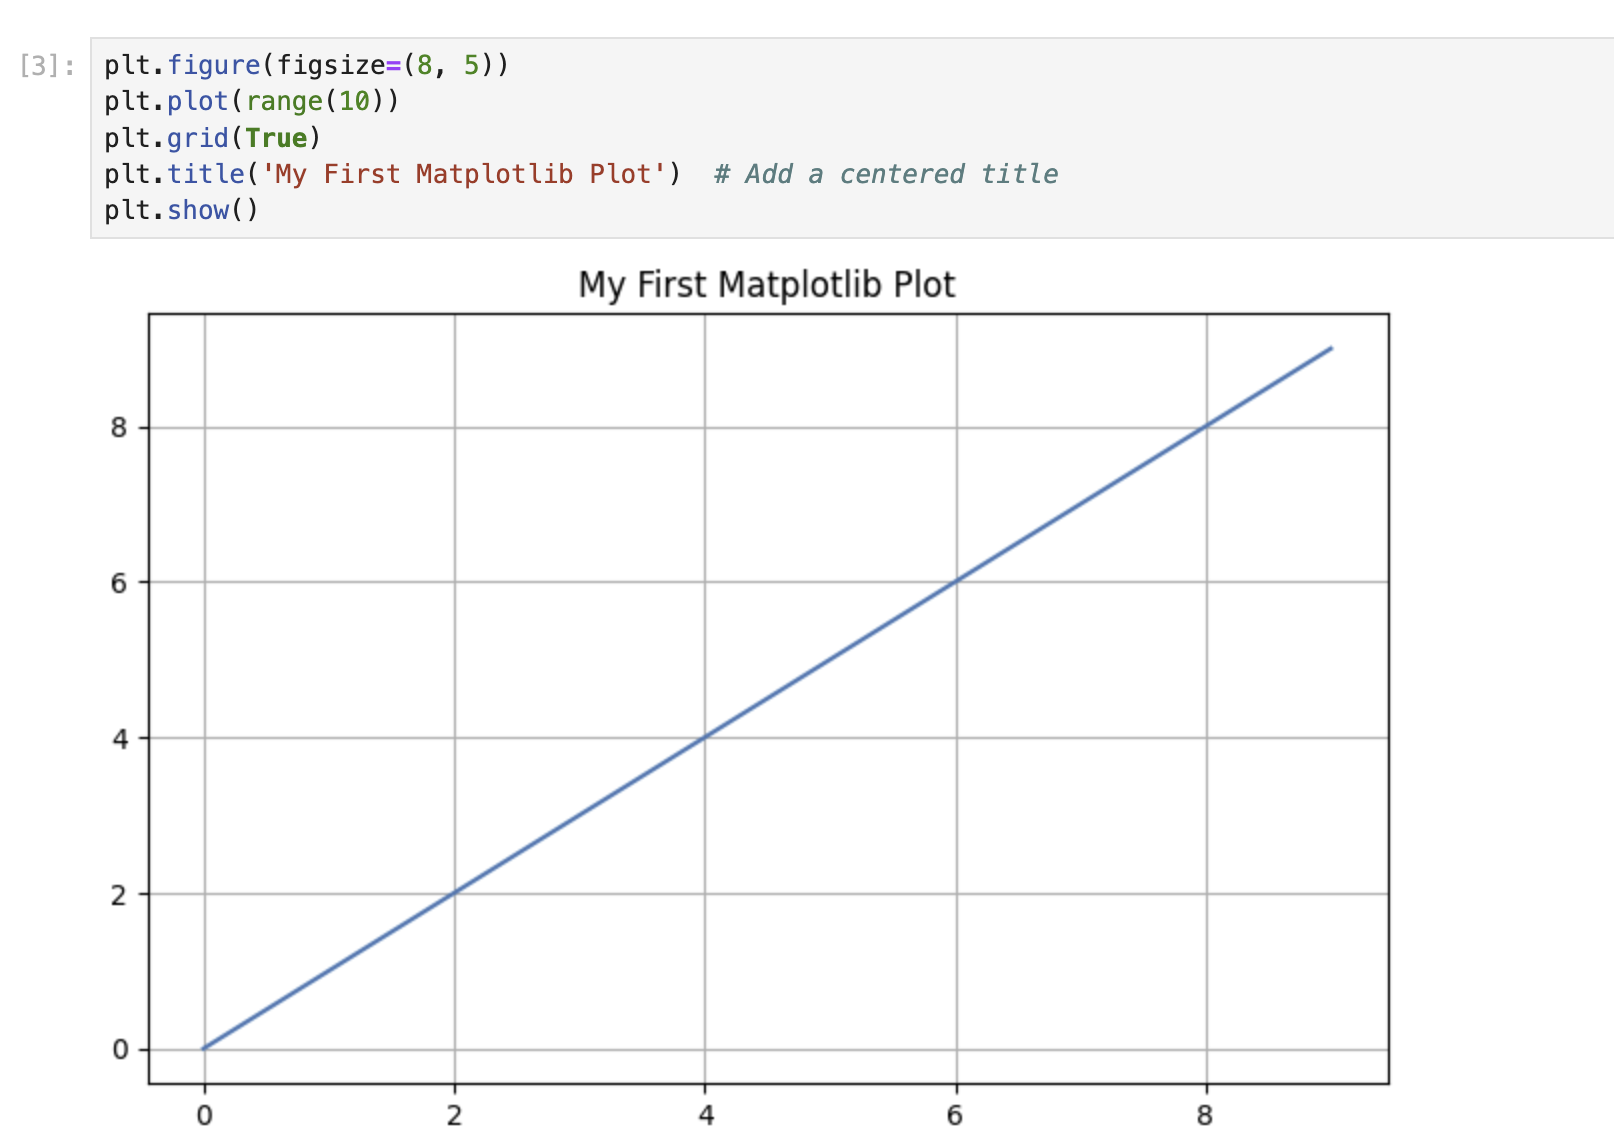
Run the cell, and you should see the plot with a centered title at the top.
The title() function without any additional parameters will place the title in the center, which is the default position.
Left and Right Title Positioning
Matplotlib allows you to position the title to the left or right side of the plot using the loc parameter. In this step, you will learn how to align titles to the left and right sides of your plots.
Creating a Plot with a Left-Aligned Title
Let's create a plot with the title positioned at the left side. In a new cell, enter the following code:
plt.figure(figsize=(8, 5))
plt.plot(range(10))
plt.grid(True)
plt.title('Left-Aligned Title', loc='left')  ## Position the title at the left
plt.show()
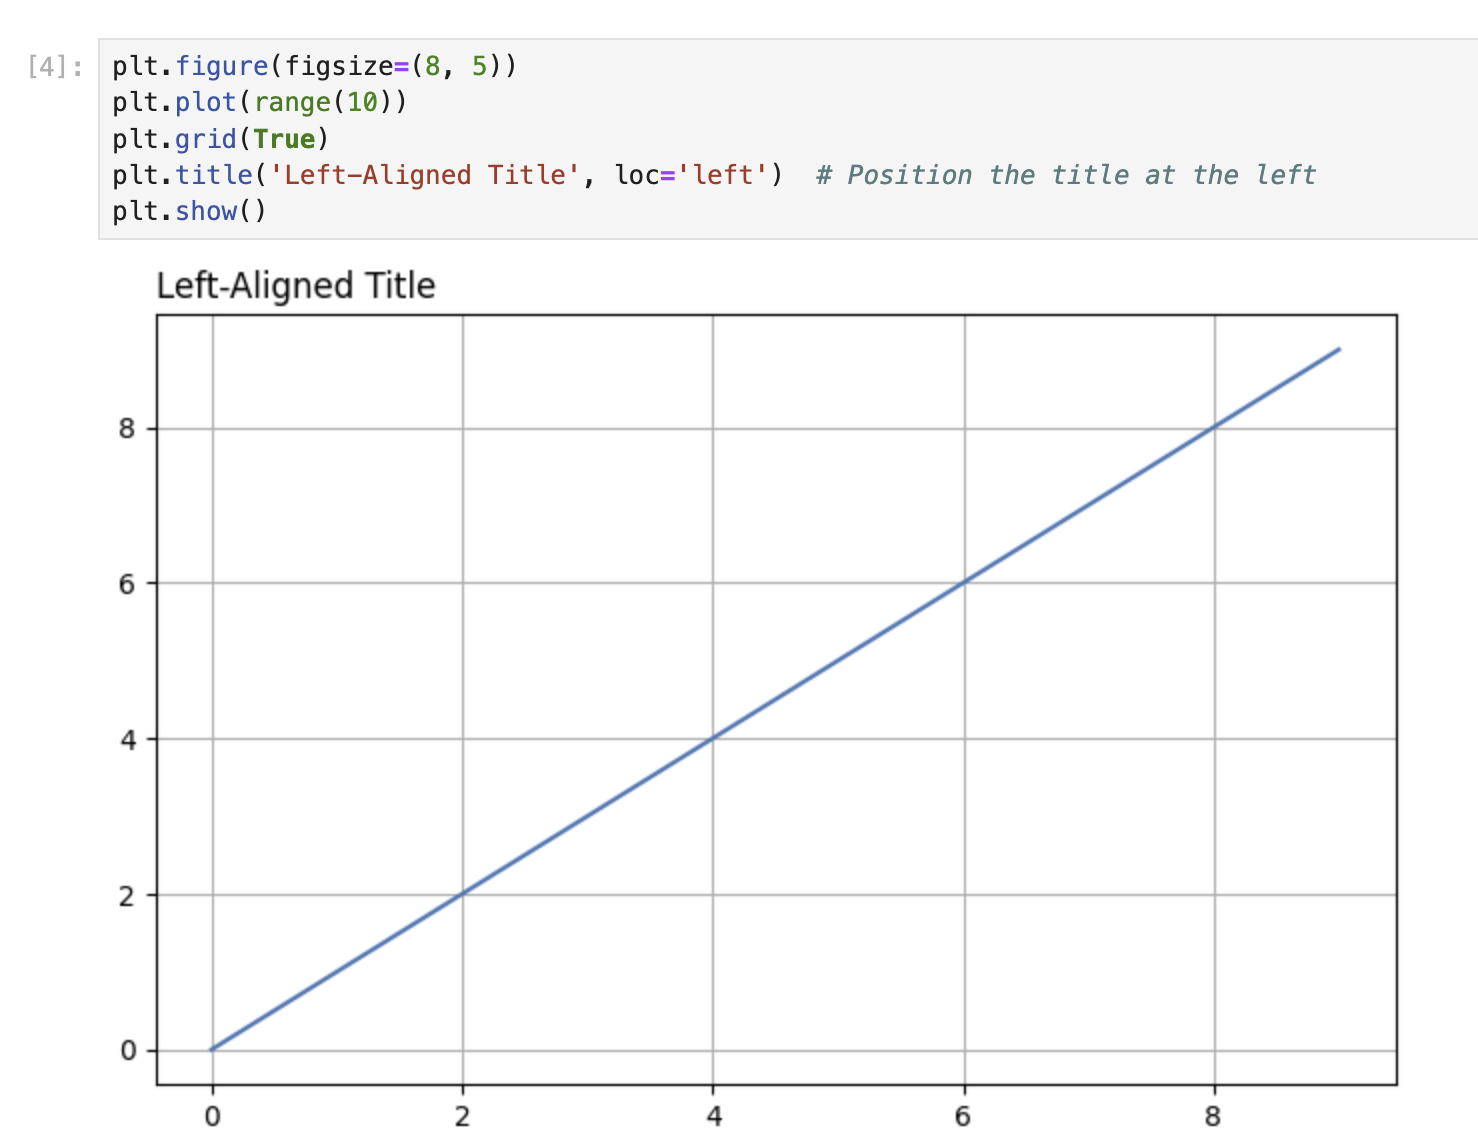
Run the cell. Notice how the title now appears aligned with the left edge of the plot, rather than centered.
The loc parameter in the title() function determines the horizontal position of the title. By setting loc='left', you're telling Matplotlib to position the title at the left side of the plot.
Creating a Plot with a Right-Aligned Title
Now, let's create another plot with the title positioned at the right side. In a new cell, enter the following code:
plt.figure(figsize=(8, 5))
plt.plot(range(10))
plt.grid(True)
plt.title('Right-Aligned Title', loc='right')  ## Position the title at the right
plt.show()
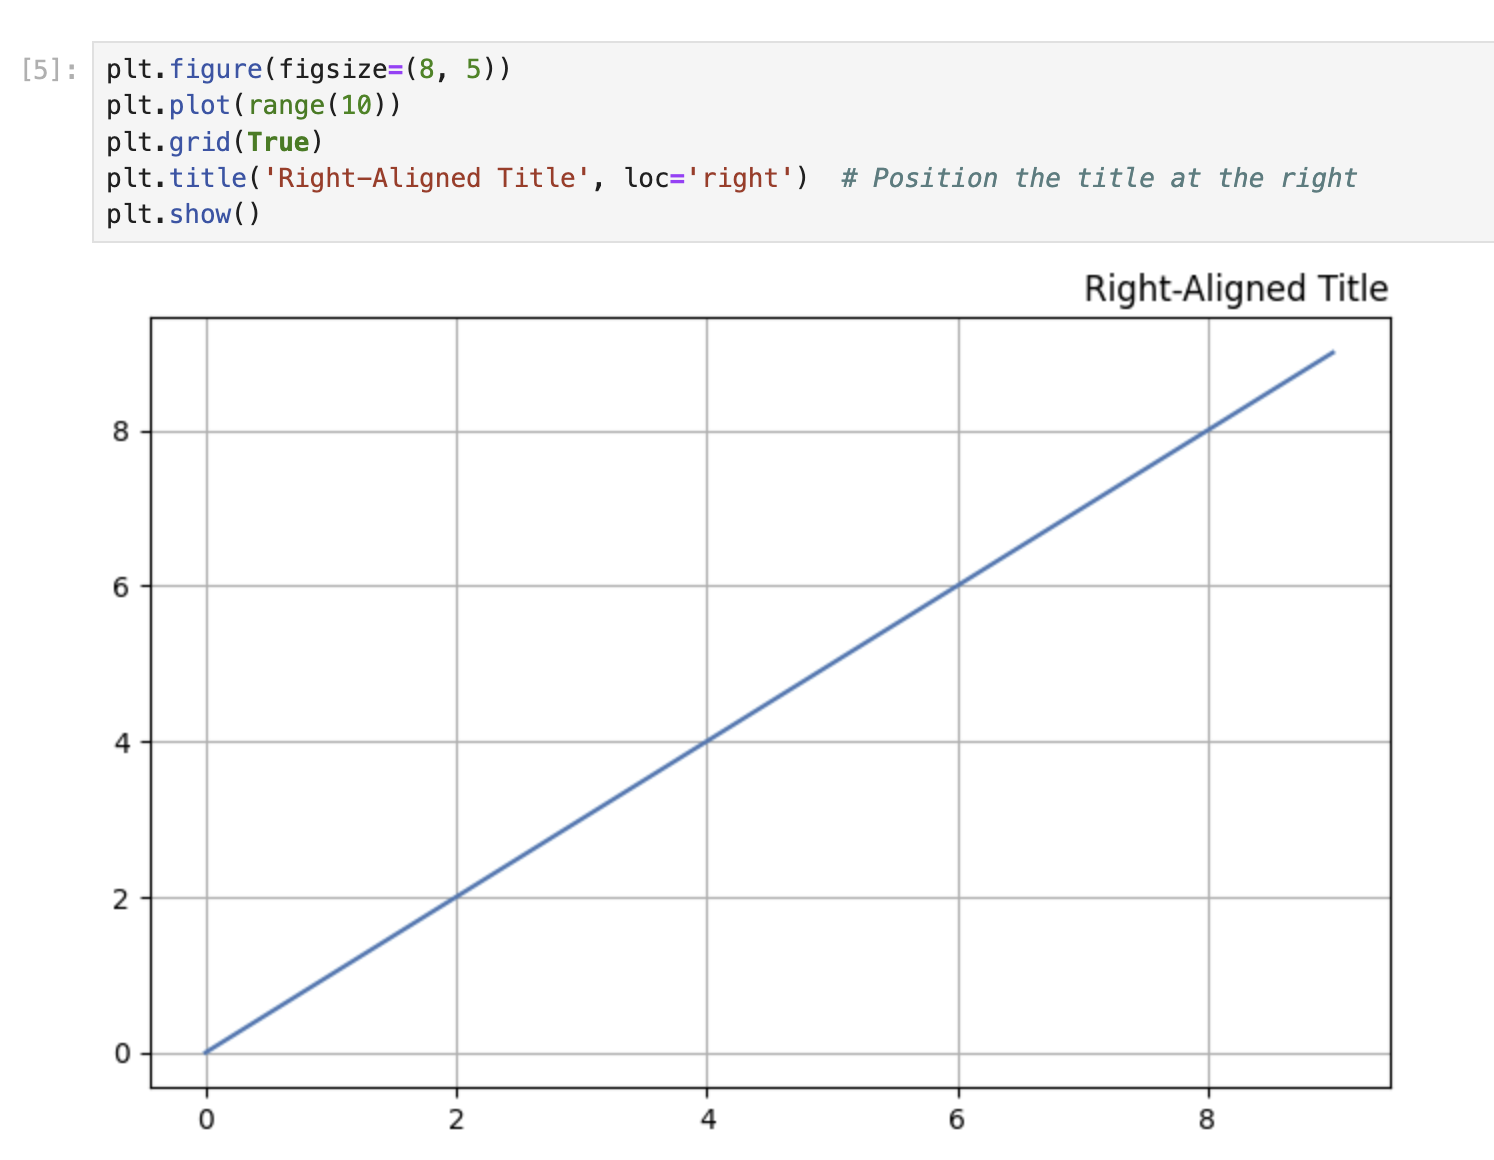
Run the cell. The title should now appear aligned with the right edge of the plot.
Comparing Different Title Positions
Let's create a sequence of three plots to compare the different title positions (center, left, and right). In a new cell, enter the following code:
## Create a figure with 3 subplots arranged horizontally
fig, axes = plt.subplots(1, 3, figsize=(15, 4))

## Plot 1: Center-aligned title (default)
axes[0].plot(range(10))
axes[0].grid(True)
axes[0].set_title('Center Title')

## Plot 2: Left-aligned title
axes[1].plot(range(10))
axes[1].grid(True)
axes[1].set_title('Left Title', loc='left')

## Plot 3: Right-aligned title
axes[2].plot(range(10))
axes[2].grid(True)
axes[2].set_title('Right Title', loc='right')

plt.tight_layout()  ## Adjust spacing between subplots
plt.show()
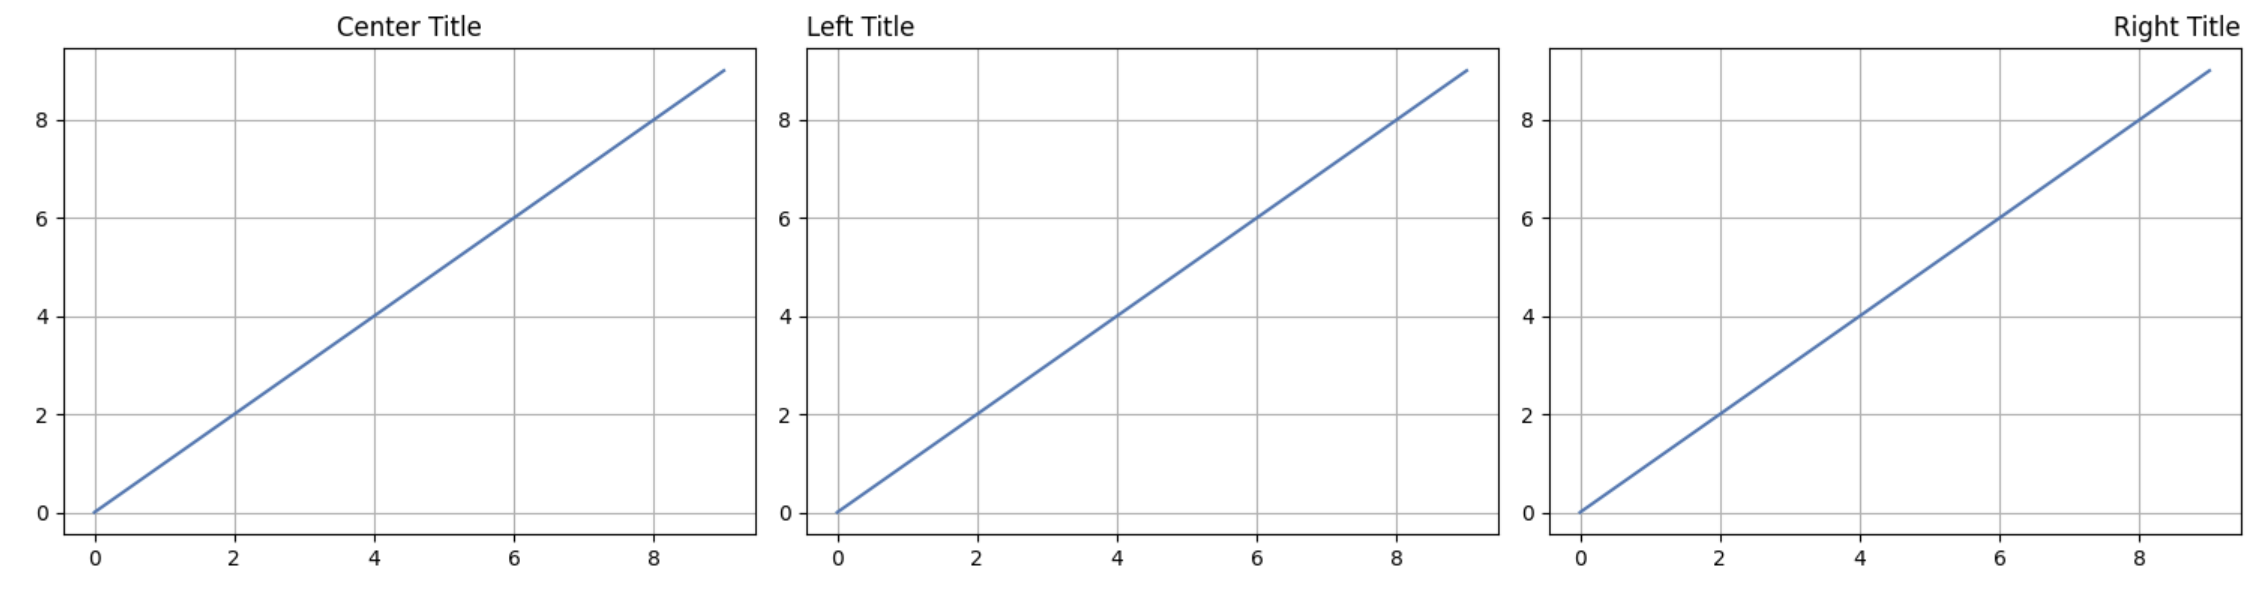
Run the cell to see all three title positions side by side. This visual comparison helps you understand how the loc parameter affects title positioning.
Note that when working with subplots, we use the set_title() method on the individual axis objects rather than the global plt.title() function.
Custom Title Vertical Positioning
Sometimes you might want to adjust the vertical position of your title. In this step, you'll learn how to manually control the vertical (y-axis) position of your plot titles.
Understanding Y-Position in Titles
The vertical position of a title can be adjusted using the y parameter in the title() function. The y parameter accepts values in normalized coordinates, where:
y=1.0(default) places the title at the top of the ploty>1.0places the title above the top of the ploty<1.0places the title below the top of the plot, moving it closer to the plot content
Creating a Plot with Custom Title Y-Position
Let's create a plot with the title positioned higher than the default. In a new cell, enter the following code:
plt.figure(figsize=(8, 5))
plt.plot(range(10))
plt.grid(True)
plt.title('Higher Title Position', y=1.1)  ## Position the title higher
plt.show()
Run the cell. Notice how the title now appears slightly higher above the plot compared to the default position.
Now, let's create a plot with the title positioned lower than the default:
plt.figure(figsize=(8, 5))
plt.plot(range(10))
plt.grid(True)
plt.title('Lower Title Position', y=0.9)  ## Position the title lower
plt.show()
Run the cell. The title should now appear closer to the plot content.
Comparing Different Y-Positions
Let's create multiple plots side by side to compare different vertical title positions:
## Create a figure with 3 subplots arranged horizontally
fig, axes = plt.subplots(1, 3, figsize=(15, 4))

## Plot 1: Default Y-position
axes[0].plot(range(10))
axes[0].grid(True)
axes[0].set_title('Default Position (y=1.0)')

## Plot 2: Higher Y-position
axes[1].plot(range(10))
axes[1].grid(True)
axes[1].set_title('Higher Position', y=1.15)

## Plot 3: Lower Y-position
axes[2].plot(range(10))
axes[2].grid(True)
axes[2].set_title('Lower Position', y=0.85)

plt.tight_layout()  ## Adjust spacing between subplots
plt.show()
Run the cell to see all three vertical positions side by side. This comparison helps you understand how the y parameter affects the vertical position of the title.
Combining Horizontal and Vertical Positioning
You can combine the loc parameter (for horizontal alignment) with the y parameter (for vertical position) to place your title exactly where you want it:
plt.figure(figsize=(8, 5))
plt.plot(range(10))
plt.grid(True)
plt.title('Custom Positioned Title', loc='right', y=1.1)  ## Right-aligned and higher
plt.show()
Run the cell. The title should now appear aligned with the right edge of the plot and positioned higher than the default.
Advanced Title Positioning with Subplots
In this step, you'll learn advanced techniques for title positioning when working with subplot layouts and axes objects. You'll also learn how to use the suptitle() function to add an overall title to a figure with multiple subplots.
Creating a Figure with Subplots and Individual Titles
Let's create a 2x2 grid of subplots, each with its own title positioned differently:
## Create a figure with a 2x2 grid of subplots
fig, axes = plt.subplots(2, 2, figsize=(10, 8))

## Flatten the 2D array of axes for easier iteration
axes = axes.flatten()

## Plot data and set titles with different positions for each subplot
for i, ax in enumerate(axes):
    ax.plot(range(10))
    ax.grid(True)

## Top-left subplot: Default centered title
axes[0].set_title('Default (Centered)')

## Top-right subplot: Left-aligned title
axes[1].set_title('Left-Aligned', loc='left')

## Bottom-left subplot: Right-aligned title
axes[2].set_title('Right-Aligned', loc='right')

## Bottom-right subplot: Custom positioned title
axes[3].set_title('Custom Position', y=0.85, loc='center')

## Add spacing between subplots
plt.tight_layout()
plt.show()
Run the cell. You should see four subplots, each with a title positioned differently.
Adding a Figure-Level Title with suptitle()
When working with multiple subplots, you might want to add an overall title for the entire figure. This can be done using the suptitle() function:
## Create a figure with a 2x2 grid of subplots
fig, axes = plt.subplots(2, 2, figsize=(10, 8))

## Flatten the 2D array of axes for easier iteration
axes = axes.flatten()

## Plot data on each subplot
for i, ax in enumerate(axes):
    ax.plot(range(10))
    ax.grid(True)
    ax.set_title(f'Subplot {i+1}')

## Add an overall title to the figure
fig.suptitle('Multiple Subplots with an Overall Title', fontsize=16)

## Add spacing between subplots
plt.tight_layout()
## Add top spacing for the suptitle
plt.subplots_adjust(top=0.9)
plt.show()
Run the cell. You should see four subplots, each with its own title, and an overall title for the figure at the top.
Combining Axes Titles and Figure Titles
You can combine individual subplot titles with an overall figure title:
## Create a figure with a 2x2 grid of subplots
fig, axes = plt.subplots(2, 2, figsize=(10, 8))

## Plot data on each subplot with different title positions
axes[0, 0].plot(range(10))
axes[0, 0].grid(True)
axes[0, 0].set_title('Centered Title', loc='center')

axes[0, 1].plot(range(10))
axes[0, 1].grid(True)
axes[0, 1].set_title('Left-Aligned Title', loc='left')

axes[1, 0].plot(range(10))
axes[1, 0].grid(True)
axes[1, 0].set_title('Right-Aligned Title', loc='right')

axes[1, 1].plot(range(10))
axes[1, 1].grid(True)
axes[1, 1].set_title('Lower Title', y=0.85)

## Add an overall title to the figure
fig.suptitle('Advanced Title Positioning Demo', fontsize=16)

## Add spacing between subplots
plt.tight_layout()
## Add top spacing for the suptitle
plt.subplots_adjust(top=0.9)
plt.show()
Run the cell. You should see a figure with four subplots, each with a differently positioned title, and an overall title at the top of the figure.
The suptitle() function is useful for adding a main title that describes the entire figure, while individual set_title() calls on axes objects add more specific titles to each subplot.
Global Title Positioning with RCParams
In this final step, you'll learn how to use Matplotlib's runtime configuration parameters (RCParams) to set global defaults for title positioning. This is useful when you want all plots in your notebook or script to use consistent title positioning without having to specify it for each plot individually.
Understanding RCParams in Matplotlib
Matplotlib's behavior can be customized using a dictionary-like variable called rcParams. This allows you to set global defaults for various properties, including title positioning.
Setting Global Title Positioning with rcParams
Let's set global defaults for title positioning and then create some plots that will automatically use these settings:
## View the current default values
print("Default title y position:", plt.rcParams['axes.titley'])
print("Default title padding:", plt.rcParams['axes.titlepad'])
Run the cell to see the default values. Now, let's modify these settings:
## Set new global defaults for title positioning
plt.rcParams['axes.titley'] = 1.05     ## Set title y position higher
plt.rcParams['axes.titlepad'] = 10     ## Set padding between title and plot
plt.rcParams['axes.titlelocation'] = 'left'  ## Set default alignment to left

## Create a plot that will use the new defaults
plt.figure(figsize=(8, 5))
plt.plot(range(10))
plt.grid(True)
plt.title('This Title Uses Global RCParams Settings')
plt.show()
Run the cell. Notice how the title is positioned according to the global settings we defined, even though we didn't specify any positioning parameters in the title() function.
Creating Multiple Plots with the Same Settings
Let's create several plots that all use our global settings:
## Create a figure with a 2x2 grid of subplots
fig, axes = plt.subplots(2, 2, figsize=(10, 8))

## Flatten the 2D array of axes for easier iteration
axes = axes.flatten()

## Plot data on each subplot with titles that use global settings
for i, ax in enumerate(axes):
    ax.plot(range(10))
    ax.grid(True)
    ax.set_title(f'Subplot {i+1} Using Global Settings')

plt.tight_layout()
plt.show()
Run the cell. All four subplot titles should be positioned according to the global settings we defined earlier.
Resetting RCParams to Defaults
If you want to reset the RCParams to their default values, you can use the rcdefaults() function:
## Reset to default settings
plt.rcdefaults()

## Create a plot with default settings
plt.figure(figsize=(8, 5))
plt.plot(range(10))
plt.grid(True)
plt.title('This Title Uses Default Settings Again')
plt.show()
Run the cell. The title should now be positioned using Matplotlib's default settings.
Temporary RCParams Changes
If you want to temporarily change RCParams for just a specific section of your code, you can use a context manager:
## Create a plot with default settings
plt.figure(figsize=(8, 5))
plt.plot(range(10))
plt.grid(True)
plt.title('Default Settings')
plt.show()

## Temporarily change RCParams for just this section
with plt.rc_context({'axes.titlelocation': 'right', 'axes.titley': 1.1}):
    plt.figure(figsize=(8, 5))
    plt.plot(range(10))
    plt.grid(True)
    plt.title('Temporary Settings Change')
    plt.show()

## Create another plot that will use default settings again
plt.figure(figsize=(8, 5))
plt.plot(range(10))
plt.grid(True)
plt.title('Back to Default Settings')
plt.show()
Run the cell. You should see three plots:
- The first with default title positioning
- The second with right-aligned and higher positioned title (due to the temporary settings)
- The third with default title positioning again (as the temporary settings only applied within the context manager)
This approach allows you to make temporary changes to the global settings without affecting the rest of your plots.
Summary
In this lab, you learned how to control the positioning of plot titles in Matplotlib:
Basic Title Positioning: You created simple plots with centered titles using the default positioning.
Horizontal Positioning: You learned how to align titles to the left or right of a plot using the
locparameter.Vertical Positioning: You discovered how to adjust the vertical position of titles using the
yparameter, placing them higher or lower relative to the plot.Advanced Techniques with Subplots: You explored how to position titles on individual subplots and how to add an overall figure title using
suptitle().Global Settings with RCParams: You learned how to set global defaults for title positioning using Matplotlib's runtime configuration parameters, allowing for consistent styling across multiple plots.
These skills will help you create more professional and visually appealing data visualizations, where the titles are positioned exactly where you want them to be. Title positioning is a small but important aspect of effective data visualization, helping to guide your audience's attention and improve the overall clarity of your plots.
For further exploration, consider experimenting with other title customization options like font properties, rotation, and colors to make your visualizations even more impactful.