Create Polar Graphs with Python Matplotlib

MatplotlibMatplotlibBeginner
Practice Now

This tutorial is from open-source community. Access the source code

Introduction

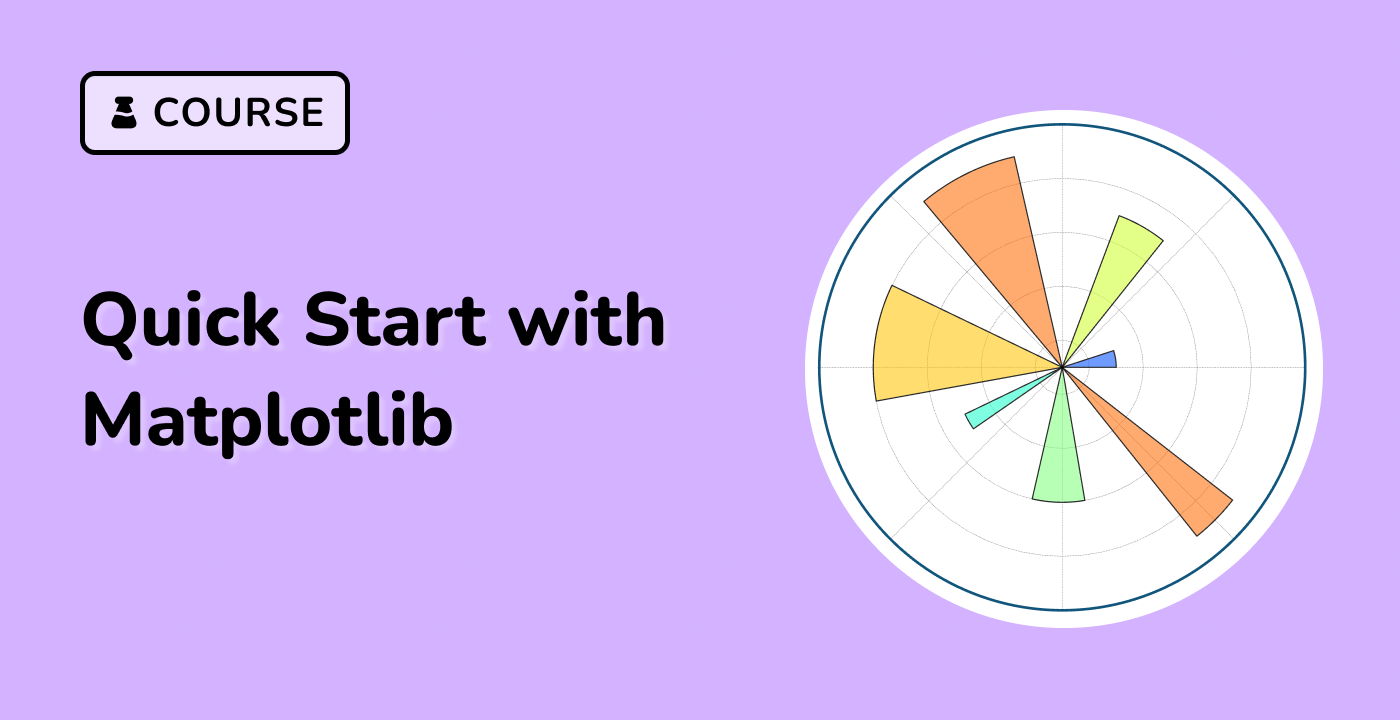
In this lab, you will learn how to create a polar graph and annotate it using Python Matplotlib library. A polar graph is a graph drawn using polar coordinates. It is useful for visualizing cyclic phenomena such as waves, seasons, and tides.

VM Tips

After the VM startup is done, click the top left corner to switch to the Notebook tab to access Jupyter Notebook for practice.

Sometimes, you may need to wait a few seconds for Jupyter Notebook to finish loading. The validation of operations cannot be automated because of limitations in Jupyter Notebook.

If you face issues during learning, feel free to ask Labby. Provide feedback after the session, and we will promptly resolve the problem for you.


Skills Graph

%%%%{init: {'theme':'neutral'}}%%%% flowchart RL python(("`Python`")) -.-> python/BasicConceptsGroup(["`Basic Concepts`"]) matplotlib(("`Matplotlib`")) -.-> matplotlib/BasicConceptsGroup(["`Basic Concepts`"]) matplotlib(("`Matplotlib`")) -.-> matplotlib/PlottingDataGroup(["`Plotting Data`"]) matplotlib(("`Matplotlib`")) -.-> matplotlib/PlotCustomizationGroup(["`Plot Customization`"]) python(("`Python`")) -.-> python/DataStructuresGroup(["`Data Structures`"]) python(("`Python`")) -.-> python/ModulesandPackagesGroup(["`Modules and Packages`"]) python(("`Python`")) -.-> python/PythonStandardLibraryGroup(["`Python Standard Library`"]) python(("`Python`")) -.-> python/DataScienceandMachineLearningGroup(["`Data Science and Machine Learning`"]) python(("`Python`")) -.-> python/FunctionsGroup(["`Functions`"]) python/BasicConceptsGroup -.-> python/comments("`Comments`") matplotlib/BasicConceptsGroup -.-> matplotlib/importing_matplotlib("`Importing Matplotlib`") matplotlib/BasicConceptsGroup -.-> matplotlib/figures_axes("`Understanding Figures and Axes`") matplotlib/PlottingDataGroup -.-> matplotlib/line_plots("`Line Plots`") matplotlib/PlotCustomizationGroup -.-> matplotlib/text_annotations("`Text Annotations`") python/BasicConceptsGroup -.-> python/variables_data_types("`Variables and Data Types`") python/DataStructuresGroup -.-> python/lists("`Lists`") python/DataStructuresGroup -.-> python/tuples("`Tuples`") python/ModulesandPackagesGroup -.-> python/importing_modules("`Importing Modules`") python/PythonStandardLibraryGroup -.-> python/data_collections("`Data Collections`") python/DataScienceandMachineLearningGroup -.-> python/numerical_computing("`Numerical Computing`") python/DataScienceandMachineLearningGroup -.-> python/data_visualization("`Data Visualization`") python/FunctionsGroup -.-> python/build_in_functions("`Build-in Functions`") subgraph Lab Skills python/comments -.-> lab-48550{{"`Create Polar Graphs with Python Matplotlib`"}} matplotlib/importing_matplotlib -.-> lab-48550{{"`Create Polar Graphs with Python Matplotlib`"}} matplotlib/figures_axes -.-> lab-48550{{"`Create Polar Graphs with Python Matplotlib`"}} matplotlib/line_plots -.-> lab-48550{{"`Create Polar Graphs with Python Matplotlib`"}} matplotlib/text_annotations -.-> lab-48550{{"`Create Polar Graphs with Python Matplotlib`"}} python/variables_data_types -.-> lab-48550{{"`Create Polar Graphs with Python Matplotlib`"}} python/lists -.-> lab-48550{{"`Create Polar Graphs with Python Matplotlib`"}} python/tuples -.-> lab-48550{{"`Create Polar Graphs with Python Matplotlib`"}} python/importing_modules -.-> lab-48550{{"`Create Polar Graphs with Python Matplotlib`"}} python/data_collections -.-> lab-48550{{"`Create Polar Graphs with Python Matplotlib`"}} python/numerical_computing -.-> lab-48550{{"`Create Polar Graphs with Python Matplotlib`"}} python/data_visualization -.-> lab-48550{{"`Create Polar Graphs with Python Matplotlib`"}} python/build_in_functions -.-> lab-48550{{"`Create Polar Graphs with Python Matplotlib`"}} end

Import Libraries

To get started, we first need to import the necessary libraries. In this case, we need numpy and matplotlib.

import matplotlib.pyplot as plt
import numpy as np

Create a Polar Graph

Next, we create a polar graph by defining the figure and specifying that it has a polar projection. We also define the radius and theta values to be used in plotting.

fig = plt.figure()
ax = fig.add_subplot(projection='polar')
r = np.arange(0, 1, 0.001)
theta = 2 * 2*np.pi * r
line, = ax.plot(theta, r, color='#ee8d18', lw=3)

Add Annotation

We can add an annotation to the polar graph by specifying the location of the annotation. In this case, we choose a specific point on the graph and annotate it.

ind = 800
thisr, thistheta = r[ind], theta[ind]
ax.plot([thistheta], [thisr], 'o')
ax.annotate('a polar annotation',
            xy=(thistheta, thisr),  ## theta, radius
            xytext=(0.05, 0.05),    ## fraction, fraction
            textcoords='figure fraction',
            arrowprops=dict(facecolor='black', shrink=0.05),
            horizontalalignment='left',
            verticalalignment='bottom',
            )

Display the Graph

We can now display the graph using plt.show().

plt.show()

Summary

In this lab, we learned how to create a polar graph and annotate it using Python Matplotlib library. We used numpy to define the radius and theta values and plt.annotate() to add an annotation to the graph. We also displayed the graph using plt.show().

Other Matplotlib Tutorials you may like