Kubernetes Dashboard Deployment and Management

KubernetesKubernetesIntermediate
Practice Now

Introduction

Kubernetes Dashboard is a web-based user interface for managing and monitoring Kubernetes clusters. It provides an easy way to deploy and manage applications, as well as view and analyze cluster resources. In this lab, we will walk through the steps to deploy and use Kubernetes Dashboard.

Prerequisites

Before starting this lab, you should have a Kubernetes cluster up and running. You should also have kubectl installed and configured to access the cluster.


Skills Graph

%%%%{init: {'theme':'neutral'}}%%%% flowchart RL kubernetes(("`Kubernetes`")) -.-> kubernetes/BasicCommandsGroup(["`Basic Commands`"]) kubernetes(("`Kubernetes`")) -.-> kubernetes/AdvancedCommandsGroup(["`Advanced Commands`"]) kubernetes(("`Kubernetes`")) -.-> kubernetes/BasicsGroup(["`Basics`"]) kubernetes/BasicCommandsGroup -.-> kubernetes/create("`Create`") kubernetes/BasicCommandsGroup -.-> kubernetes/get("`Get`") kubernetes/BasicCommandsGroup -.-> kubernetes/edit("`Edit`") kubernetes/AdvancedCommandsGroup -.-> kubernetes/apply("`Apply`") kubernetes/BasicsGroup -.-> kubernetes/dashboard("`Dashboard`") subgraph Lab Skills kubernetes/create -.-> lab-15042{{"`Kubernetes Dashboard Deployment and Management`"}} kubernetes/get -.-> lab-15042{{"`Kubernetes Dashboard Deployment and Management`"}} kubernetes/edit -.-> lab-15042{{"`Kubernetes Dashboard Deployment and Management`"}} kubernetes/apply -.-> lab-15042{{"`Kubernetes Dashboard Deployment and Management`"}} kubernetes/dashboard -.-> lab-15042{{"`Kubernetes Dashboard Deployment and Management`"}} end

Deploying Kubernetes Dashboard

In this step, we will deploy Kubernetes Dashboard to our cluster.

  1. Run the following command to deploy the Kubernetes Dashboard:

    kubectl apply -f https://raw.githubusercontent.com/kubernetes/dashboard/v2.3.1/aio/deploy/recommended.yaml

    This will create all of the necessary resources for the dashboard to run, including a deployment, a service, and a role-based access control (RBAC) configuration.

  2. Verify that the dashboard is running by running the following command:

    kubectl get pods -n kubernetes-dashboard

    This will show you the status of the Kubernetes Dashboard pod. Wait until the pod is in the Running state.

Creating a Service Account and Cluster Role Binding

In this step, we will create a service account and cluster role binding to allow us to access the Kubernetes Dashboard.

  1. Create a file named dashboard-admin.yaml with the following contents:

    apiVersion: v1
    kind: ServiceAccount
    metadata:
      name: admin-user
      namespace: kubernetes-dashboard
    ---
    apiVersion: rbac.authorization.k8s.io/v1
    kind: ClusterRoleBinding
    metadata:
      name: admin-user
    roleRef:
      apiGroup: rbac.authorization.k8s.io
      kind: ClusterRole
      name: cluster-admin
    subjects:
      - kind: ServiceAccount
        name: admin-user
        namespace: kubernetes-dashboard

    This file creates a service account named admin-user and a cluster role binding that grants it cluster-admin privileges.

  2. Apply the changes by running the following command:

    kubectl apply -f dashboard-admin.yaml

Accessing Kubernetes Dashboard

In this step, we will access the Kubernetes Dashboard using a web browser.

  1. Now we need to find the token we can use to log in. Execute the following command:

    kubectl -n kubernetes-dashboard create token admin-user

    This will output a token that you can use to log in to the Kubernetes Dashboard.

  2. Use the following command to change the service type of the kubernetes dashboard to NodePort in line 33.

    kubectl edit service -n kubernetes-dashboard kubernetes-dashboard

    Then use the following command to get the nodeport of the kubernetes dashboard.

    kubectl get service -n kubernetes-dashboard
  3. Use the following command to get the kubernetes node ip address.

    kubectl get node -o wide

    The data labeled as INTERNAL-IP is the IP address of the node.

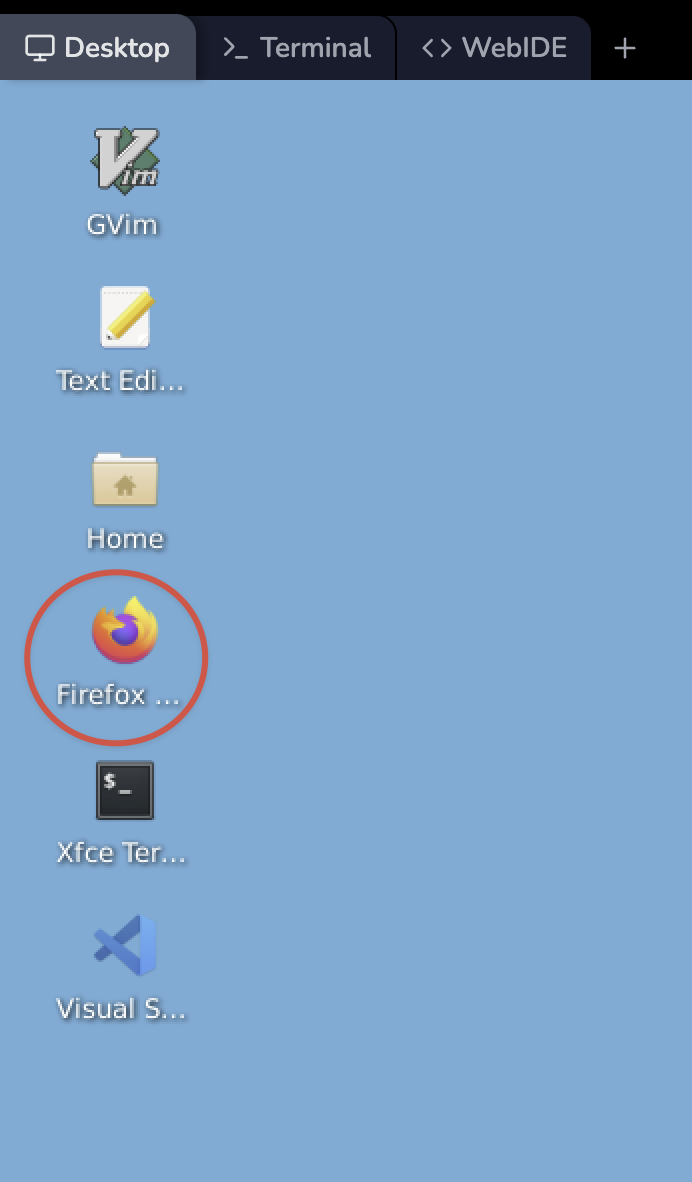
  4. Open a web browser and navigate to https://<node-ip>:<node-port>.

    Replace <node-ip> with the node IP address and replace <node-port> with the kubernetes dashboard node port.

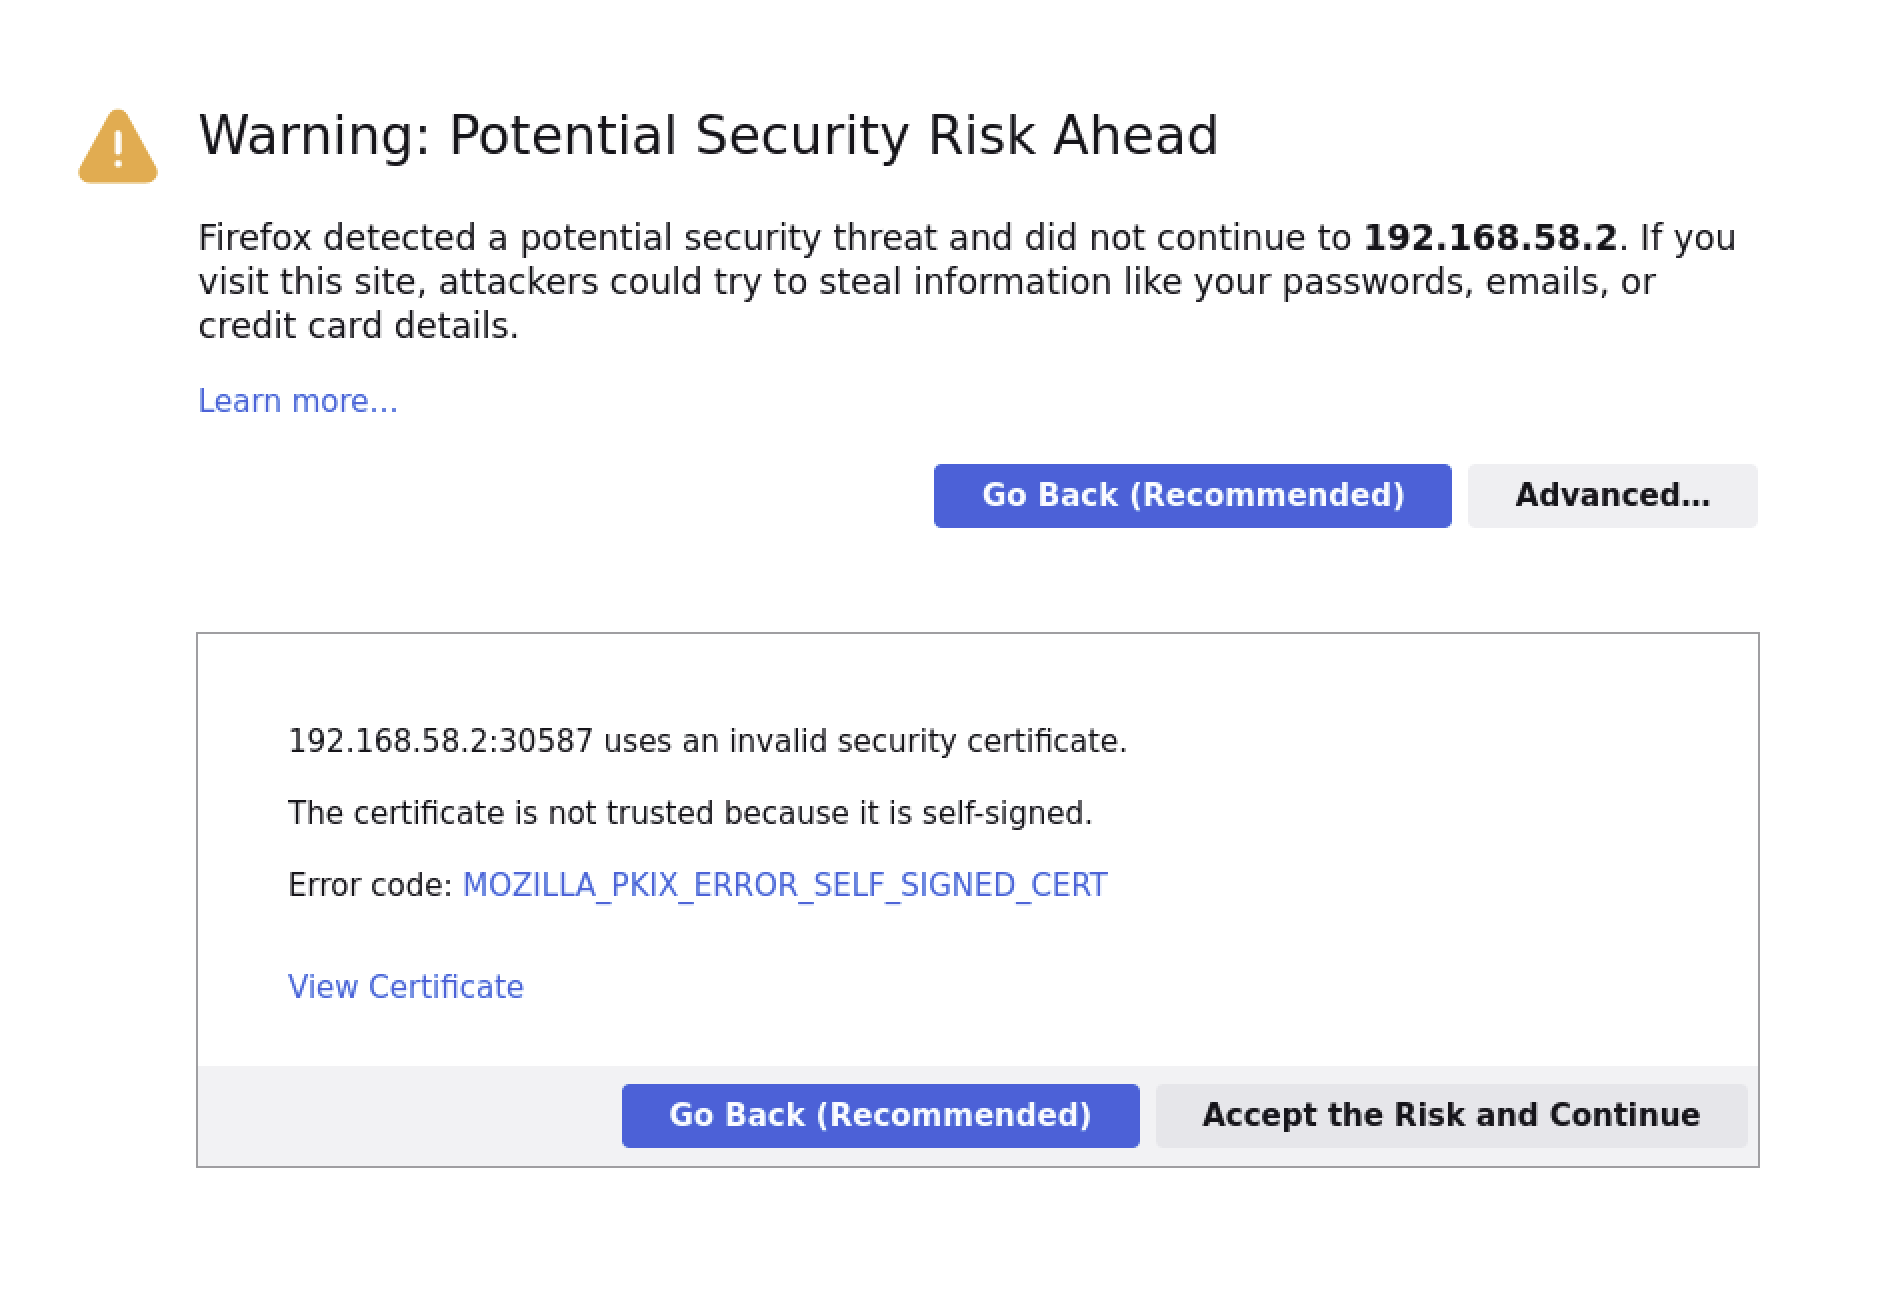
  5. Since there is no legal TLS certificate, we need to select Advanced and choose Accept the Risk and Continue after the warning message pops up in the browser.

lab-kubernetes-dashboard-3-1
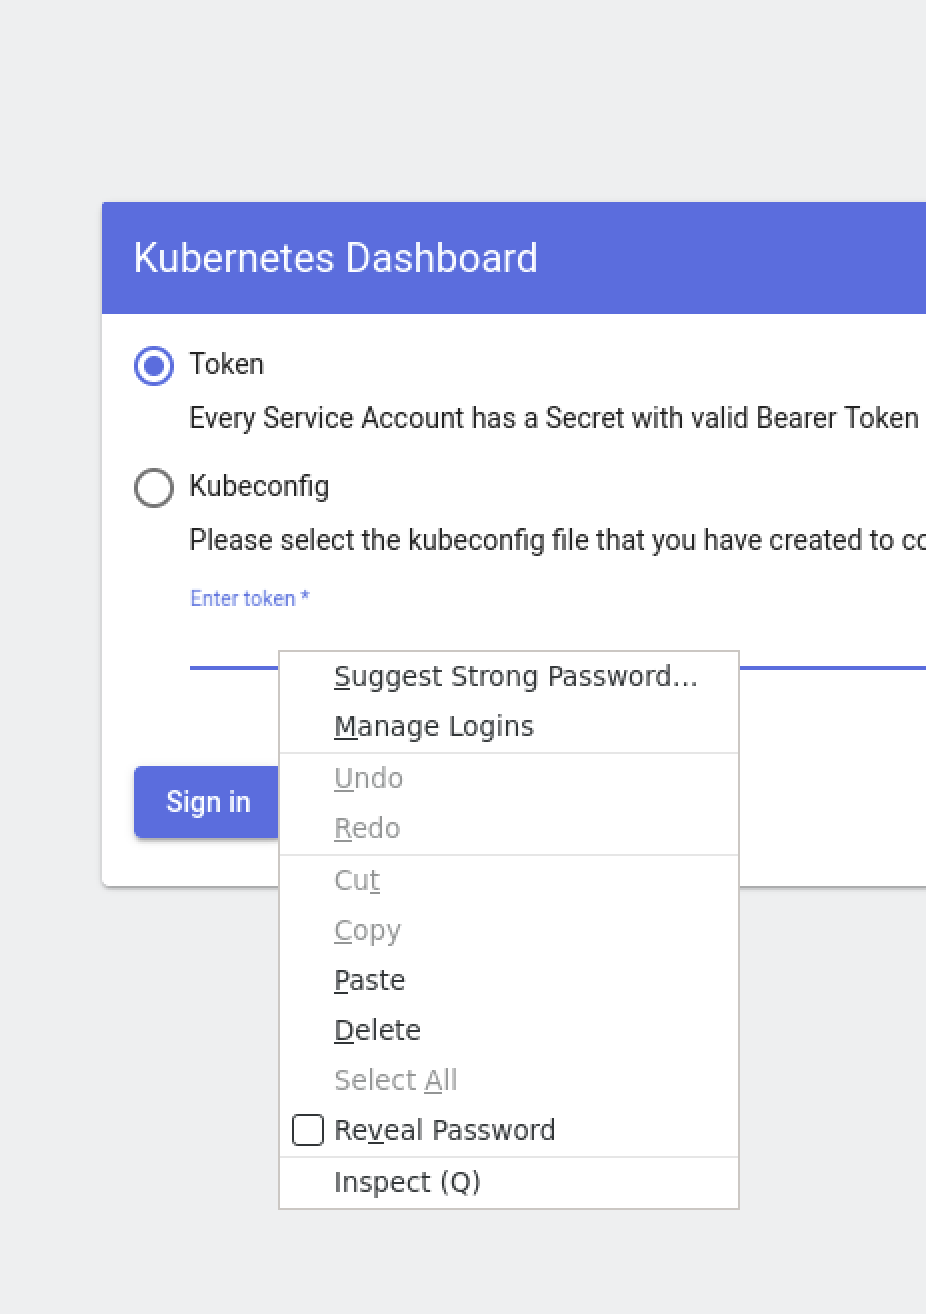
  1. Select the Token option, and enter the access token from step 1 when prompted.
lab-kubernetes-dashboard-3-2
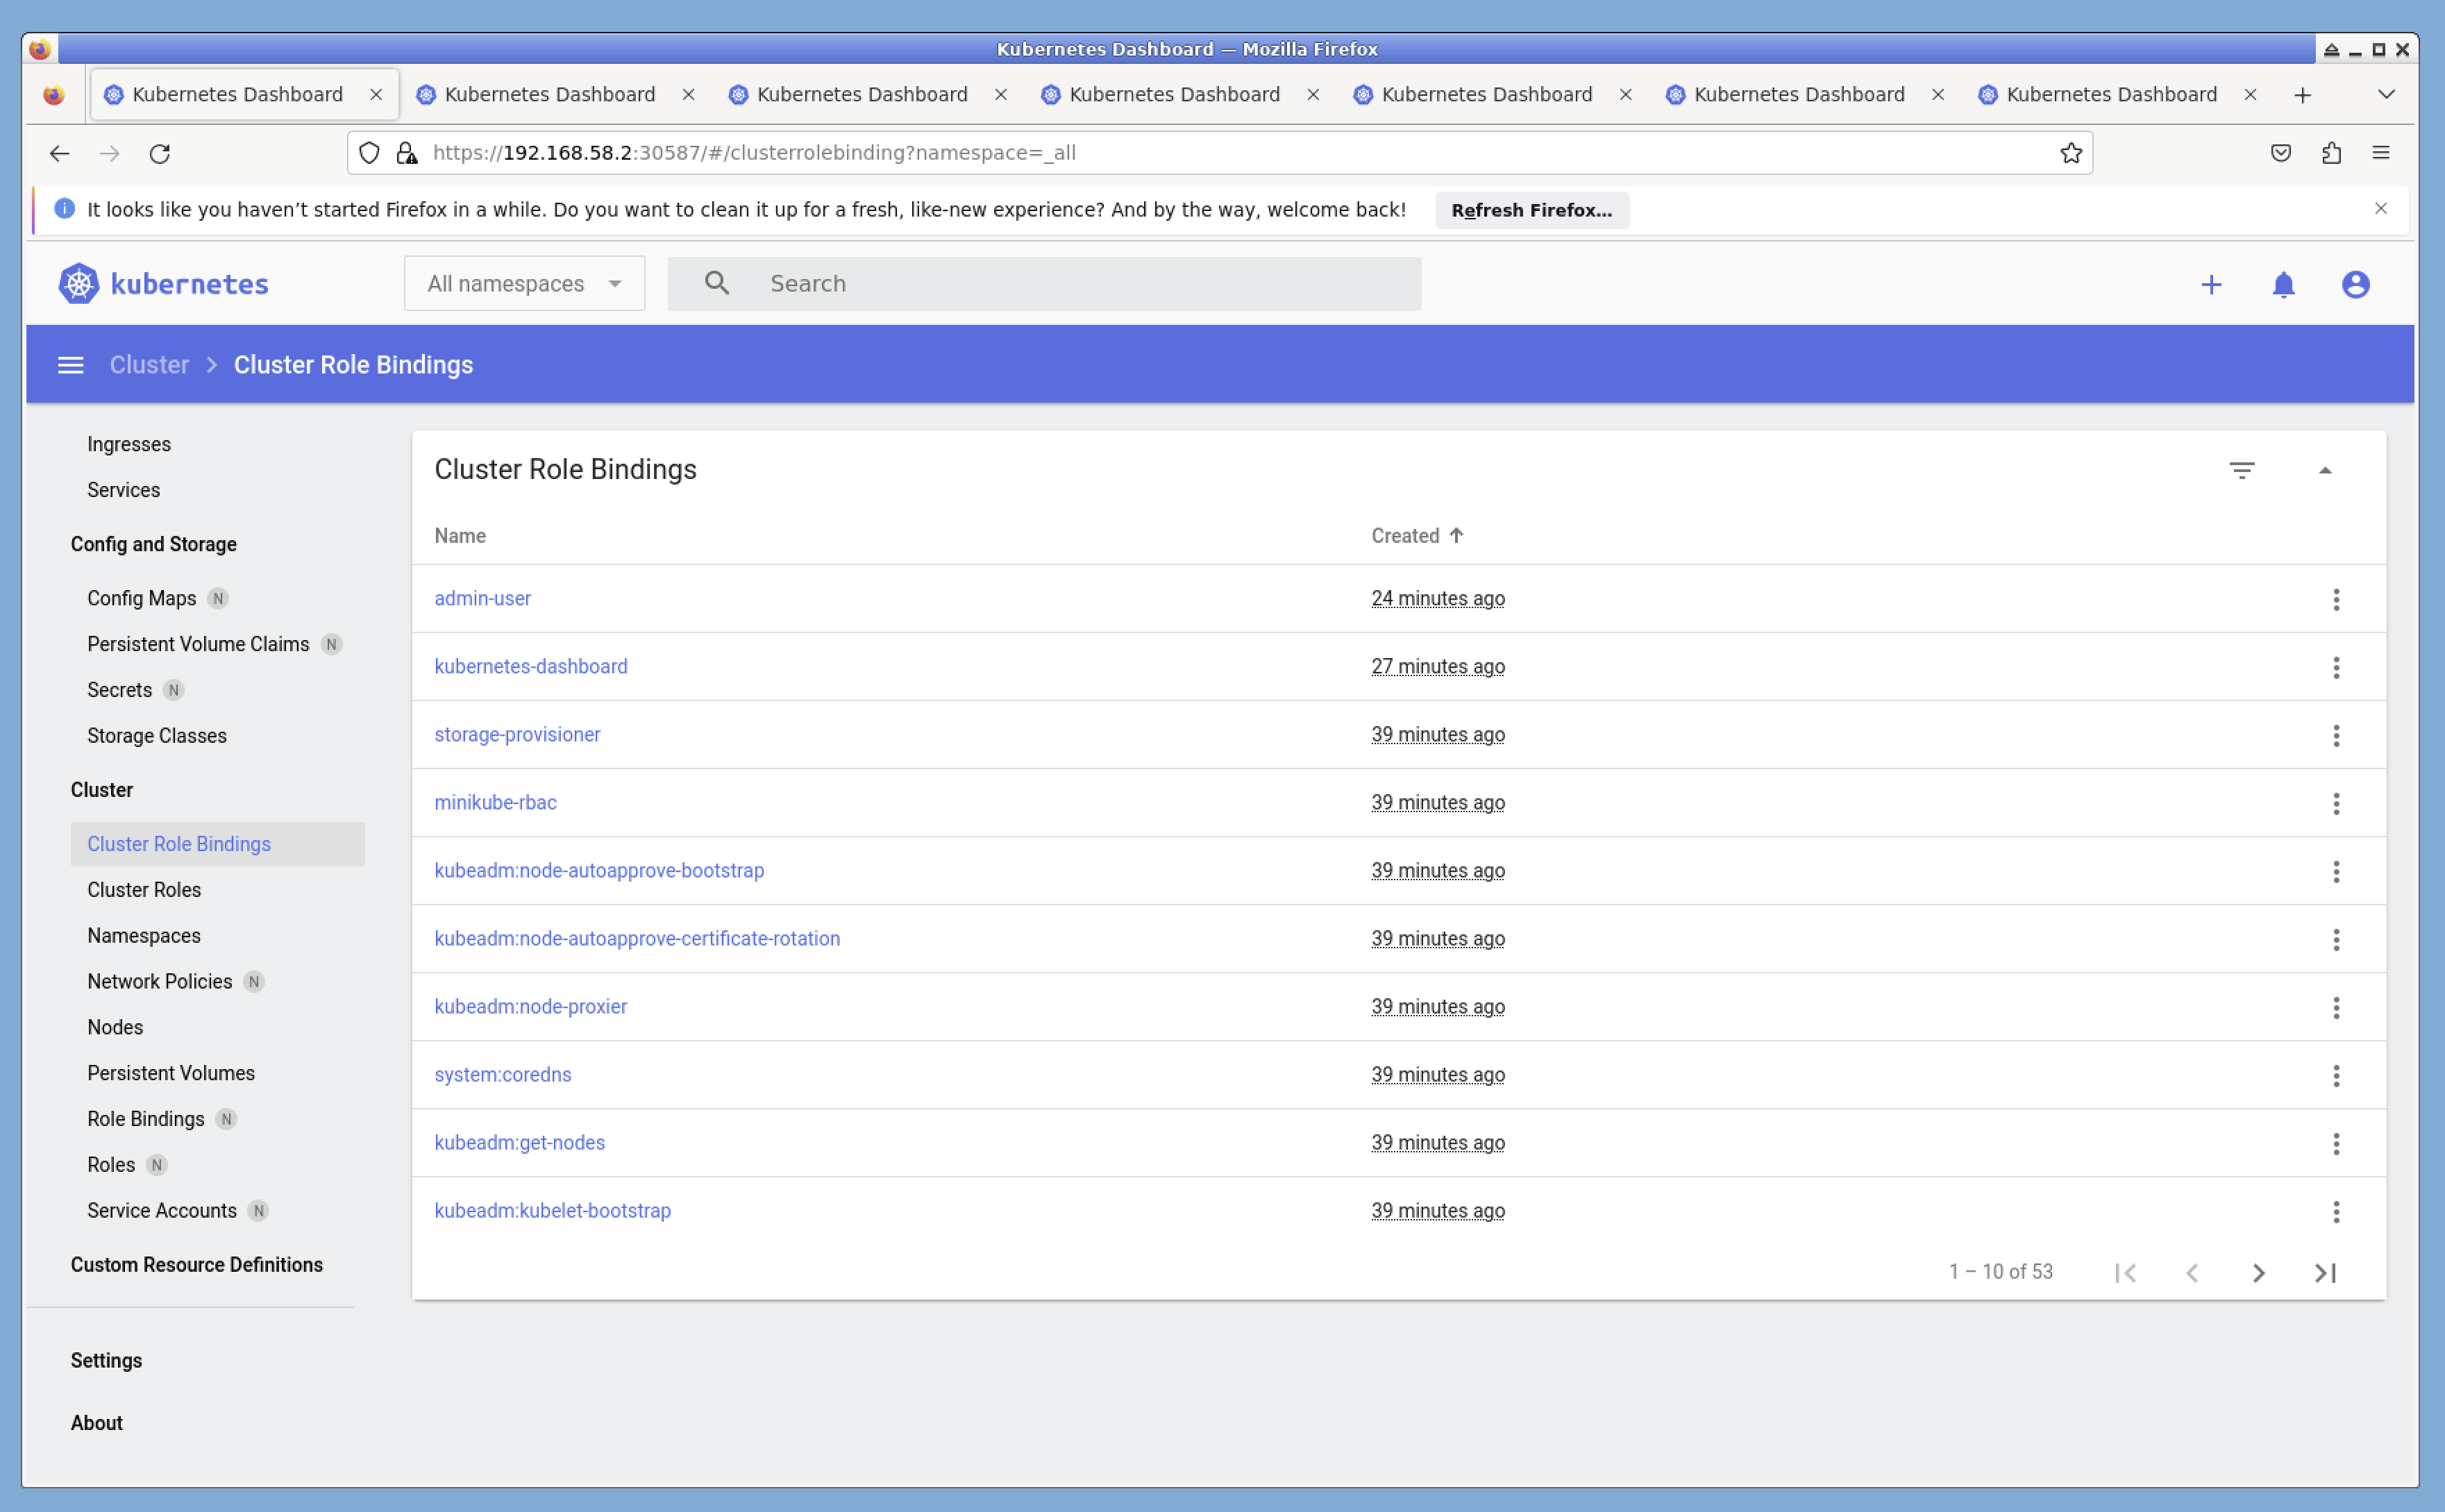
  1. You should now be logged in to the Kubernetes Dashboard, and can explore the various features and resources available.
lab-kubernetes-dashboard-3-3

Summary

In this lab, we learned how to deploy and use Kubernetes Dashboard to manage and monitor a Kubernetes cluster. We deployed the dashboard, created a service account and cluster role binding to allow us to access it, and accessed the dashboard using a web browser. With Kubernetes Dashboard, you can easily deploy and manage applications, monitor cluster resources, and perform other administrative tasks.

Other Kubernetes Tutorials you may like