Introduction
In this project, you will learn how to create a statistical chart of crop yields in a city over the past five years using ECharts. The project aims to demonstrate how practical problems can be analyzed through statistics on crop yields, which directly affect people's livelihood.
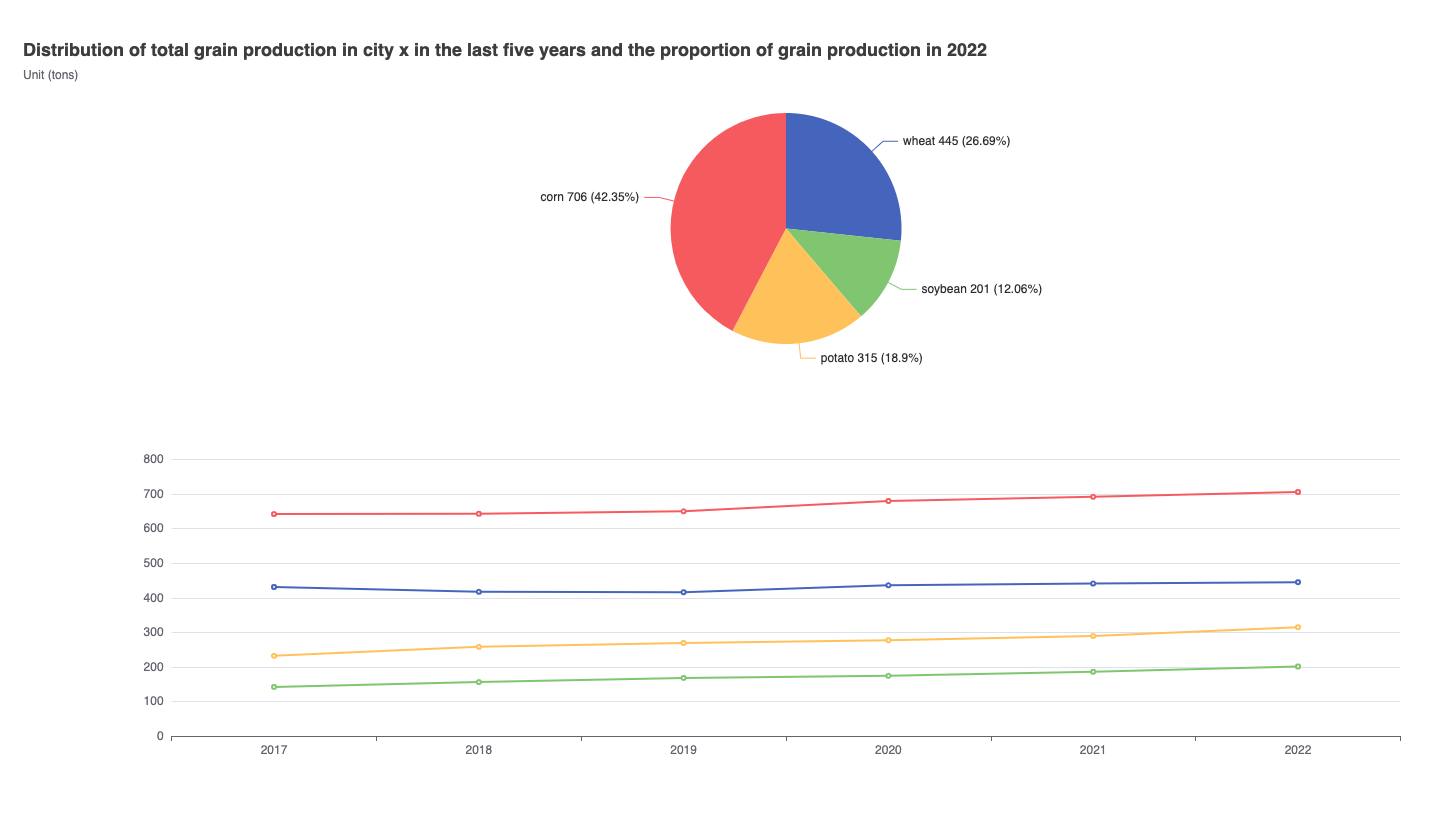
👀 Preview
🎯 Tasks
In this project, you will learn:
- How to set up the project environment and understand the provided files
- How to fetch the data from a JSON file and process it to update the ECharts visualization
- How to customize the appearance and layout of the line chart and pie chart
🏆 Achievements
After completing this project, you will be able to:
- Use the Axios library to fetch data from a JSON file
- Manipulate the ECharts option object to update the visualization
- Customize the charts by adjusting the title, layout, and other properties
Set Up the Project Structure
In this step, you will set up the project structure and prepare the necessary files and folders.
Open the project folder in your code editor. The directory structure is as follows:
├── data.json
├── index.html
└── js
    ├── axios.min.js
    └── echarts.min.js
Where:
index.htmlis the main page.js/echarts.min.jsis the ECharts file.js/axios.min.jsis the axios file.data.jsonis the grain production data in tons for the corresponding year.
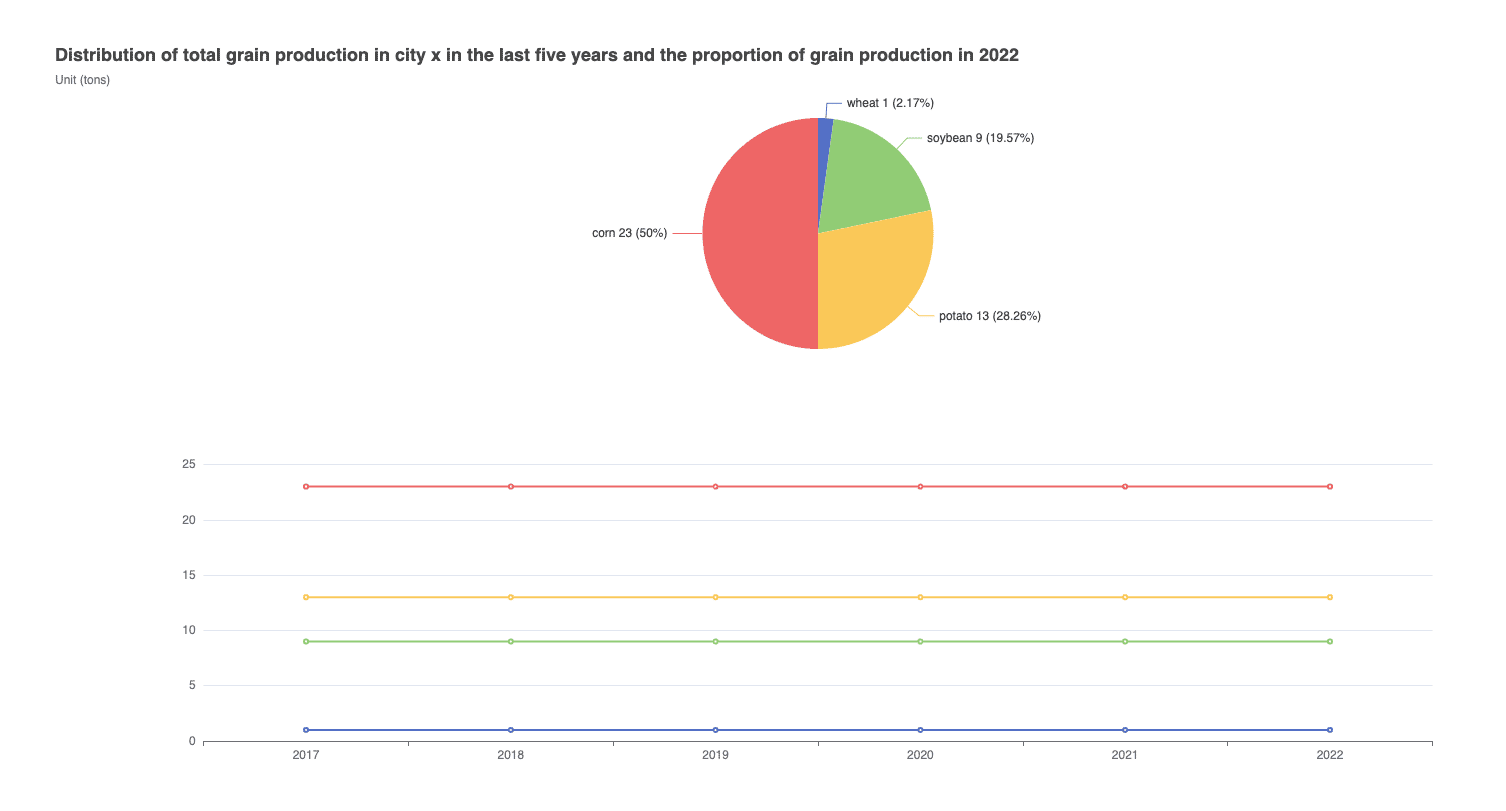
Click on Go Live button in the bottom right corner of WebIDE, to run the project.
Next, open the "Web 8080" on the top of the VM and manually refresh the page to see the following effect in your browser:
Fetch the Data
In this step, you will complete the data request and display the crop yield data correctly in the line chart and pie chart.
- In the
index.htmlfile, locate the// TODOsection. - Use the
axios.get()method to fetch the data from thedata.jsonfile.
axios.get("./data.json").then((res) => {
  let data = res.data.data;
  // TODO: Process the data and update the option object
});
- Inside the
.then()callback, process the data from thedata.jsonfile and update theoptionobject accordingly.- Create an object
dataObjto store the data for each crop type. - Create an array
sourceTipto store the labels for the data. - Loop through the data and populate the
dataObjandsourceTiparrays. - Create a new
newSourcearray and populate it with the data fromdataObjandsourceTip. - Update the
option.dataset.sourcewith thenewSourcearray. - Call
myChart.setOption(option)to update the chart with the new data.
- Create an object
// TODO
let dataObj = {
  wheat: ["wheat"],
  soybean: ["soybean"],
  potato: ["potato"],
  corn: ["corn"]
};
let sourceTip = ["all"];

axios.get("./data.json").then((res) => {
  let data = res.data.data;

  for (const key1 in data) {
    sourceTip.push(key1);
    for (const key2 in data[key1]) {
      dataObj[key2].push(data[key1][key2]);
    }
  }

  let newSource = [];
  newSource.push(sourceTip);
  for (const key in dataObj) {
    newSource.push(dataObj[key]);
  }

  option.dataset.source = newSource;
  myChart.setOption(option);
});
- Save the
index.htmlfile and refresh the page. You should now see the updated line chart and pie chart with the correct data.
Summary
Congratulations! You have completed this project. You can practice more labs in LabEx to improve your skills.