Introduction
In this project, you will learn how to fetch data from a JSON file, render the protein content of different foods, and create an Echarts pie chart to visualize the data. This project aims to provide you with a hands-on experience in working with data manipulation and data visualization using JavaScript.
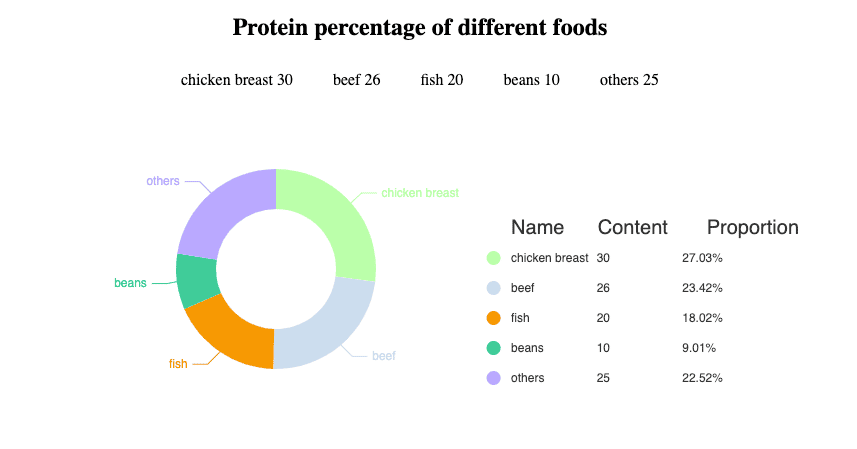
👀 Preview
🎯 Tasks
In this project, you will learn:
- How to fetch data from a JSON file using the Fetch API
- How to render the protein content of different foods on the web page
- How to create an Echarts pie chart to visualize the protein content data
🏆 Achievements
After completing this project, you will be able to:
- Fetch data from a JSON file and process the data
- Dynamically render HTML elements based on the fetched data
- Use the Echarts library to create an interactive pie chart
- Integrate data visualization into a web application
Set Up the Project Structure
In this step, you will set up the project files and structure. Follow the steps below to complete this step:
Open the project folder. The directory structure is as follows:
├── css
├── index.html
├── lib
└── mock
    └── data.json
Among them:
index.htmlis the main page.cssis the folder that stores the project styles.libis the folder that stores the project dependencies.mock/data.jsonis the JSON data used in the project request.
Click on Go Live button in the bottom right corner of WebIDE, to run the project.
Next, open "Web 8080" on the top of the VM and refresh it manually and you will see the page.
Fetch Data and Render the Protein Content
In this step, you will learn how to fetch data from the provided JSON file and render the protein content of different foods.
- Open the
index.htmlfile in the project directory. - Locate the
TODOcomment in theindex.htmlfile, which is inside the<script>tag. - Inside the
fetchDatafunction, add the following code to fetch the data from theMockURLand render the protein content:
let dataList = ref([]);
async function fetchData() {
  // TODO: code to be added
  let data = await fetch(MockURL).then((res) => res.json());
  data.unshift({
    name: "header",
    icon: "none"
  });
  echartsInit(data);
  dataList.value = data.slice(1);
}

return {
  echartsInit,
  fetchData
};
- In the
onMountedhook, call thefetchDatafunction to fetch the data and render the protein content. Finally, it returns withinreturn.
onMounted(() => {
  fetchData();
});
return {
  echartsInit,
  fetchData,
  dataList
};
- Add the following code under
TODO: code to be added to render the fetched datain HTML to display the data.
<div class="protein-item" v-for="data in dataList" :key="data.name">
  {{data.name}} {{data.value}}
</div>
- Save the
index.htmlfile and refresh the page. You should now see the protein content of different foods displayed in the.protein-containerelement.
The completed effect is as follows:
Congratulations! You have completed the "Food Protein Revealed" project. You have learned how to fetch data from a JSON file, render the protein content, and create an Echarts pie chart to visualize the data.
Summary
Congratulations! You have completed this project. You can practice more labs in LabEx to improve your skills.