
Introduction
In this lab, you will learn how to install and configure Wireshark, a robust network protocol analyzer. It enables real-time examination of network traffic, which is crucial for network troubleshooting and security investigations.
By the end of this lab, you'll be capable of capturing and analyzing network packets on your system, gaining hands - on experience with this essential tool.
Installing Wireshark
In this step, we will install Wireshark on our Ubuntu system. Wireshark is a powerful network protocol analyzer that allows you to capture and analyze network traffic. It's a crucial tool for anyone interested in network security and traffic analysis. The good news is that Wireshark is available in the Ubuntu repositories, which means we can easily install it using the package management system provided by Ubuntu.
First, let's update the package repository information. The package repository is like a catalog of all the software available for your Ubuntu system. By updating it, we ensure that we have access to the latest software versions. To do this, we need to open a terminal. You can open a terminal by clicking on the terminal icon in the taskbar or by pressing Ctrl+Alt+T. Once the terminal is open, enter the following command:
sudo apt update
The sudo command is used to run commands with administrative privileges. apt is the package management tool in Ubuntu, and update is the command to refresh the package repository information. When you run this command, you should see output similar to this:
Hit:1 http://archive.ubuntu.com/ubuntu jammy InRelease
Get:2 http://archive.ubuntu.com/ubuntu jammy-updates InRelease [119 kB]
Get:3 http://archive.ubuntu.com/ubuntu jammy-backports InRelease [108 kB]
Get:4 http://security.ubuntu.com/ubuntu jammy-security InRelease [110 kB]
Get:5 http://archive.ubuntu.com/ubuntu jammy-updates/main amd64 Packages [1,234 kB]
...
Reading package lists... Done
This output shows that the system is fetching the latest information about available packages from the repositories.
Now that our package repository is updated, we can install Wireshark using the apt package manager. Run the following command in the terminal:
sudo apt install wireshark -y
The install command tells apt to install the specified package, which is wireshark in this case. The -y option is used to automatically answer "yes" to all prompts during the installation process.
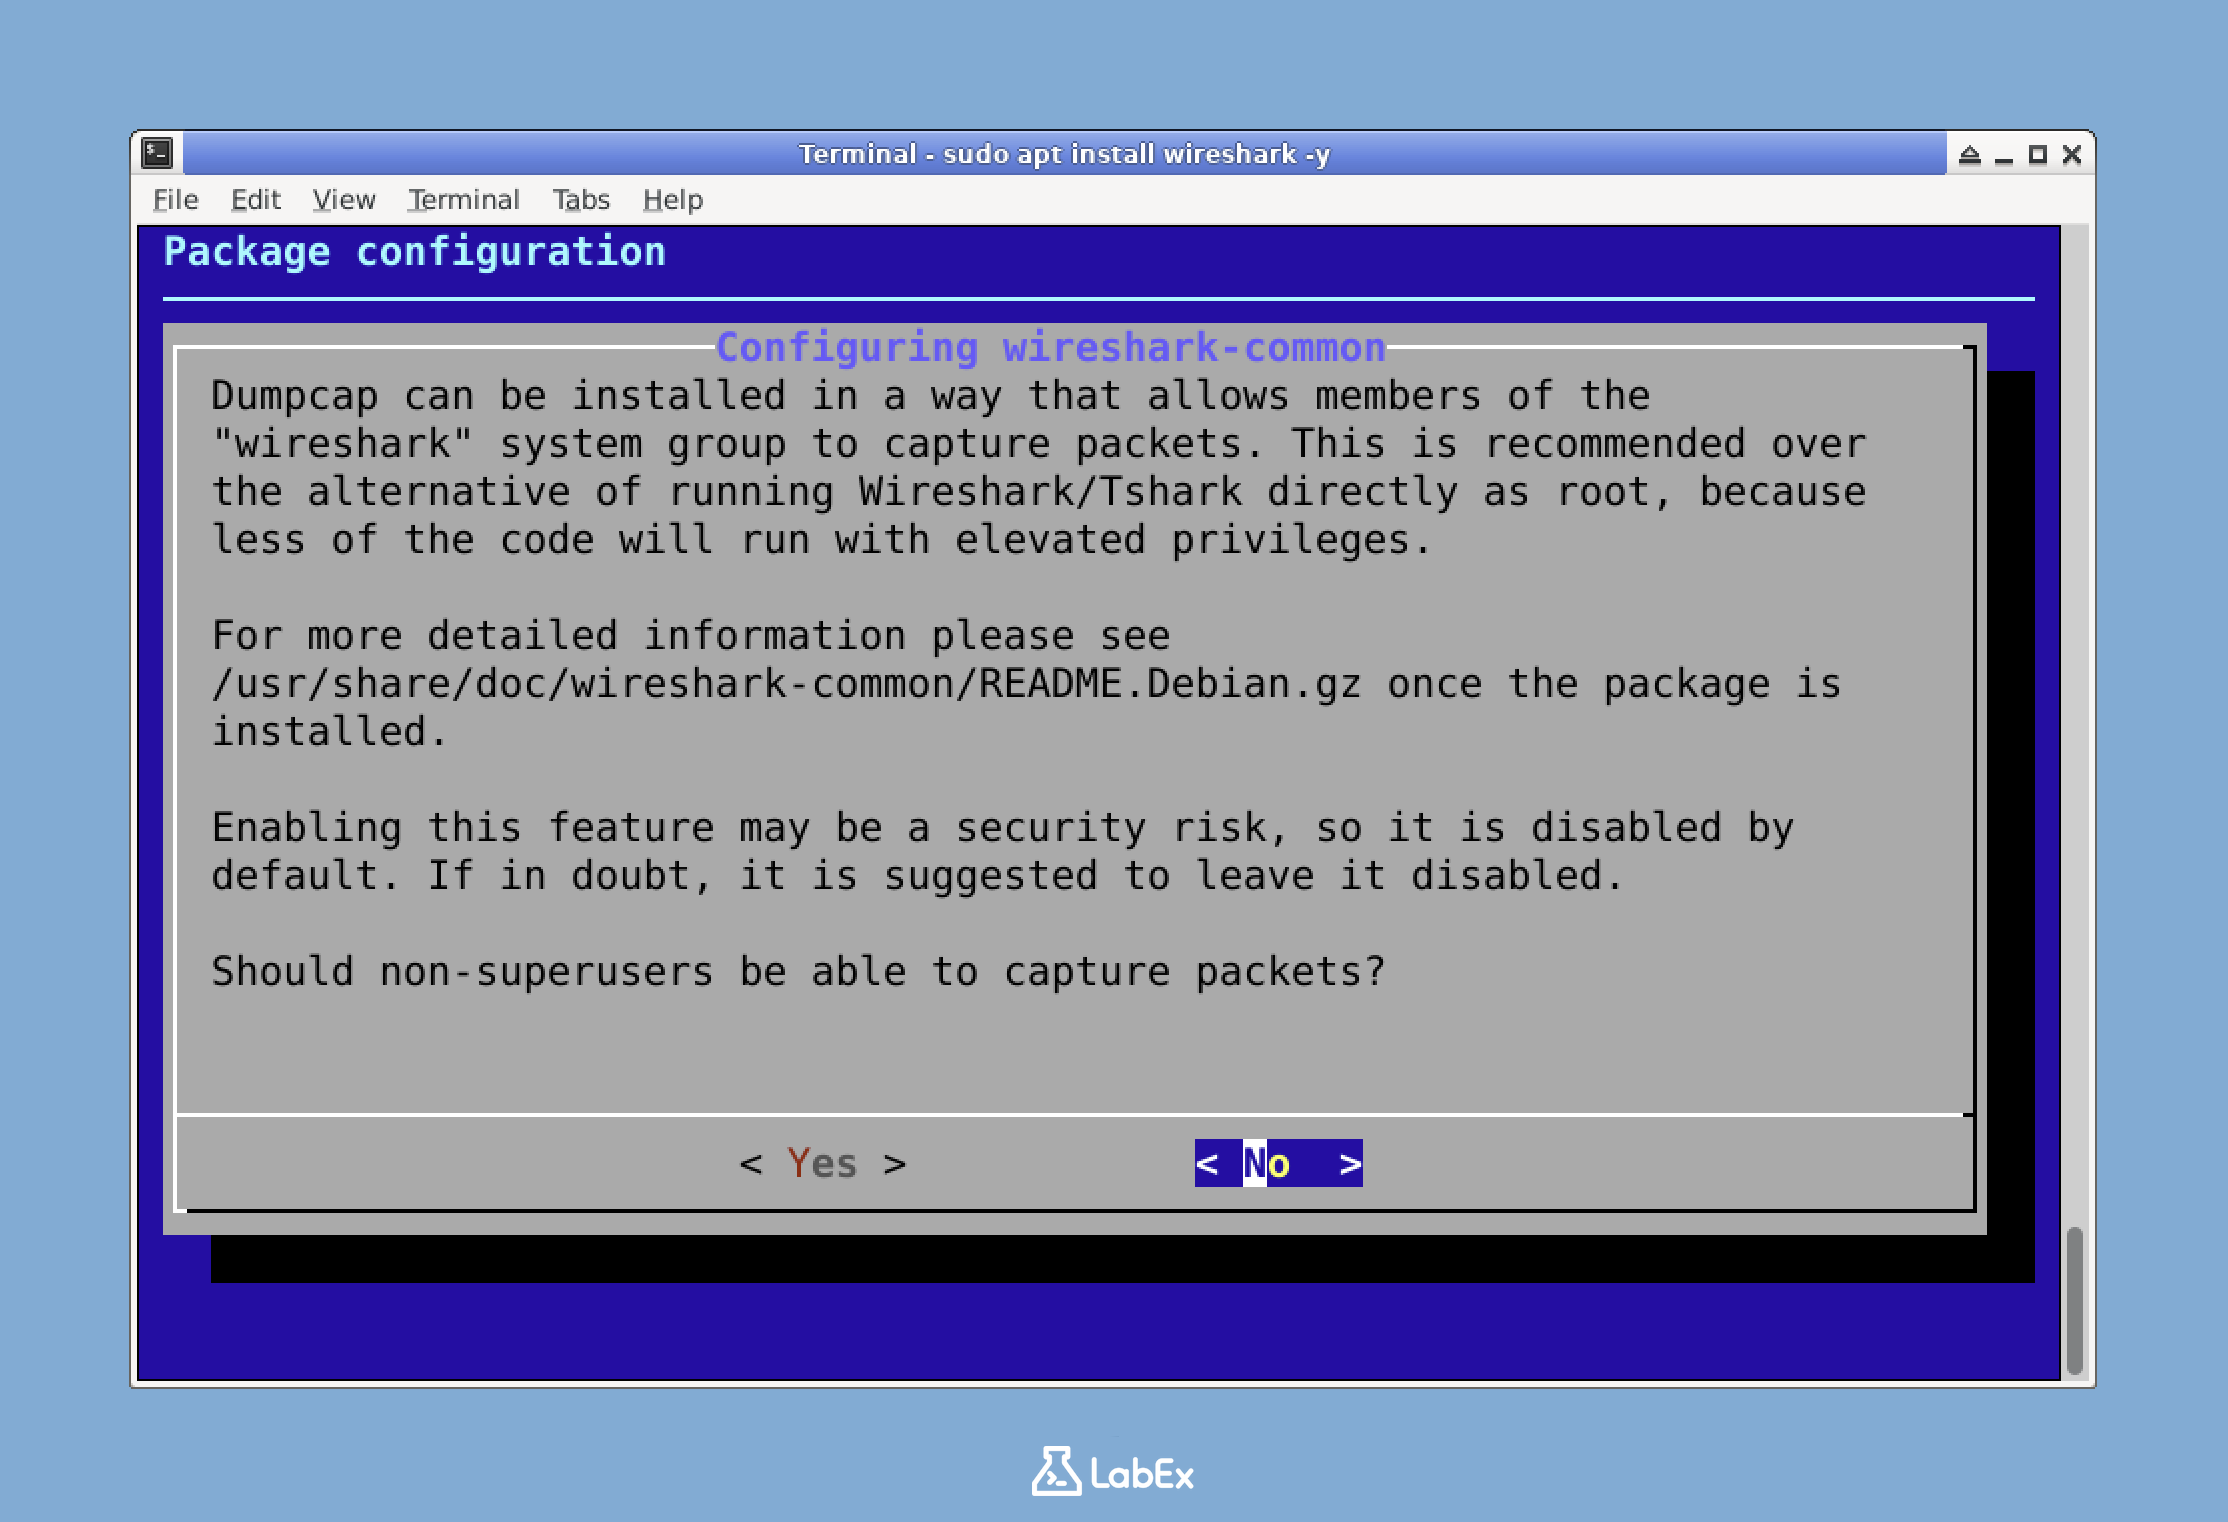
During the installation process, you will be presented with a configuration dialog asking whether to allow non-superusers to capture packets. Allowing non-superusers to capture packets can be useful if you want to run Wireshark without always using administrative privileges. Use the arrow keys to select "Yes" (or press y) and press Enter to confirm your selection.
Note: If you missed this prompt or need to change this setting later, you can reconfigure Wireshark using the following command:
sudo dpkg-reconfigure wireshark-commonThe
dpkg-reconfigurecommand is used to reconfigure an already installed package.
Once the installation completes, you should see output indicating the installation was successful. To verify that Wireshark was installed correctly, we can check its version. Run the following command in the terminal:
wireshark --version
This command tells Wireshark to display its version information. You should see output similar to this:
Wireshark 3.6.2 (Git v3.6.2 packaged as 3.6.2-2)

Copyright 1998-2022 Gerald Combs <gerald@wireshark.org> and contributors.
License GPLv2+: GNU GPL version 2 or later <https://www.gnu.org/licenses/>
This is free software; see the source for copying conditions. There is NO
warranty; not even for MERCHANTABILITY or FITNESS FOR A PARTICULAR PURPOSE.

Compiled (64-bit) with Qt 5.15.3, with libpcap, with GLib 2.72.0, with zlib 1.2.11,
with SMI 0.4.8, with c-ares 1.18.1, with Lua 5.2.4, with GnuTLS 3.7.3 and PKCS #11
support, with Gcrypt 1.9.4, with MIT Kerberos, with MaxMind DB resolver,
with nghttp2 1.43.0, with brotli, with LZ4, with Zstandard, with Snappy,
with libxml2 2.9.13, with libssh 0.9.6, with NGHTTP3 0.7.0, with NGTCP2 0.8.0.
Great! Wireshark is now installed on your system.
Configuring Wireshark Capture Permissions
In this step, we're going to configure the necessary permissions for Wireshark to capture network packets. As a beginner, you might wonder why we need to do this. Well, by default, packet capturing requires root privileges. This is a security measure because capturing network packets can potentially expose sensitive information. However, running Wireshark as root is not a good idea from a security perspective. If there's a vulnerability in Wireshark, an attacker could gain full system access if it's running as root. So, we'll configure Wireshark to allow your regular user account to capture packets safely.
First, we need to check if the wireshark group exists on the system. The wireshark group is a special group that we'll use to manage the permissions for packet capturing. To check if this group exists, we'll use the getent command. getent is a utility that retrieves entries from various system databases, like the group database in this case. Run the following command in your terminal:
getent group wireshark
If no output appears, it means the group doesn't exist yet, and we need to create it. We'll use the groupadd command to create the wireshark group. The groupadd command is used to create a new group on the system. Run the following command:
sudo groupadd wireshark
The sudo command is used to run the groupadd command with administrative privileges. You'll be prompted to enter your password if you haven't recently used sudo.
Next, we need to give the correct permissions to the packet capture binary (dumpcap). dumpcap is the component that actually captures packets for Wireshark. We'll change the group ownership of the dumpcap binary to the wireshark group. This way, the dumpcap binary will be associated with the wireshark group, and we can manage its permissions through this group. Run the following command:
sudo chgrp wireshark /usr/bin/dumpcap
The chgrp command is used to change the group ownership of a file or directory. In this case, we're changing the group ownership of the /usr/bin/dumpcap binary to the wireshark group.
After changing the group ownership, we'll set the necessary permissions on the dumpcap binary. We'll use the chmod command to set the permissions. The chmod command is used to change the permissions of a file or directory. Run the following command:
sudo chmod 4755 /usr/bin/dumpcap
This command sets the setuid bit on the binary. The setuid bit allows the binary to execute with the permissions of the owner (root) regardless of who is running it. The 4755 permission can be broken down as follows:
4- Sets the setuid bit. This means that when the binary is executed, it will run with the permissions of the owner (root).7- Owner (root) has read, write, and execute permissions. This allows the owner to read, modify, and run the binary.5- Group has read and execute permissions. This allows the members of thewiresharkgroup to read and run the binary.5- Others have read and execute permissions. This allows other users on the system to read and run the binary.
Finally, we need to add our current user to the wireshark group. By adding our user to the wireshark group, our user will have the necessary permissions to use the dumpcap binary. We'll use the gpasswd command to add our user to the group. The gpasswd command is used to administer the /etc/group and /etc/gshadow files. Run the following command:
sudo gpasswd -a $USER wireshark
The $USER variable is a shell variable that contains the username of the current user. You should see output indicating that the user was added to the group:
Adding user labex to group wireshark
For these changes to take effect, you need to log out and log back in, or restart the system. However, for this lab, we can use a simpler approach by starting a new shell with the updated group membership. We'll use the newgrp command to start a new shell with the wireshark group active. The newgrp command is used to change the current group ID. Run the following command:
newgrp wireshark
This command starts a new shell with the wireshark group active, without requiring a full logout.
Let's verify that our user is now part of the wireshark group. We'll use the groups command to list all the groups that our user belongs to. Run the following command:
groups
You should see wireshark listed among the groups:
wireshark sudo ssl-cert labex public
Now that our user is part of the wireshark group and the dumpcap binary has the correct permissions, Wireshark should be able to capture packets without requiring root privileges.
Launching Wireshark
In this step, we're going to launch Wireshark and get to know its initial interface. Wireshark is a powerful tool for network traffic analysis, and it comes with a graphical user interface (GUI). This GUI is what we'll use to interact with the software and analyze the network traffic.
First, you need to make sure you're in the desktop environment of the LabEx VM. When you're in the right place, you'll see a desktop with icons and a taskbar either at the top or the bottom of the screen. This is the starting point where we'll begin our work with Wireshark.
There are two ways to launch Wireshark. You can choose the method that's most convenient for you:
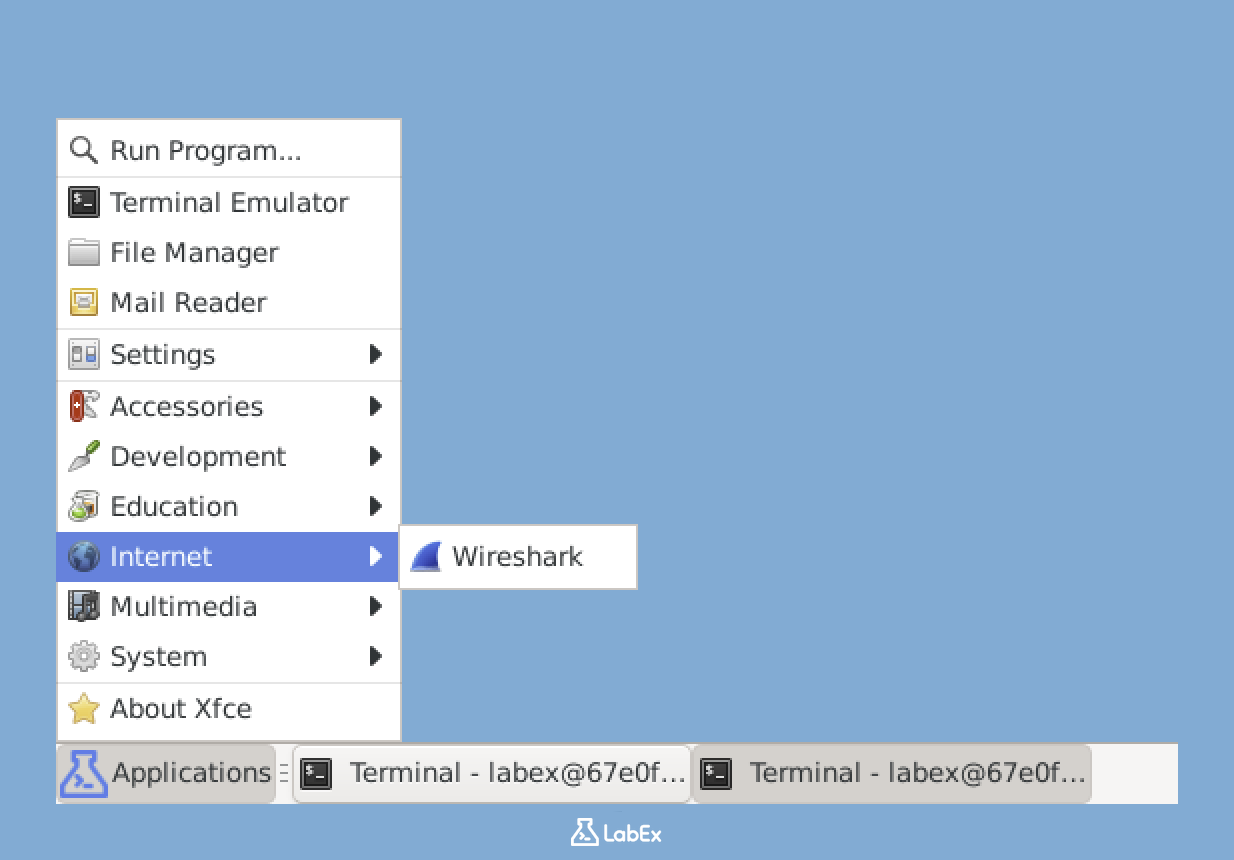
Click on the Applications menu, which is usually located in the top-left corner of the screen. Then, navigate through the menu to find the "Internet" or "Network" categories. Once you're in the appropriate category, look for and select "Wireshark". This is a straightforward way to start the program using the graphical interface.
Alternatively, you can use the terminal. Open a terminal window, and then enter the following command:
wireshark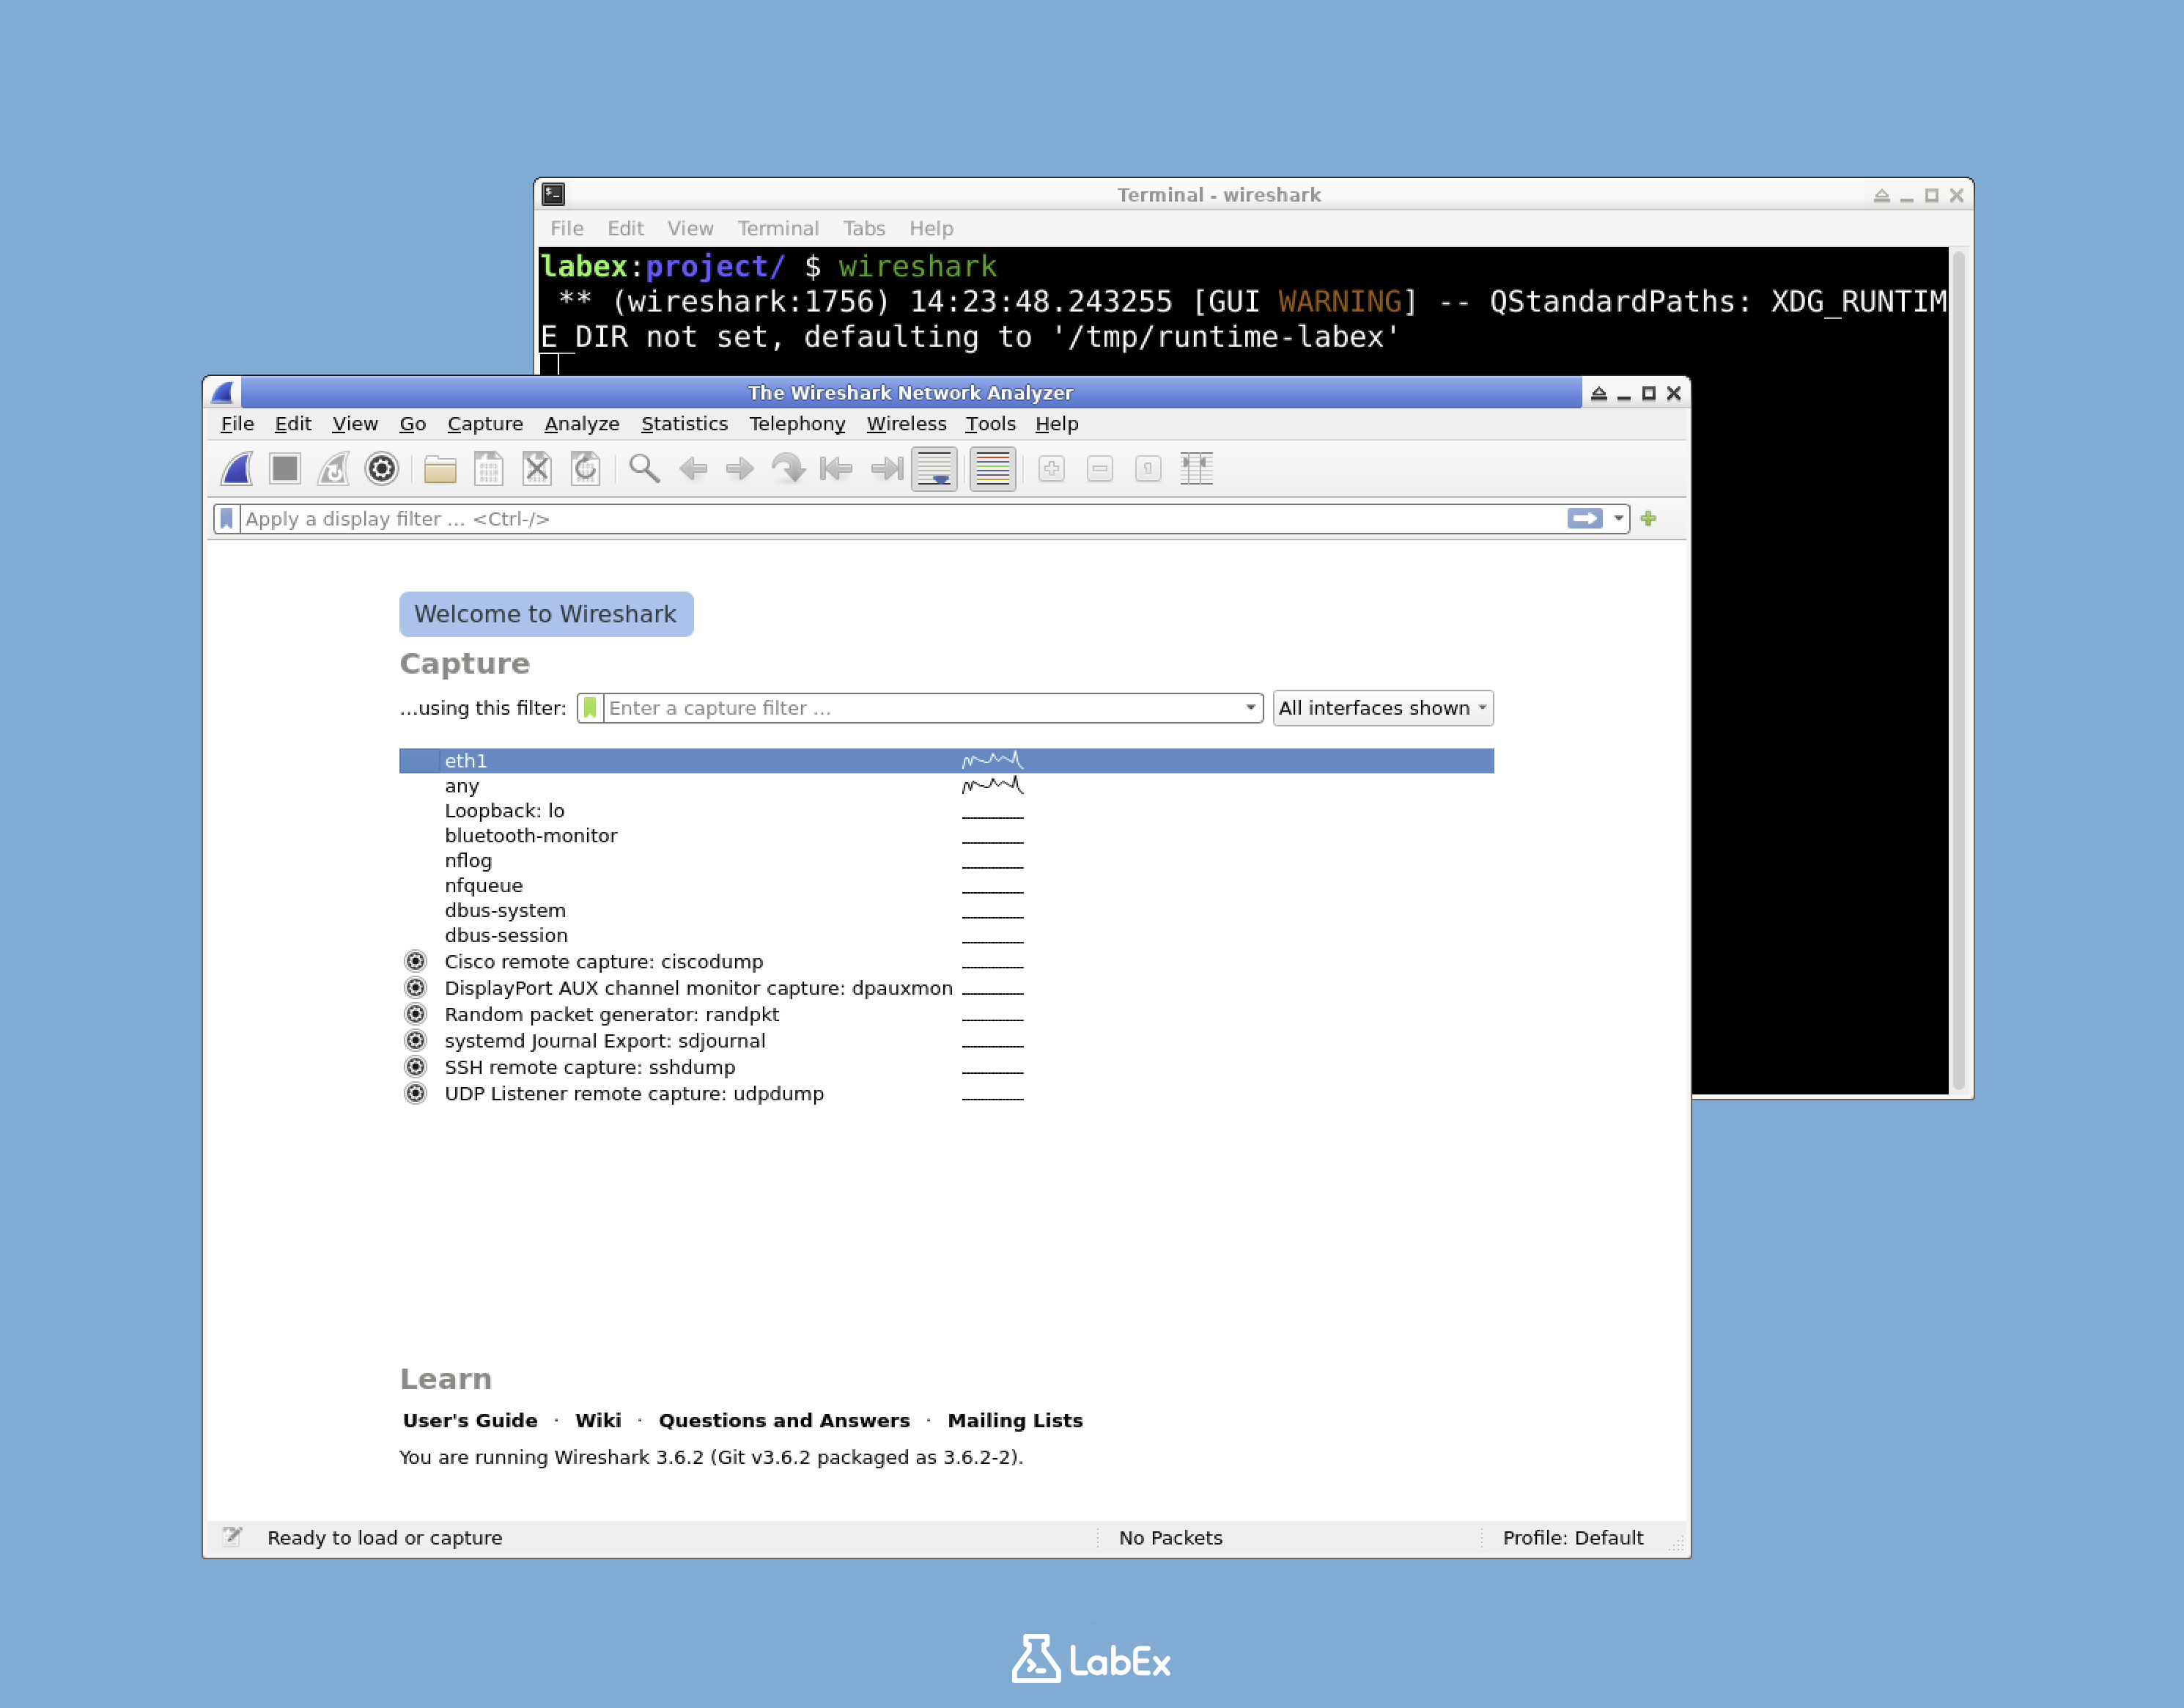
This command tells the system to start the Wireshark application. After you execute this command, Wireshark will start up, and its main window will appear on the screen. The first thing you'll see is the "Welcome to Wireshark" screen. This screen shows a list of available network interfaces that you can use to capture network traffic. It also displays some recently opened capture files, if you've used Wireshark before and have some files saved.
The welcome screen provides several important options:
- You can select a network interface from the list. Once you choose an interface, Wireshark will start capturing packets from that network immediately. This is how you'll start collecting data about the network traffic.
- If you have a previously saved capture file, you can open it from this screen. This is useful if you want to analyze data that you've collected in the past.
- There are also various tools and settings that you can access from this screen. These tools and settings will help you customize your experience with Wireshark and perform more advanced analysis.
Take a little time to explore this initial screen. You'll notice that each network interface has some statistics about the packets that have been detected. These statistics give you a quick idea of which interfaces are actively passing network traffic.
Now, let's look at the main interface elements of Wireshark:
- Menu bar: This bar at the top of the window gives you access to all the features that Wireshark offers. You can use it to perform various tasks, such as saving capture files, changing settings, and accessing help.
- Toolbar: The toolbar provides quick access to commonly used functions. For example, you can start and stop packet capture, apply filters, and save files with just a single click.
- Interface list: This list shows all the available network interfaces on your system. You'll use this list to select the interface from which you want to capture packets.
- Display filter bar: This bar allows you to filter the packets that are displayed in the main window. You can use various criteria, such as IP addresses, protocols, or port numbers, to narrow down the packets that you're interested in. We'll explore how to use this filter in the next step.
For now, leave Wireshark running. In the next step, we'll use it to capture and analyze network traffic.
Capturing and Analyzing Network Traffic
In this step, we're going to capture some network traffic and explore the Wireshark interface. Understanding how to analyze network packets is crucial for anyone interested in network security or troubleshooting. By the end of this section, you'll know how to start a capture, understand the Wireshark interface, generate traffic, filter packets, inspect packet details, and stop the capture.
Starting a Capture
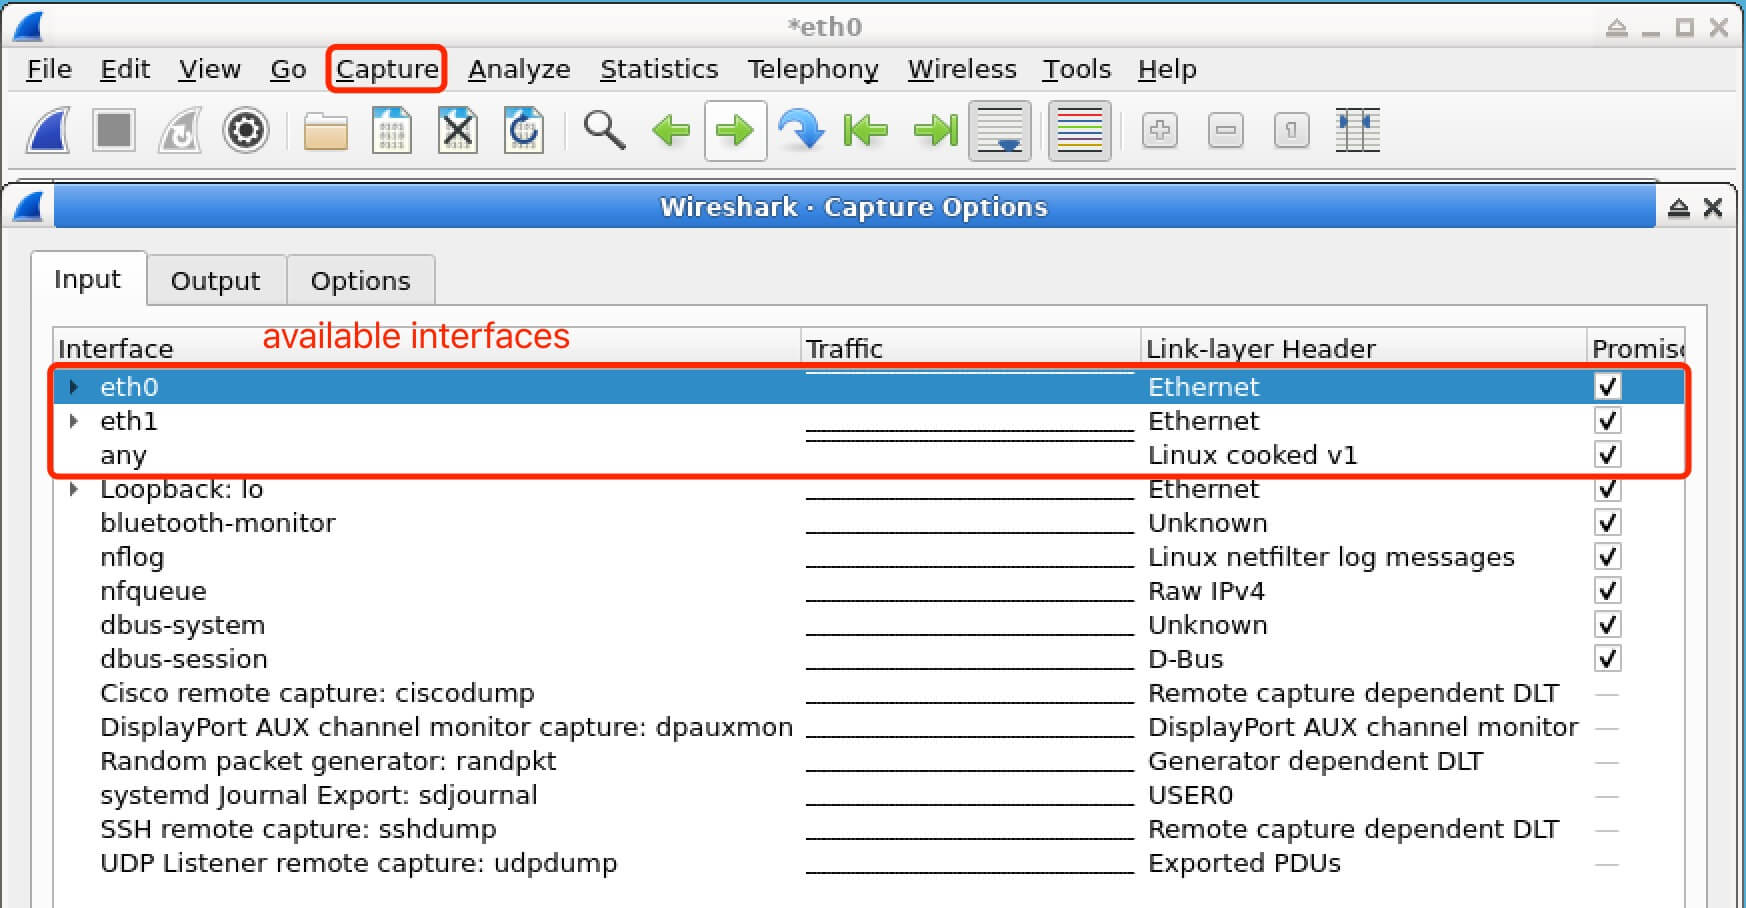
When you open Wireshark, you'll see a welcome screen. On this screen, your goal is to find the network interface you want to capture traffic from. In most cases, we'll use the eth0 interface. If eth0 isn't available, you can choose another active interface (e.g., eth1 or wlan0).
To start capturing packets, simply double - click on the eth0 interface. This action will immediately start capturing packets on that interface and take you to the main Wireshark capture window.
Alternatively, you can first select the interface and then click on the "Start capturing packets" button, which is represented by a blue shark fin icon in the toolbar. Starting the capture is the first step in analyzing network traffic, as it allows Wireshark to collect data flowing through the selected interface.
Understanding the Wireshark Interface
Once the packet capture starts, you'll be presented with the main Wireshark interface. This interface is divided into three main panes, each serving a different purpose.
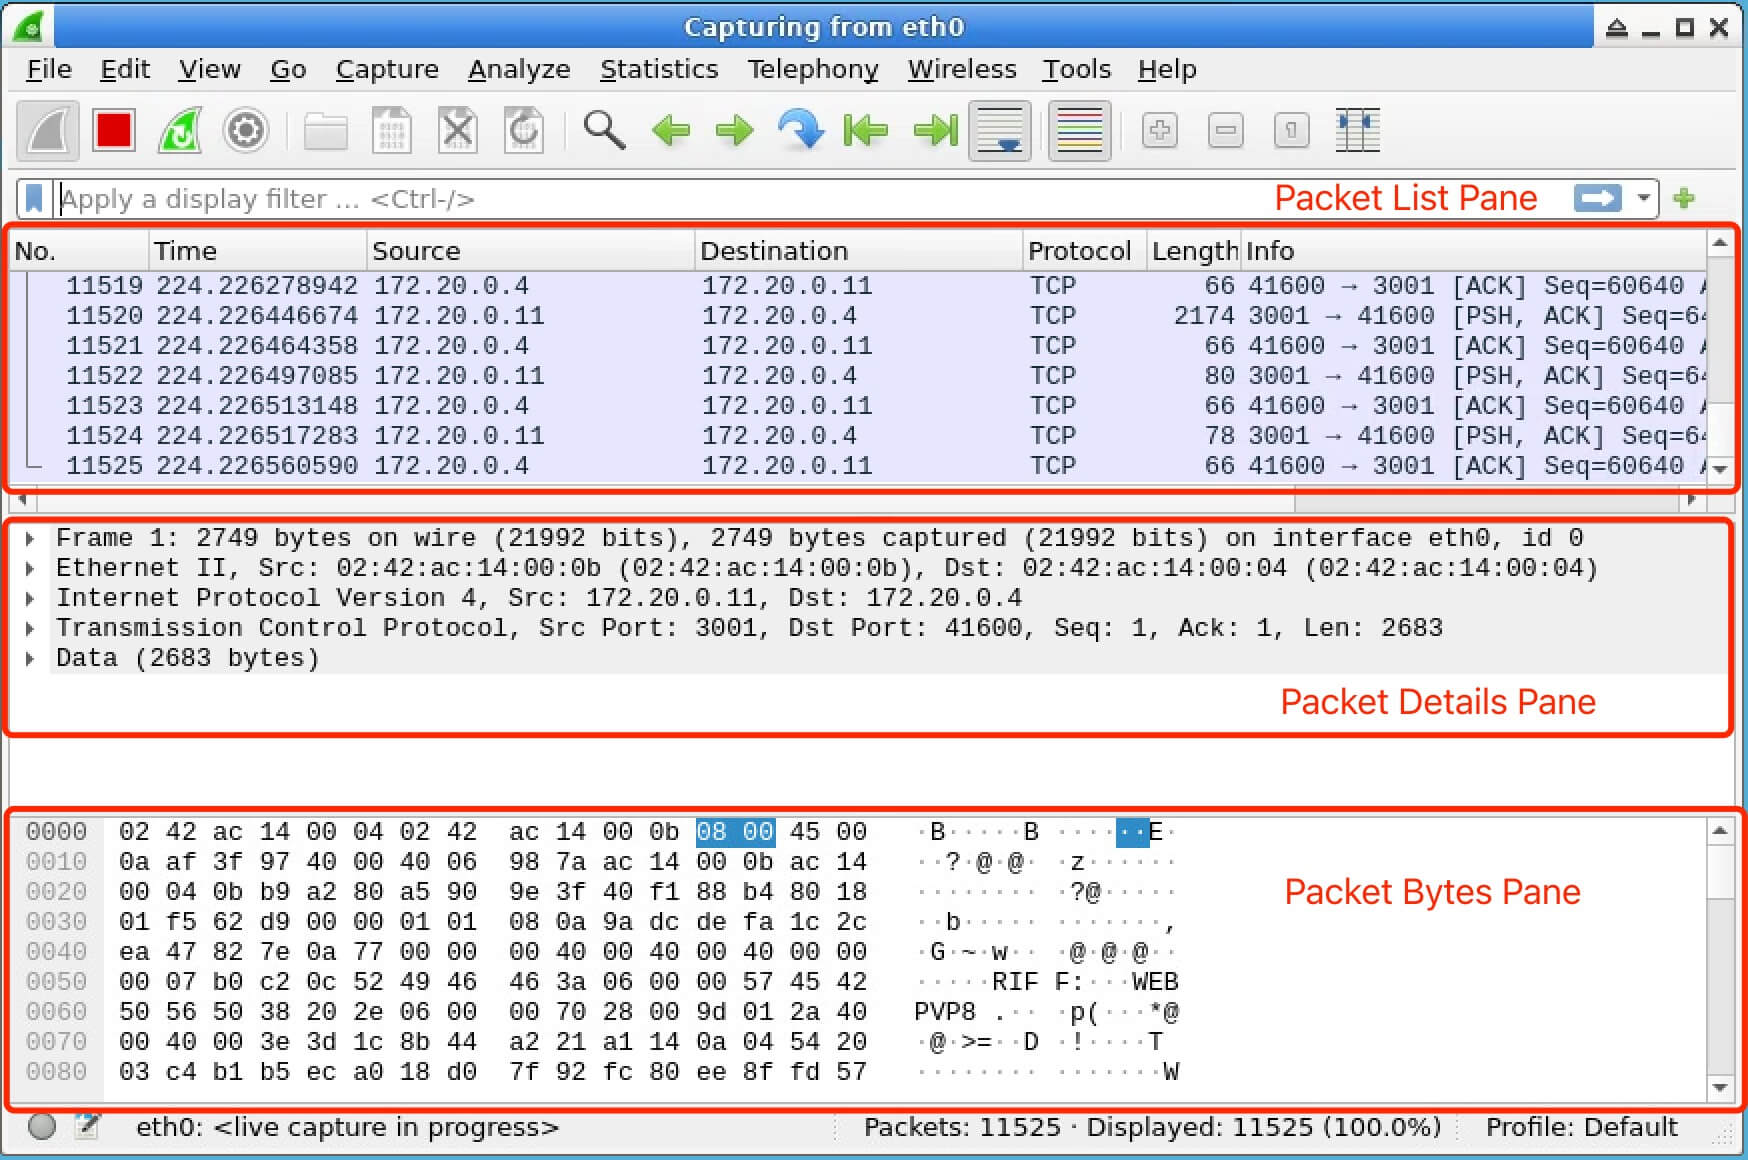
Packet List Pane (Top): This pane displays a list of all the packets that Wireshark has captured. Each entry in the list provides basic information about a packet, including:
- Packet number: A unique identifier for each packet in the capture.
- Time: The time when the packet was captured.
- Source IP address: The IP address of the device that sent the packet.
- Destination IP address: The IP address of the device that the packet is intended for.
- Protocol: The network protocol used by the packet, such as TCP, UDP, or ICMP.
- Length: The size of the packet in bytes.
- Info: A brief description of the packet's purpose, which can help you quickly understand what the packet is doing.
Packet Details Pane (Middle): When you select a packet in the top pane, this area shows detailed information about the selected packet in a hierarchical format. You can expand each section by clicking on the arrow next to it to see more in - depth details about the packet's structure and content.
Packet Bytes Pane (Bottom): This pane shows the raw packet data in both hexadecimal and ASCII formats. As you select different fields in the Packet Details pane, the corresponding bytes are highlighted in this pane. This allows you to see the actual data that is being transmitted in the packet.
Generating Some Network Traffic
To have something meaningful to analyze, we need to generate some network traffic. While Wireshark is running, open a new terminal window. In the terminal, we'll use the ping command to send some ICMP echo request packets to Google's servers.
Execute the following command:
ping -c 5 google.com
Note: Free users can not connect to the internet. Upgrade to a pro to enjoy the full experience.
The -c 5 option tells the ping command to send 5 ICMP echo request packets. After running this command, you should see output similar to:
PING google.com (142.250.180.238) 56(84) bytes of data.
64 bytes from muc11s21-in-f14.1e100.net (142.250.180.238): icmp_seq=1 ttl=118 time=15.6 ms
64 bytes from muc11s21-in-f14.1e100.net (142.250.180.238): icmp_seq=2 ttl=118 time=16.5 ms
64 bytes from muc11s21-in-f14.1e100.net (142.250.180.238): icmp_seq=3 ttl=118 time=15.9 ms
64 bytes from muc11s21-in-f14.1e100.net (142.250.180.238): icmp_seq=4 ttl=118 time=16.2 ms
64 bytes from muc11s21-in-f14.1e100.net (142.250.180.238): icmp_seq=5 ttl=118 time=15.7 ms

--- google.com ping statistics ---
5 packets transmitted, 5 received, 0% packet loss, time 4006ms
rtt min/avg/max/mdev = 15.629/15.986/16.520/0.324 ms
Now, go back to Wireshark. You should see the ICMP packets that were captured during the execution of the ping command. These packets are what we'll use for further analysis.
Stopping the Capture
When you're done analyzing the captured packets, you need to stop the capture. To do this, click the "Stop capturing packets" button, which is represented by a red square in the toolbar. Alternatively, you can go to the "Capture" menu and select "Stop".
You've now successfully captured and analyzed some basic network traffic with Wireshark! This is a fundamental skill in network analysis and security, and you can build on this knowledge to analyze more complex network scenarios.
Filtering Packets
Wireshark captures all the traffic on the selected interface, which can quickly become a large amount of data and difficult to manage. Filters are a powerful tool in Wireshark that allow you to focus on specific types of traffic.
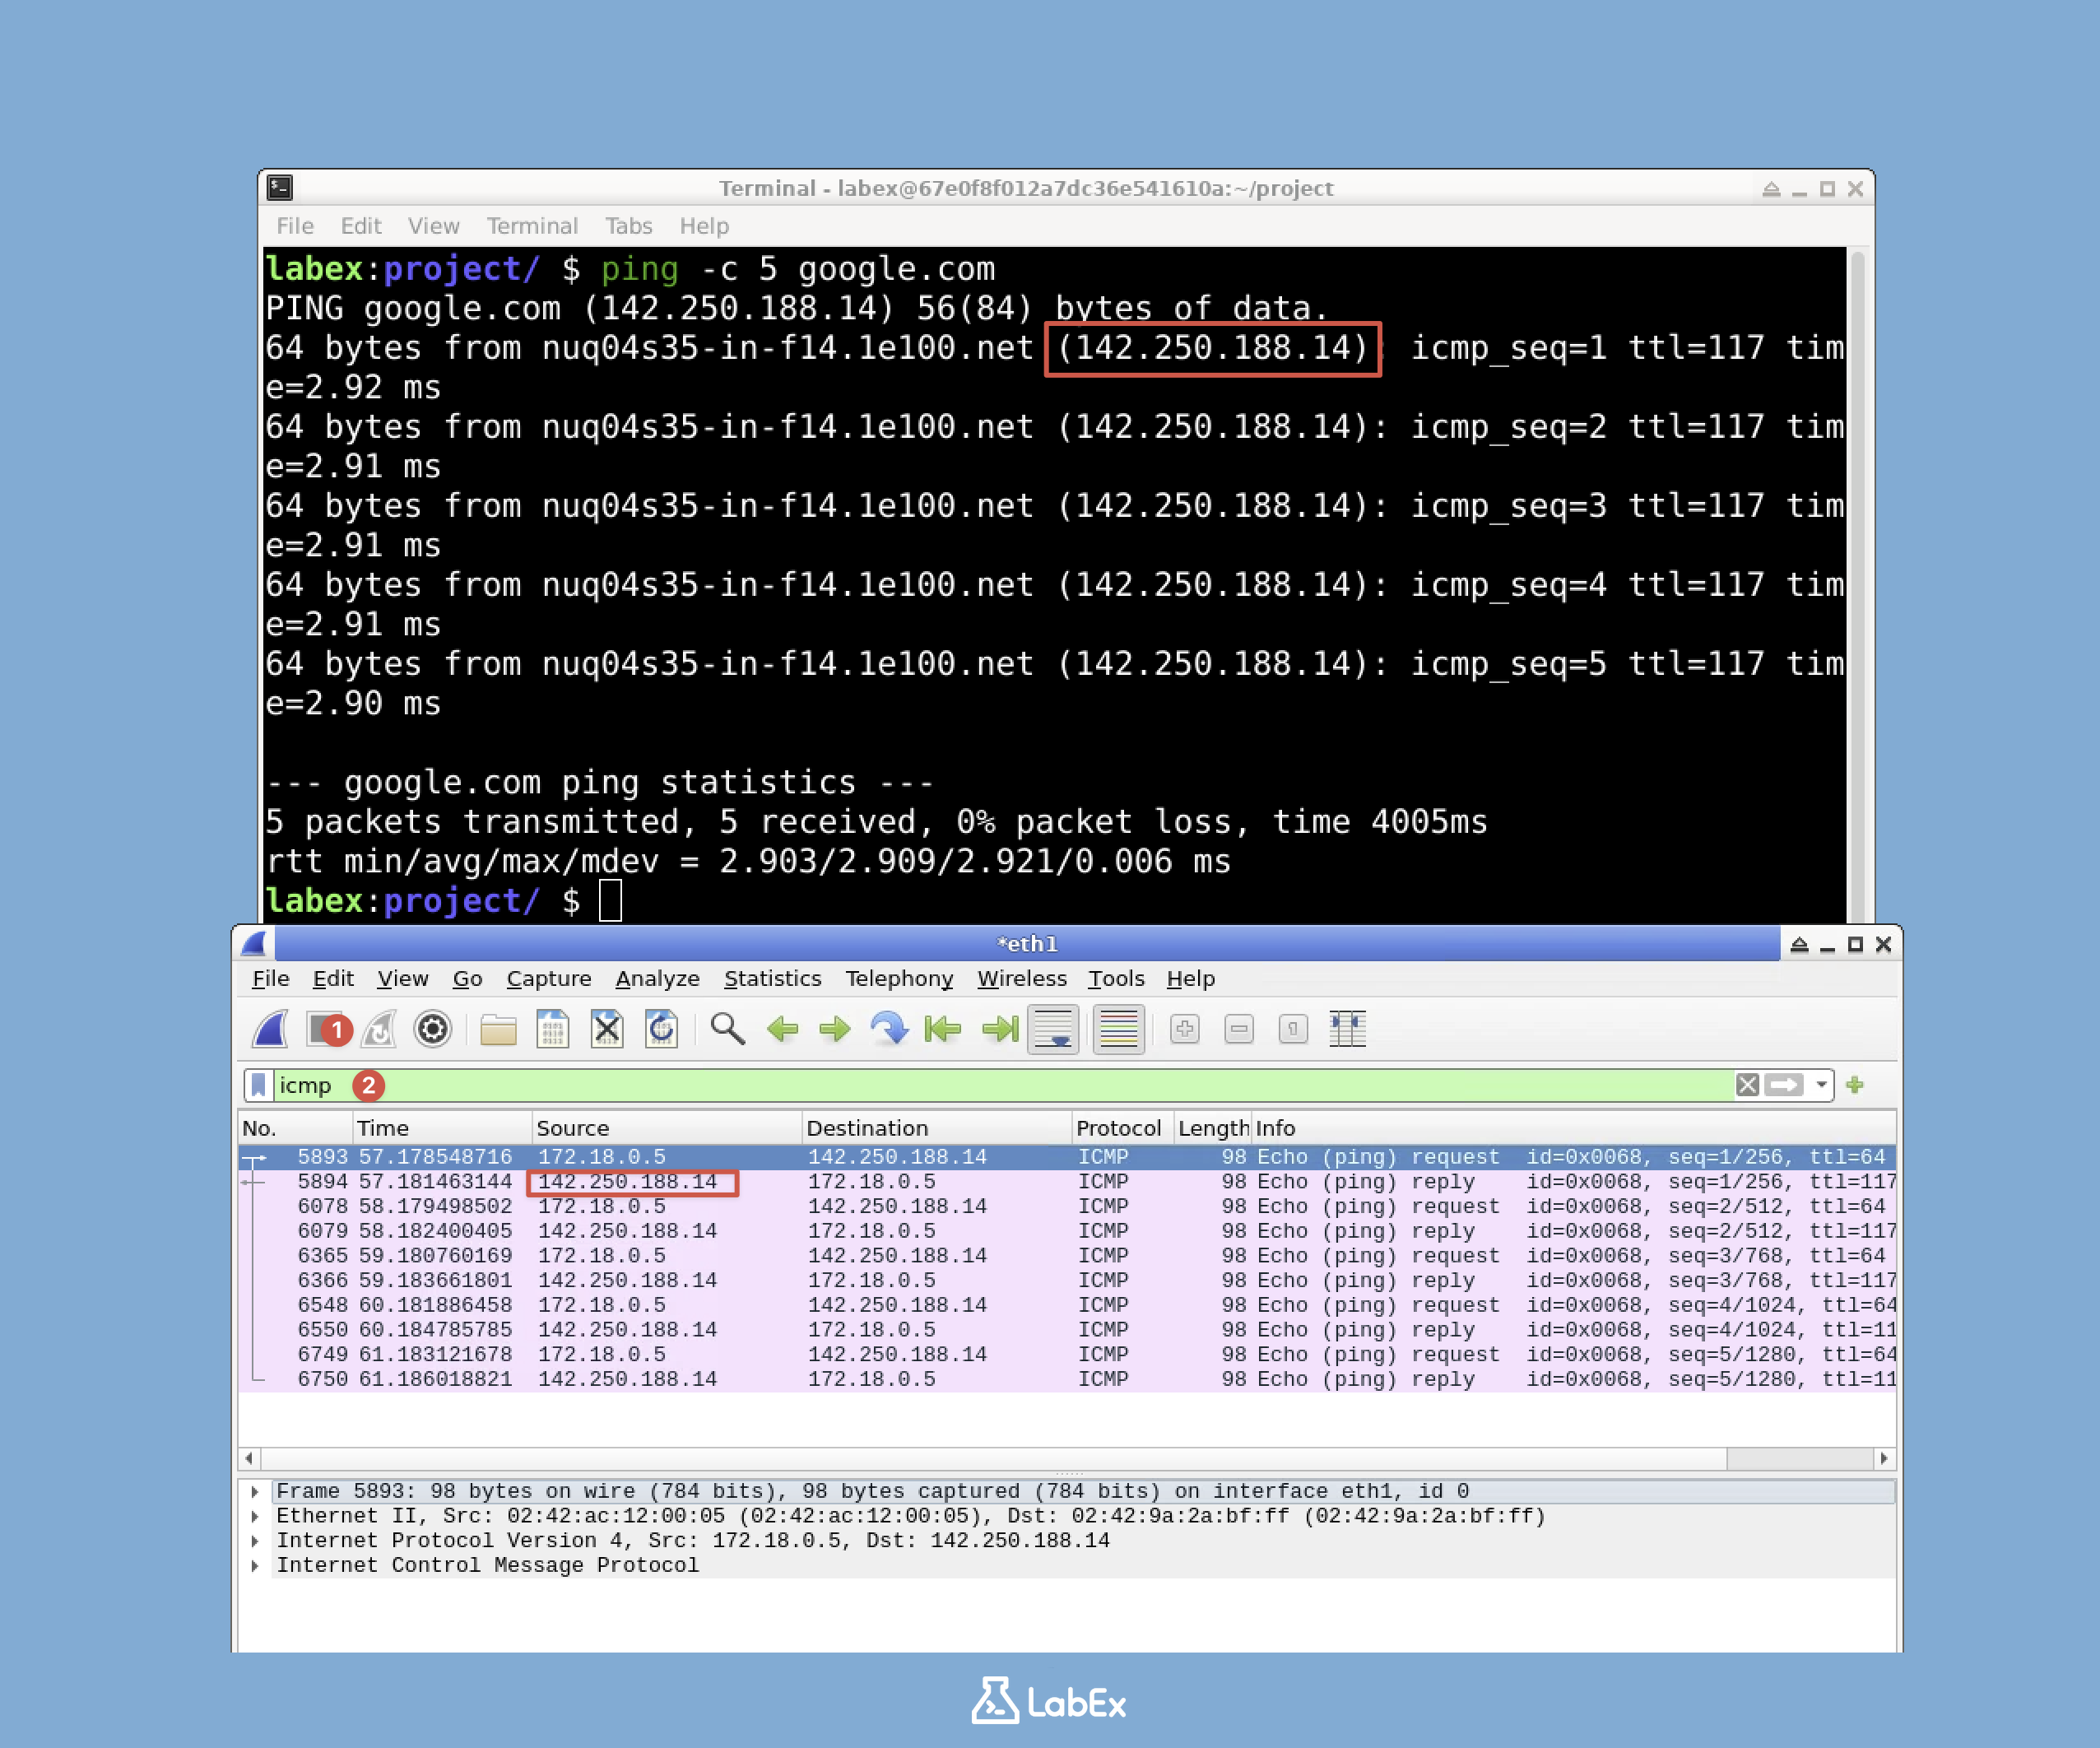
To filter for the ICMP ping packets we just generated, look at the top of the Wireshark window. There's a filter bar where you can type in a filter expression. Type the following in the filter bar:
icmp
After typing the filter expression, press Enter or click the Apply button (a right - arrow icon) next to the filter field. The packet list will update to show only ICMP packets. You should see pairs of "Echo (ping) request" and "Echo (ping) reply" messages corresponding to the ping command we ran earlier. Filtering helps you isolate the traffic you're interested in and makes the analysis process much more manageable.
Inspecting Packet Details
Now that we've filtered for the ICMP packets, let's take a closer look at one of the ICMP request packets. Click on one of the ICMP request packets in the packet list. In the Packet Details pane, you can expand the different protocol layers by clicking on the arrow next to each section.
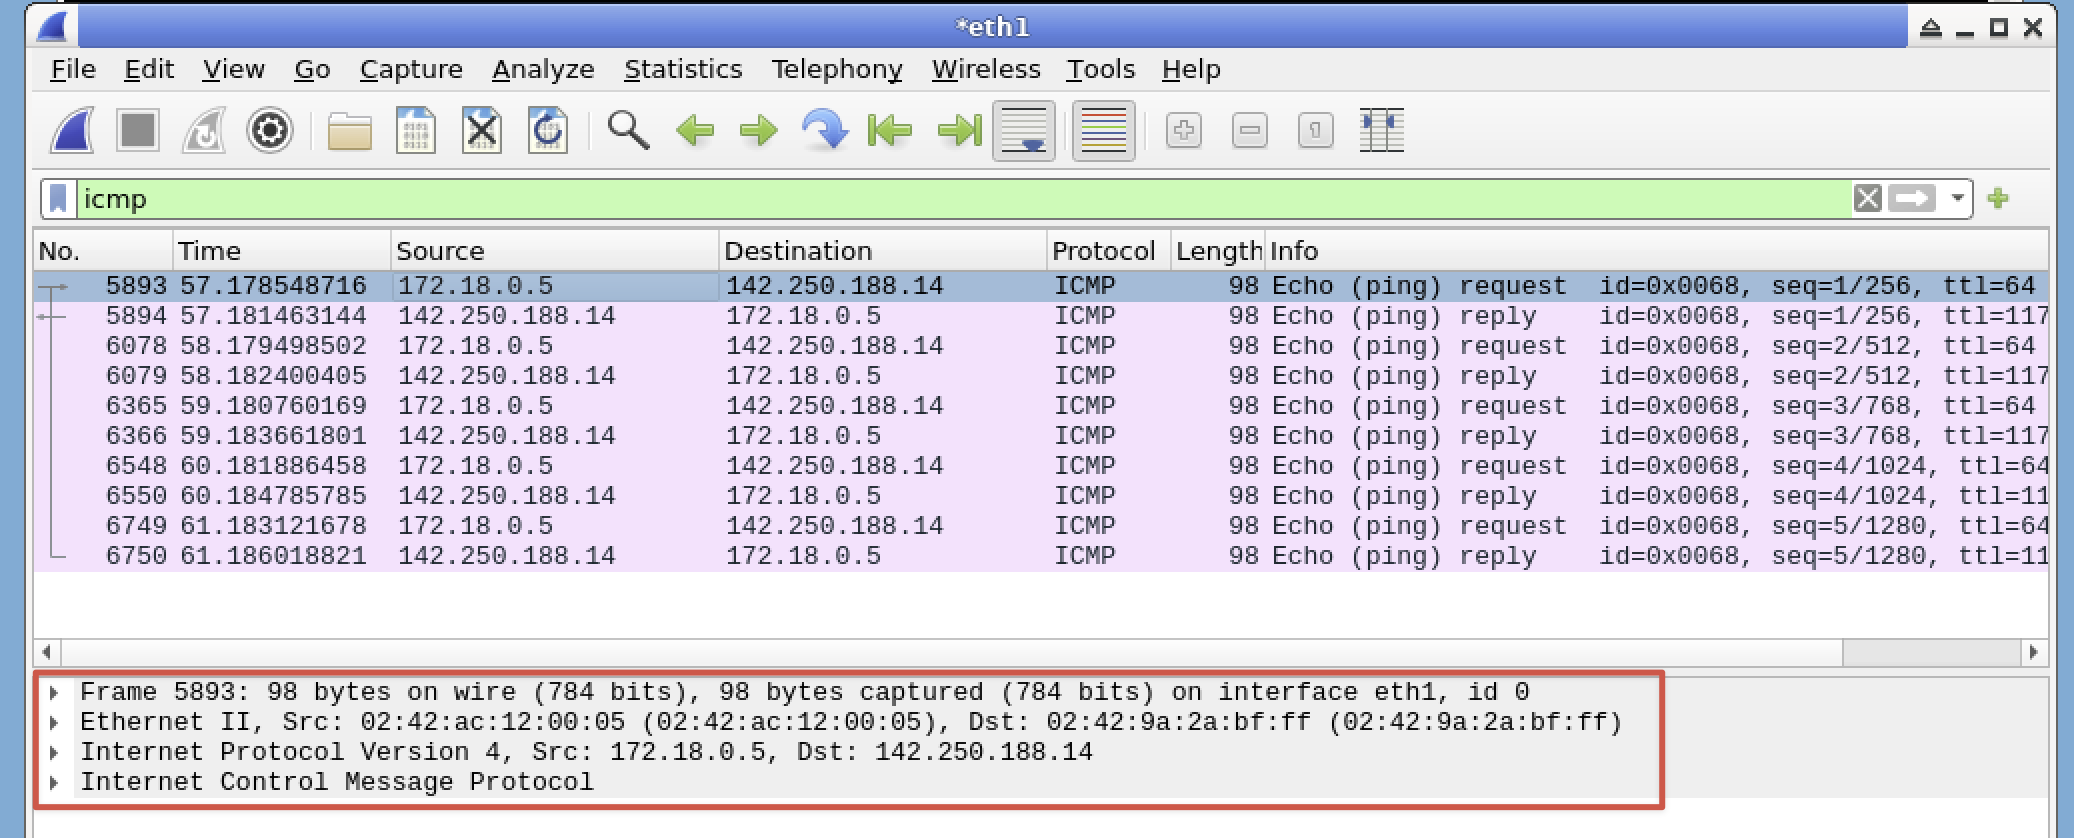
- Frame: This section provides information about the frame or packet as a whole, such as the frame length and the frame check sequence.
- Ethernet: It contains Layer 2 (Data Link) information, like the source and destination MAC addresses.
- Internet Protocol Version 4: This is Layer 3 (Network) information. Expand this section to see details like:
- Source IP address: The IP address of the device that sent the packet.
- Destination IP address: The IP address of the device that the packet is going to.
- Time to Live (TTL): A value that limits the lifespan of the packet in the network.
- Protocol: The protocol used within the IP packet, such as ICMP in our case.
- Internet Control Message Protocol: This section shows the ICMP protocol information. Expand it to see details specific to the ICMP message, such as:
- Type (8 for request, 0 for reply): Indicates whether the packet is a request or a reply.
- Code: Provides additional information about the ICMP message.
- Checksum: Used to verify the integrity of the ICMP message.
- Identifier: Helps in matching requests and replies.
- Sequence number: A sequential number for the ICMP packets.
Summary
In this lab, you have learned how to install and set up Wireshark, a powerful network analysis tool. You configured permissions for non - root users to capture packets safely, launched the application, and captured real network traffic. You also explored the interface, applied filters for specific traffic types, and examined packet details across different protocol layers.
These skills form a solid foundation for network analysis and troubleshooting. With Wireshark, you can now inspect network communications, diagnose connectivity problems, analyze protocol behavior, and identify security concerns in your network traffic.

