
Introduction
In this lab, you will learn how to export packets from Wireshark, a powerful network protocol analyzer. Exporting packets is crucial for network analysis, troubleshooting, and security investigations. It also allows you to share captured data with colleagues.
Throughout this lab, you will capture network traffic, apply filters to target specific communication types, and export the captured data in various formats for further analysis.
Understanding and Installing Wireshark
Wireshark is one of the most widely - used network protocol analyzers in the world. In computer networks, communication happens through small units called packets. Think of packets as little envelopes that carry data across the network. Wireshark gives you the ability to capture these packets and analyze them, allowing you to see what's going on in your network at a very detailed level. It's like having a microscope for your network, helping you understand how data is flowing and if there are any issues.
Launching Wireshark
First, we need to open Wireshark. To do this, we'll start by opening a terminal window. The terminal is a text - based interface where you can enter commands to interact with your computer. You can open a terminal window by clicking on the terminal icon in the taskbar. The taskbar is usually at the bottom or the side of your screen and contains icons for various applications.
Once the terminal is open, we'll use a command to launch Wireshark. In the terminal, type the following command and then press Enter:
wireshark
When you run this command, the Wireshark application will open. You'll see a list of available network interfaces. Network interfaces are the connections your computer uses to communicate with other devices on the network, like Wi - Fi or Ethernet.
After Wireshark opens, take a moment to look around the interface. Understanding the layout will make it easier for you to use the tool later.
- The top section shows available network interfaces. This is where you'll choose which network connection you want Wireshark to capture packets from.
- The middle section shows recently opened files. If you've used Wireshark before and opened some packet capture files, they'll be listed here for easy access.
- The bottom section contains useful links and features. These can help you with various tasks, like getting help or accessing additional tools.
Understanding Wireshark's Interface
Before we start capturing packets, it's crucial to know what each part of the Wireshark interface does. This knowledge will help you navigate the tool effectively and find the information you need.
- Menu Bar: Just like in other applications, the menu bar contains typical application menus such as File, Edit, View, etc. You can use these menus to perform common actions like opening a new file, saving a capture, or changing the view settings.
- Main Toolbar: The main toolbar has shortcuts to common functions. These shortcuts make it quicker to perform tasks that you'll use often, like starting or stopping a packet capture.
- Filter Bar: The filter bar is very useful. It allows you to apply display filters to the captured packets. This means you can narrow down the packets you see based on certain criteria, like the source or destination IP address.
- Packet List Pane: This pane shows each captured packet on a separate line. It gives you a quick overview of all the packets that have been captured.
- Packet Details Pane: When you select a packet in the Packet List Pane, the Packet Details Pane shows detailed information about that packet. This includes things like the protocol used, the source and destination addresses, and other relevant data.
- Packet Bytes Pane: This pane shows the raw bytes of the selected packet. It's useful if you want to see the actual data that's being transmitted in the packet.
Now that you understand the basics of the Wireshark interface, you're ready to start capturing some network traffic.
Capturing Network Traffic
In this step, you will learn how to capture network packets, which is the fundamental function of Wireshark. Packet capture is like a detective's tool that allows you to see all the network communication happening on your system. It's essential because it gives you a clear view of what data is flowing in and out of your device, which can be crucial for various purposes such as troubleshooting network issues or analyzing potential security threats.
Starting a Packet Capture
In the Wireshark main interface, you'll notice a list of available network interfaces. These interfaces are like different doors through which your device can connect to the network. Each interface represents a different way your device can send and receive data, such as Wi-Fi, Ethernet, or a virtual network connection. Look for this list to select the appropriate interface for capturing packets.
Select the
eth1interface by clicking on it. This is your main Ethernet connection. Ethernet is a common way to connect devices to a local network using a physical cable. By selectingeth1, you're choosing to capture the network traffic that goes through this specific Ethernet connection.Click on the blue shark fin icon in the toolbar to start capturing packets. This icon is the start button for packet capture in Wireshark. Alternatively, you can double-click on the
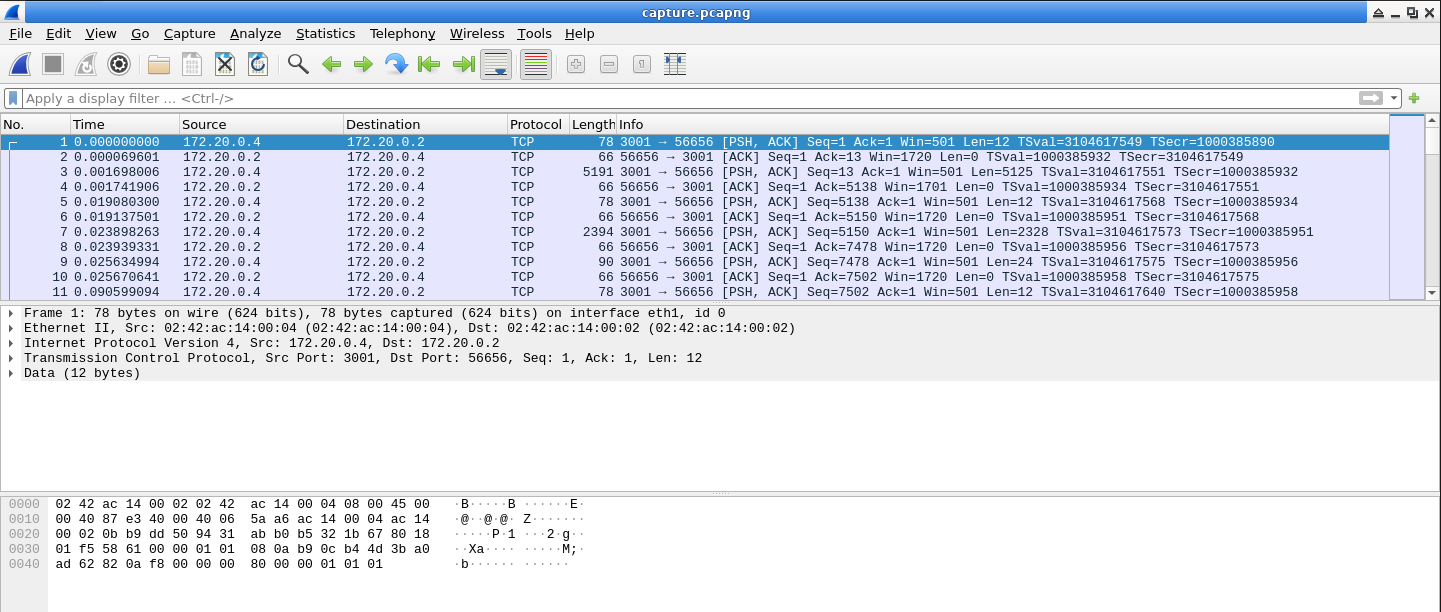
eth1interface. Once you start the capture, Wireshark will begin collecting all the network packets passing through the selected interface.You should now see packets being captured and displayed in real-time. Each line represents a single packet. The packet details include:
- Packet number: This is a unique identifier for each packet, which helps you keep track of the order in which packets are captured.
- Time since the capture started: It shows how much time has passed since you started the packet capture when this particular packet was captured.
- Source address: This is the address of the device that sent the packet. It helps you identify where the data is coming from.
- Destination address: This is the address of the device that the packet is intended for. It shows where the data is going.
- Protocol: The protocol indicates the rules and standards used for the communication. For example, TCP, UDP, or HTTP are common protocols.
- Packet length: It tells you how much data is contained in the packet.
- Information about the packet: This provides more detailed information about the content and purpose of the packet.
Generating Network Traffic
To see more interesting traffic, let's generate some HTTP traffic by visiting a website. HTTP (Hypertext Transfer Protocol) is the protocol used for transferring web pages over the internet. By generating HTTP traffic, you'll be able to see the actual data exchange that happens when you visit a website.
While keeping Wireshark running, open a new terminal by pressing
Ctrl+Alt+T. The terminal is a command-line interface where you can enter commands to interact with your system.Use the
curlcommand to request a web page:curl www.google.comThe
curlcommand is a tool used to transfer data from or to a server. In this case, you're using it to request the web page of Google. You should see the HTML content of Google's homepage in the terminal output. This shows that the request was successful and you've received the data from the Google server.Return to Wireshark and observe the new packets that were captured. You should see DNS, TCP, and HTTP packets related to your request to Google. DNS (Domain Name System) is used to translate domain names like
www.google.cominto IP addresses. TCP (Transmission Control Protocol) is responsible for establishing a reliable connection between your device and the server. HTTP is used to transfer the actual web page data.
Stopping the Capture and Saving the Data
To stop the packet capture, click the red square stop button in the toolbar. This will halt the process of collecting new packets.
Now that you have captured some packets, save them to a file:
- Click on
Filein the menu bar. The menu bar contains various options for managing your Wireshark session, such as opening, saving, and exporting files. - Select
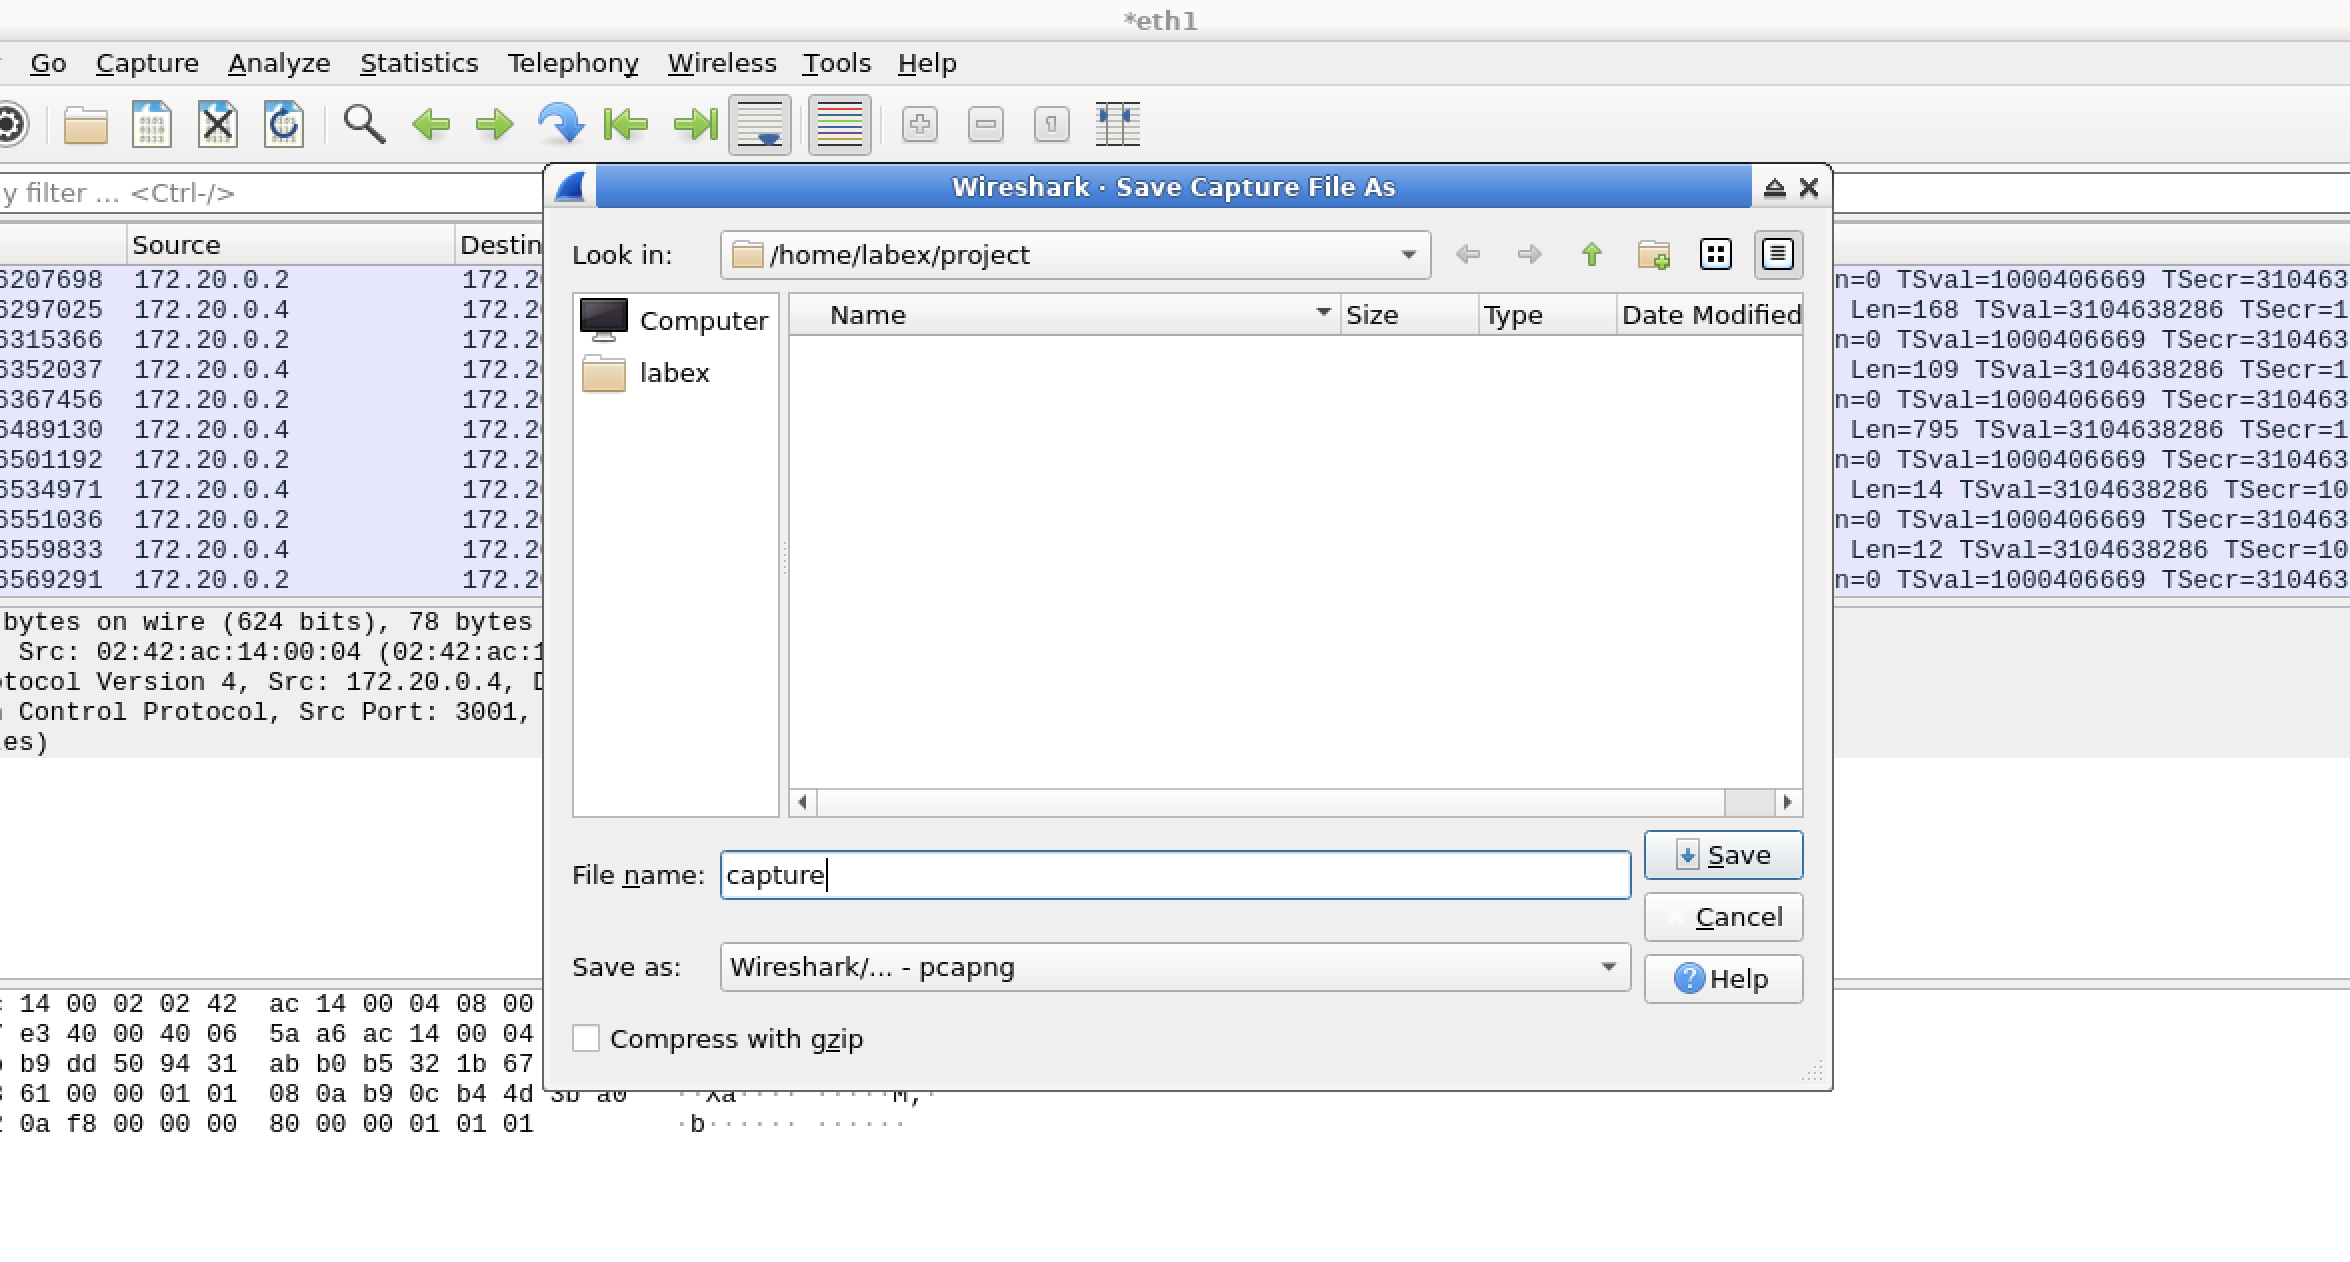
Save As. This option allows you to choose the location and name of the file where you want to save the captured packets. - Navigate to the
/home/labex/projectdirectory. This is the location where you'll store the captured packet data. - Enter
capture.pcapngas the filename. The.pcapngextension indicates that the file is in the PCAPNG format, which is a standard format for storing network packet data. - Click
Save.
- Click on
The file has now been saved. The PCAPNG format preserves all the capture data and is the default format for Wireshark. This means that all the details about the captured packets, such as the source and destination addresses, protocols, and packet contents, are stored in the file.
You have successfully captured network traffic and saved it to a file. In the next step, you will learn how to filter these packets to focus on specific types of traffic.
Filtering Packets
In real-world network scenarios, when you capture network traffic, the capture files can be extremely large, containing thousands or even millions of packets. Analyzing all these packets at once can be overwhelming and inefficient. That's where filtering comes in. Filtering is a crucial technique that allows you to focus on specific types of traffic. By narrowing down the packets you're looking at, you can make the analysis process much more manageable and find the information you need more quickly.
Understanding Display Filters
Wireshark is equipped with a powerful filtering language. This language enables you to display only the packets that meet your specific criteria. Here are some common ways you can use display filters:
- Filter by protocol: You can show packets of a specific protocol, such as HTTP, DNS, or TCP. This is useful when you're interested in a particular type of network communication. For example, if you're investigating web traffic, you might want to focus on HTTP packets.
- Filter by IP address: You can show packets that are either sent from or received by specific IP addresses. This helps you track the communication between particular devices on the network.
- Filter by content: You can show packets that contain specific content. This is handy when you're looking for certain keywords or data within the packets.
- Combine conditions: You can use logical operators to combine multiple conditions. This allows you to create more complex and precise filters.
Applying Basic Filters
First, open your capture file in Wireshark. Once the file is open, look at the top of the Wireshark window. You'll see a text field with a blue background. This is the filter box. The filter box is where you'll enter your filter criteria.
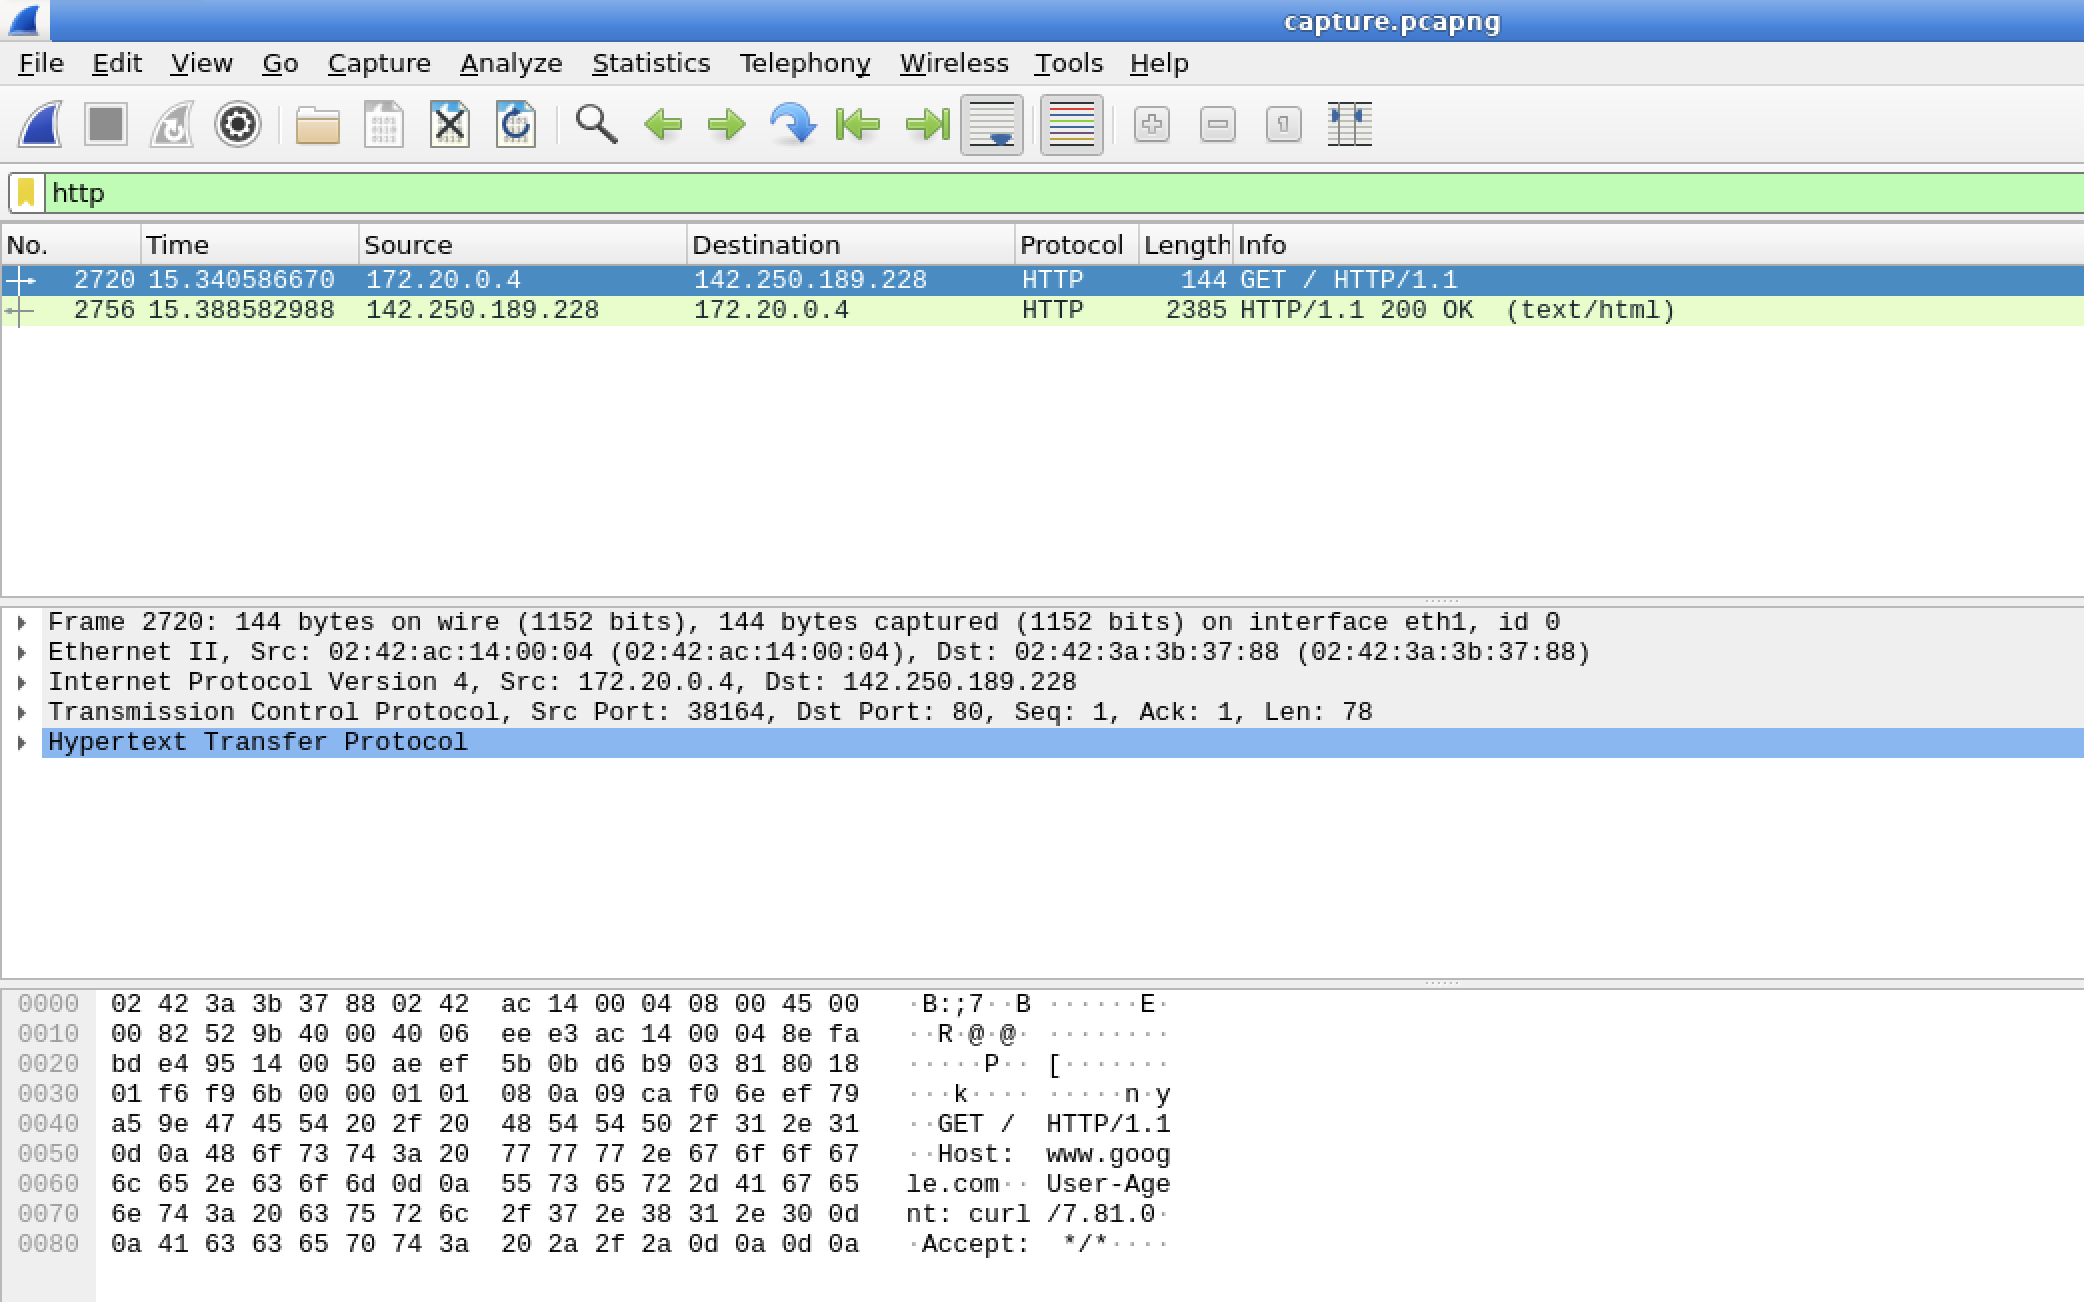
Suppose you want to filter for HTTP traffic. HTTP is the protocol used for web communication. To do this, simply type the following in the filter box:
httpAfter typing the filter, you have two options to apply it. You can either press the Enter key on your keyboard or click on the right arrow button next to the filter box. Once you do this, Wireshark will start applying the filter to the packet list.
After applying the filter, you should now see only HTTP packets in the packet list. However, if you don't see any packets, it's possible that your capture file doesn't contain any HTTP traffic. In that case, you can try using the filter
tcpinstead. TCP is a fundamental transport layer protocol, and using this filter will show all TCP packets in the capture file.If you want to clear the filter and see all the packets again, there are two ways to do it. You can click the "X" button on the right side of the filter box, or you can delete the filter text in the box and then press the Enter key.
Using Advanced Filters
Let's explore more specific filters to further refine your packet analysis.
Suppose you're interested in only HTTP GET requests. A GET request is a common type of HTTP request used to retrieve data from a server. To show only these requests, enter the following filter in the filter box:
http.request.method == "GET"Press the Enter key to apply the filter. Wireshark will then search through the packet list and display only the HTTP GET requests.
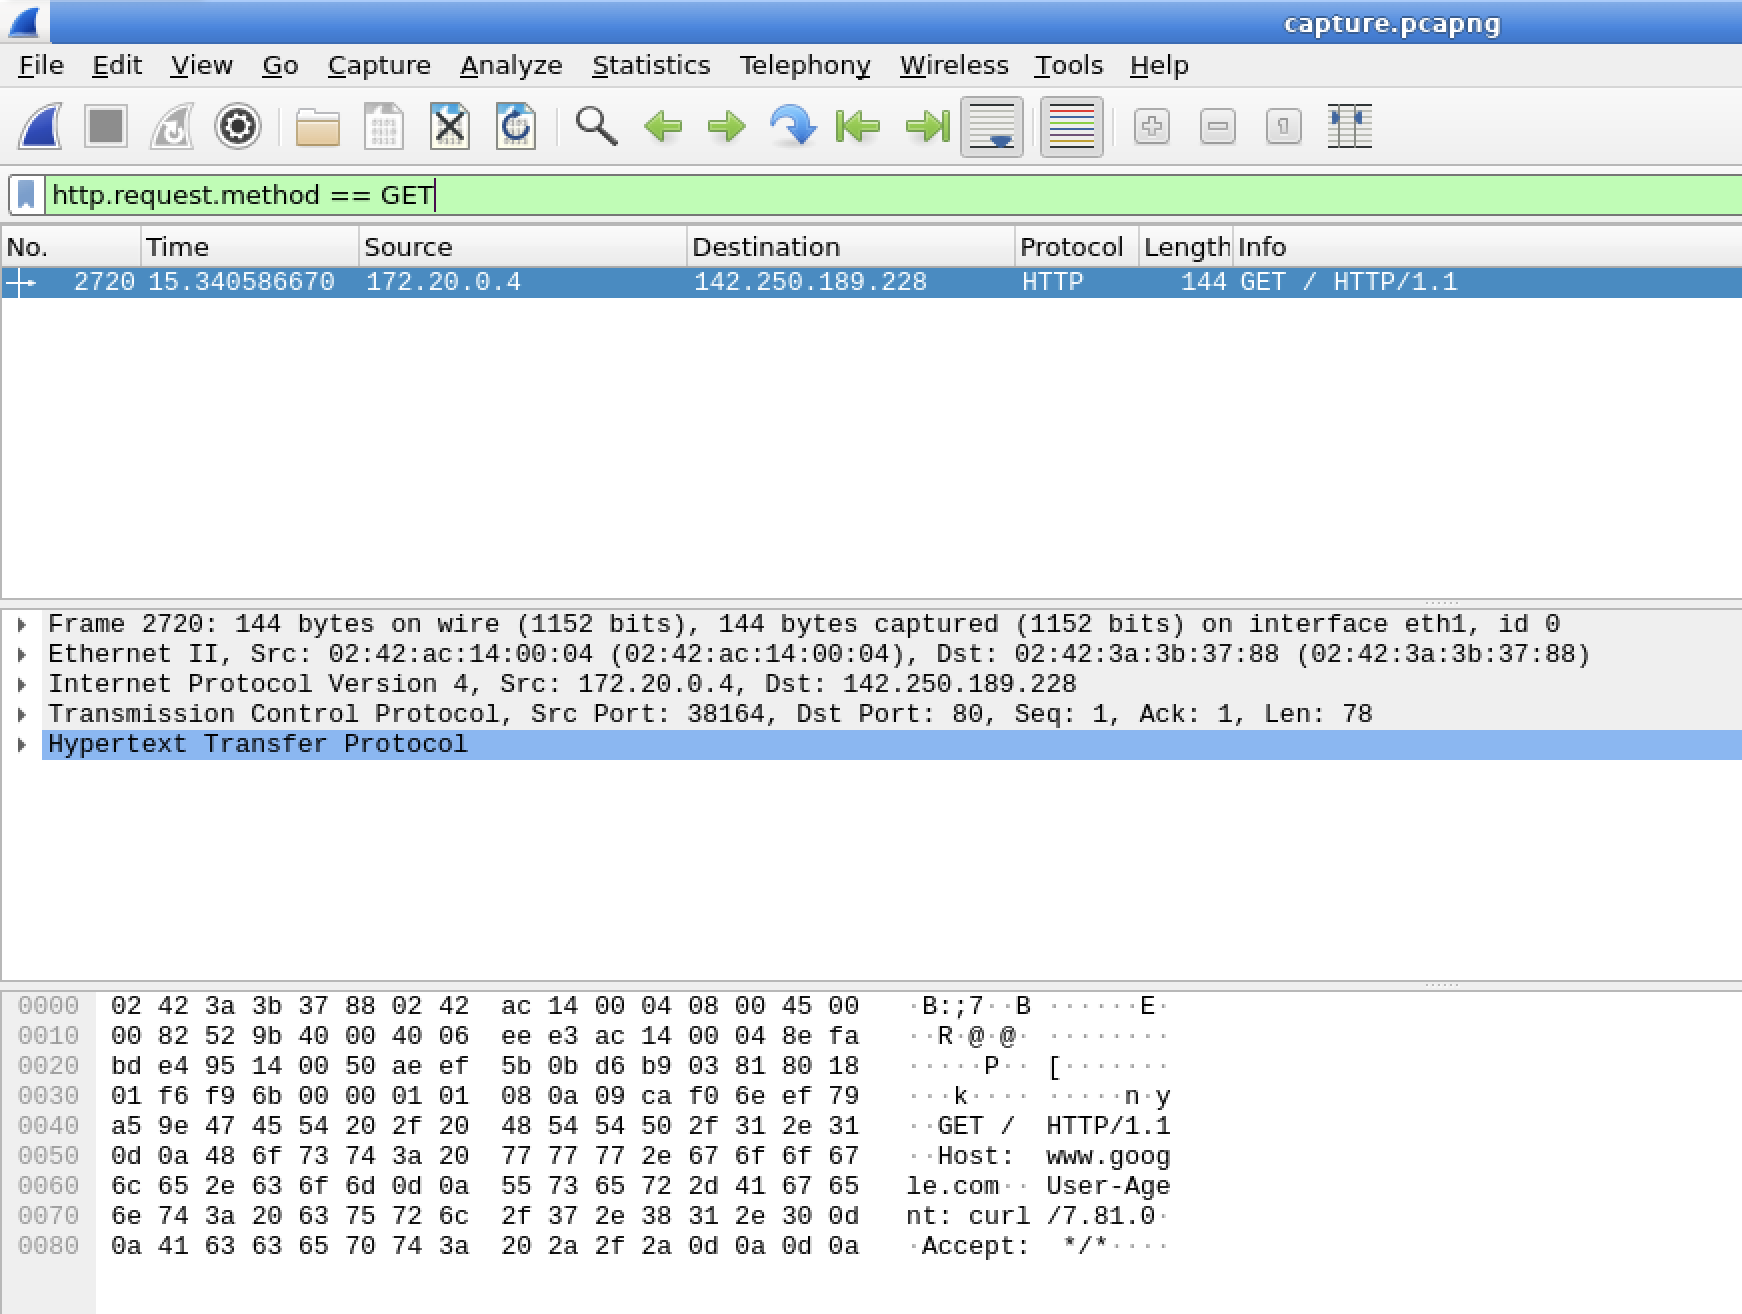
After applying the filter, if you don't see any packets, it means your capture file might not contain any HTTP GET requests.
Now, let's try another filter. If you want to see all TCP packets that are destined for port 80 (which is the standard port for HTTP), enter the following filter in the filter box:
tcp.dstport == 80Press the Enter key to apply this filter.
After applying the filter, you should now see all TCP packets that are sent to port 80 in the packet list.
Combining Filters
You can make your filters even more powerful by combining multiple filters using logical operators.
Suppose you want to see packets that are either HTTP or DNS. DNS is the protocol used for translating domain names into IP addresses. To create a filter for this, enter the following in the filter box:
http or dnsPress the Enter key to apply the filter.
After applying the filter, you should now see both HTTP and DNS packets in the packet list.
Filtering is a powerful feature in Wireshark that allows you to focus on the packets that are most relevant to your analysis. As you gain more experience with Wireshark, you'll be able to create more sophisticated filters that are tailored to your specific needs.
Exporting Packets
After you've captured and filtered packets, it's common to need to export them. Exporting packets allows for further in - depth analysis, creating documentation, or sharing the data with other people. Wireshark provides several export formats, and each format is designed for different use - cases.
Understanding Export Formats
Wireshark supports multiple export formats. Here's a brief explanation of each:
- PCAP/PCAPNG: This is the native format for packet capture files. It preserves all the data exactly as it was captured, making it ideal for storing and re - using packet data.
- CSV (Comma - Separated Values): This format is great for importing the packet data into spreadsheets or databases. It organizes the data in a tabular form, which is easy to analyze using common data analysis tools.
- TXT (Plain Text): A human - readable format. It's useful for creating documentation as it presents the packet information in a simple text form that anyone can understand.
- XML: A structured format. It can be easily processed by scripts or other tools, which makes it suitable for automated analysis.
- PSML/PDML: These are special Wireshark formats. PSML is used for packet summaries, while PDML provides detailed packet information.
Exporting Specific Packets
Let's start by exporting some packets from your capture.
First, you need to clear any filters you've applied. To do this, click the "X" button in the filter box. When you clear the filters, all the captured packets will be displayed. This step is important because it gives you a full view of all the packets you've captured, allowing you to select the ones you want to export.
Next, select the packets you want to export. You can do this by clicking on the first packet. Then, hold the Shift key and click on another packet. This will select all the packets in between. If you want to select all the packets, simply press
Ctrl+A.Once you've selected the packets, click on
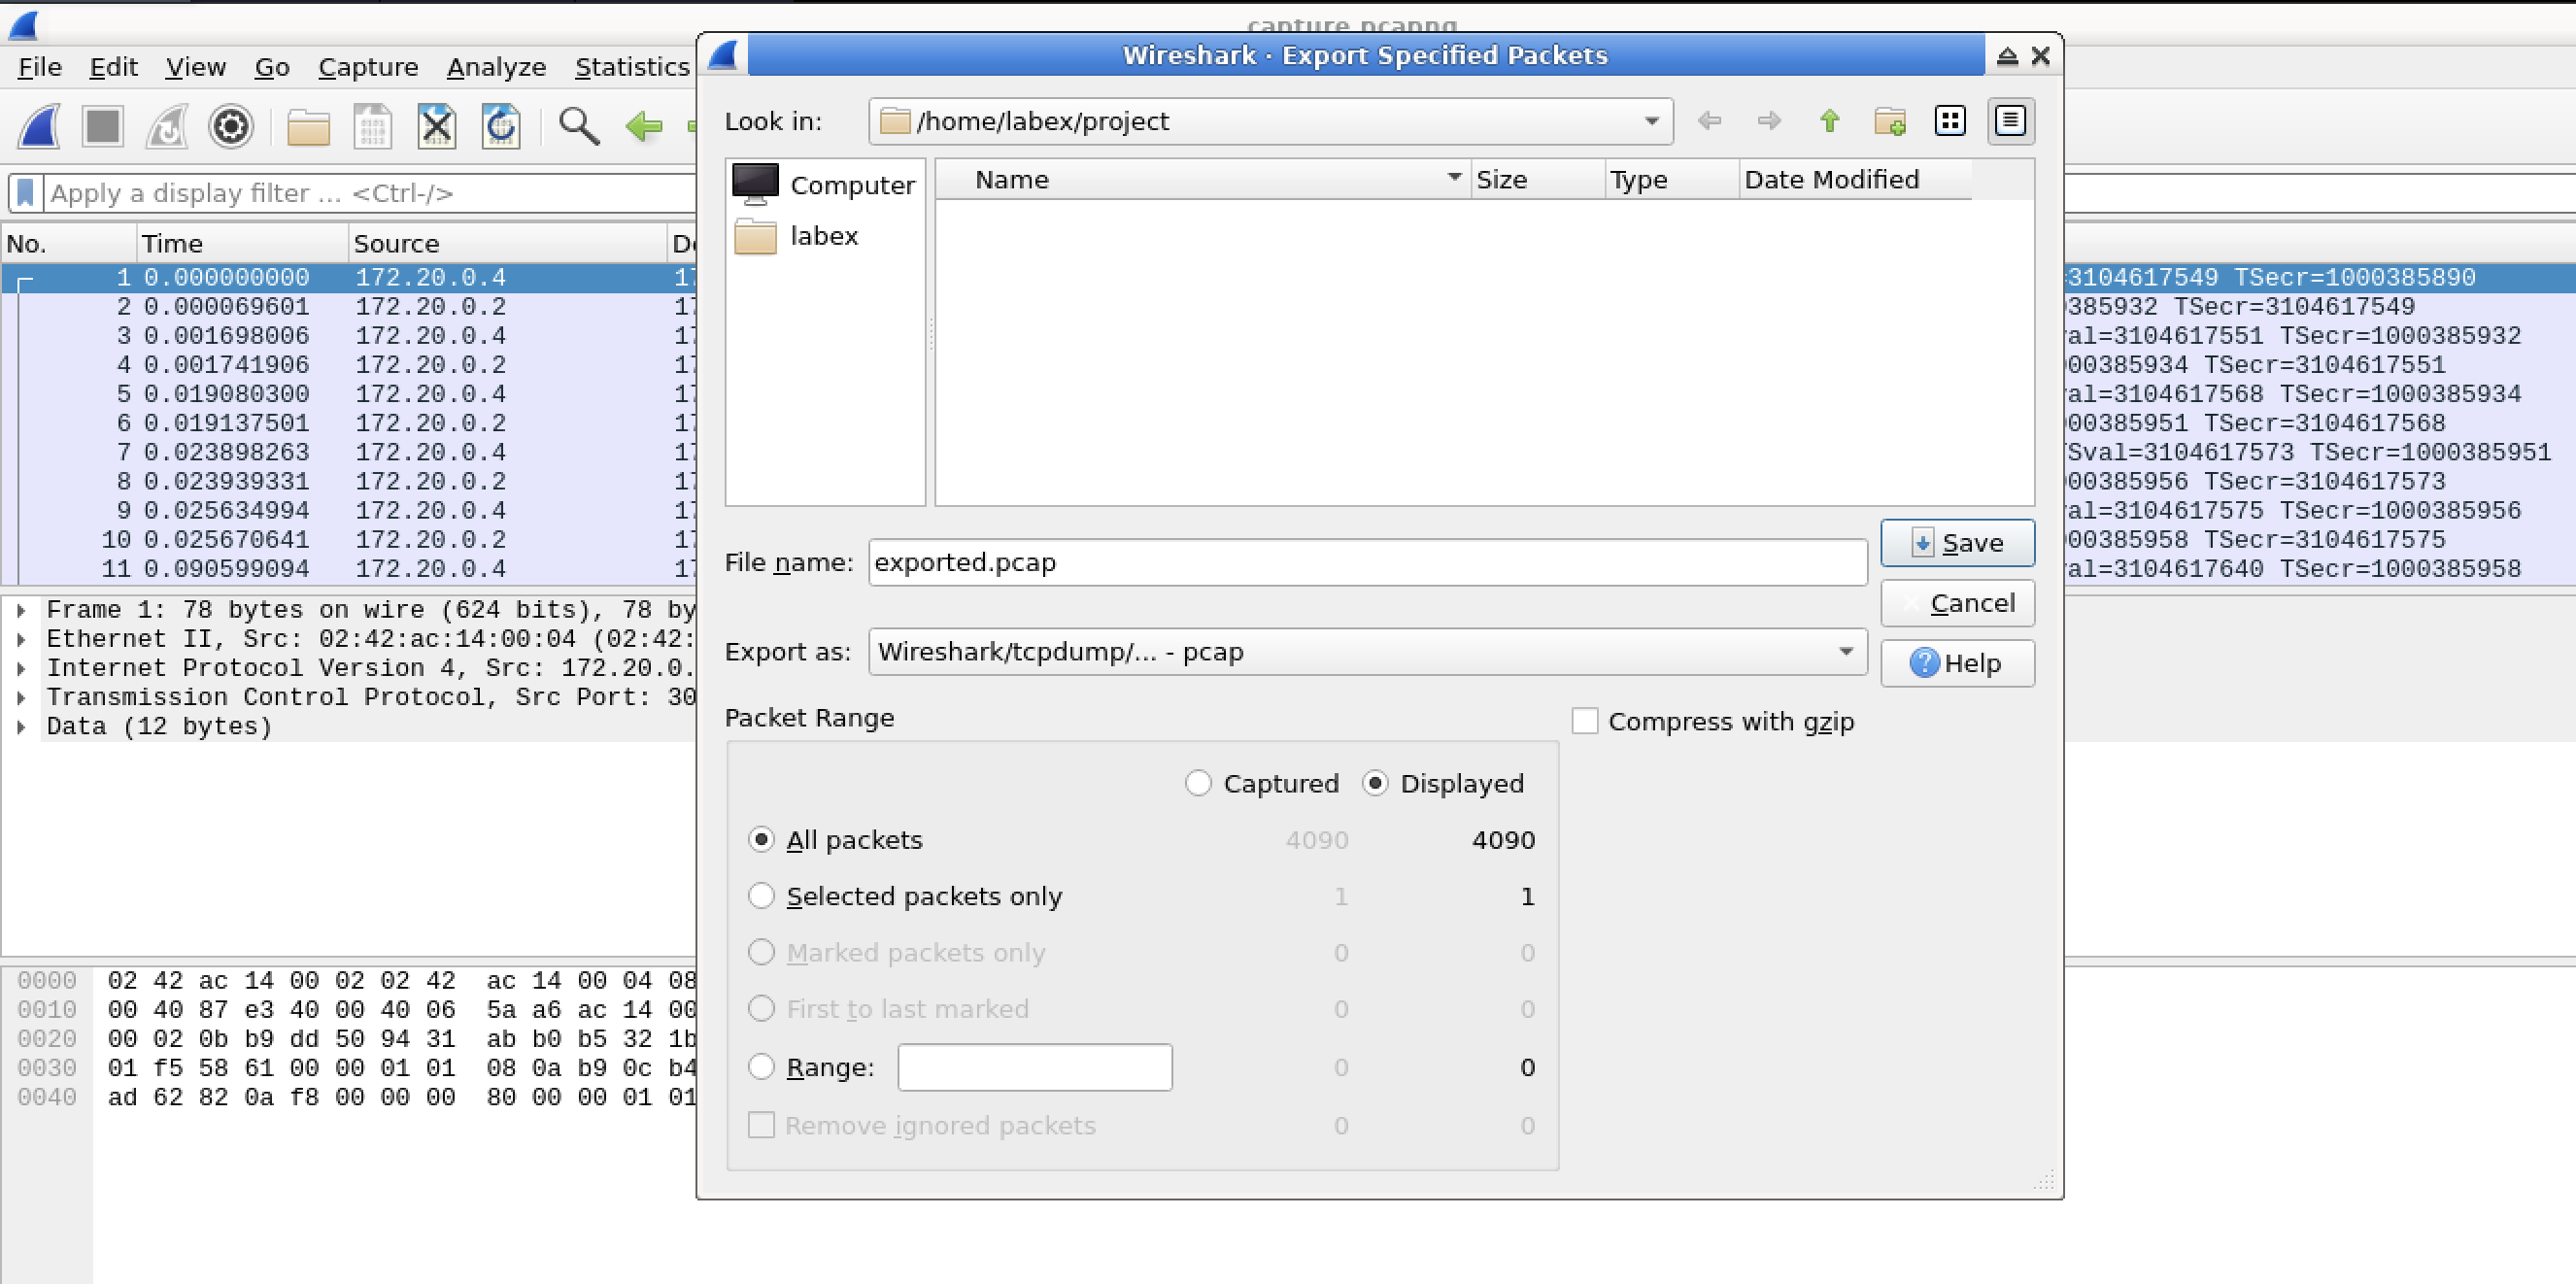
Filein the menu bar. Then, selectExport Specified Packets.... This option allows you to save the selected packets in a specific format.In the export dialog that appears:
- Navigate to the
/home/labex/projectdirectory. This is where you'll save the exported file. - Check the "Save as type" dropdown. If
Wireshark/tcpdump/... - pcapisn't already selected, select it. The PCAP format is a widely - used format for packet data. - Enter
exported.pcapas the filename. This will name your exported file. - If you didn't select all the packets, make sure "Selected packets only" is selected. This ensures that only the packets you've chosen are exported.
- Finally, click
Save.
- Navigate to the
You've now successfully exported the selected packets to a PCAP file. This file can be opened in any tool that supports the PCAP format, not just Wireshark. This gives you the flexibility to use different tools for further analysis.
Exporting in CSV Format
Now, let's export the same data in CSV format. The CSV format is very useful for analysis in spreadsheet applications.
Make sure your packets are still selected. If not, press
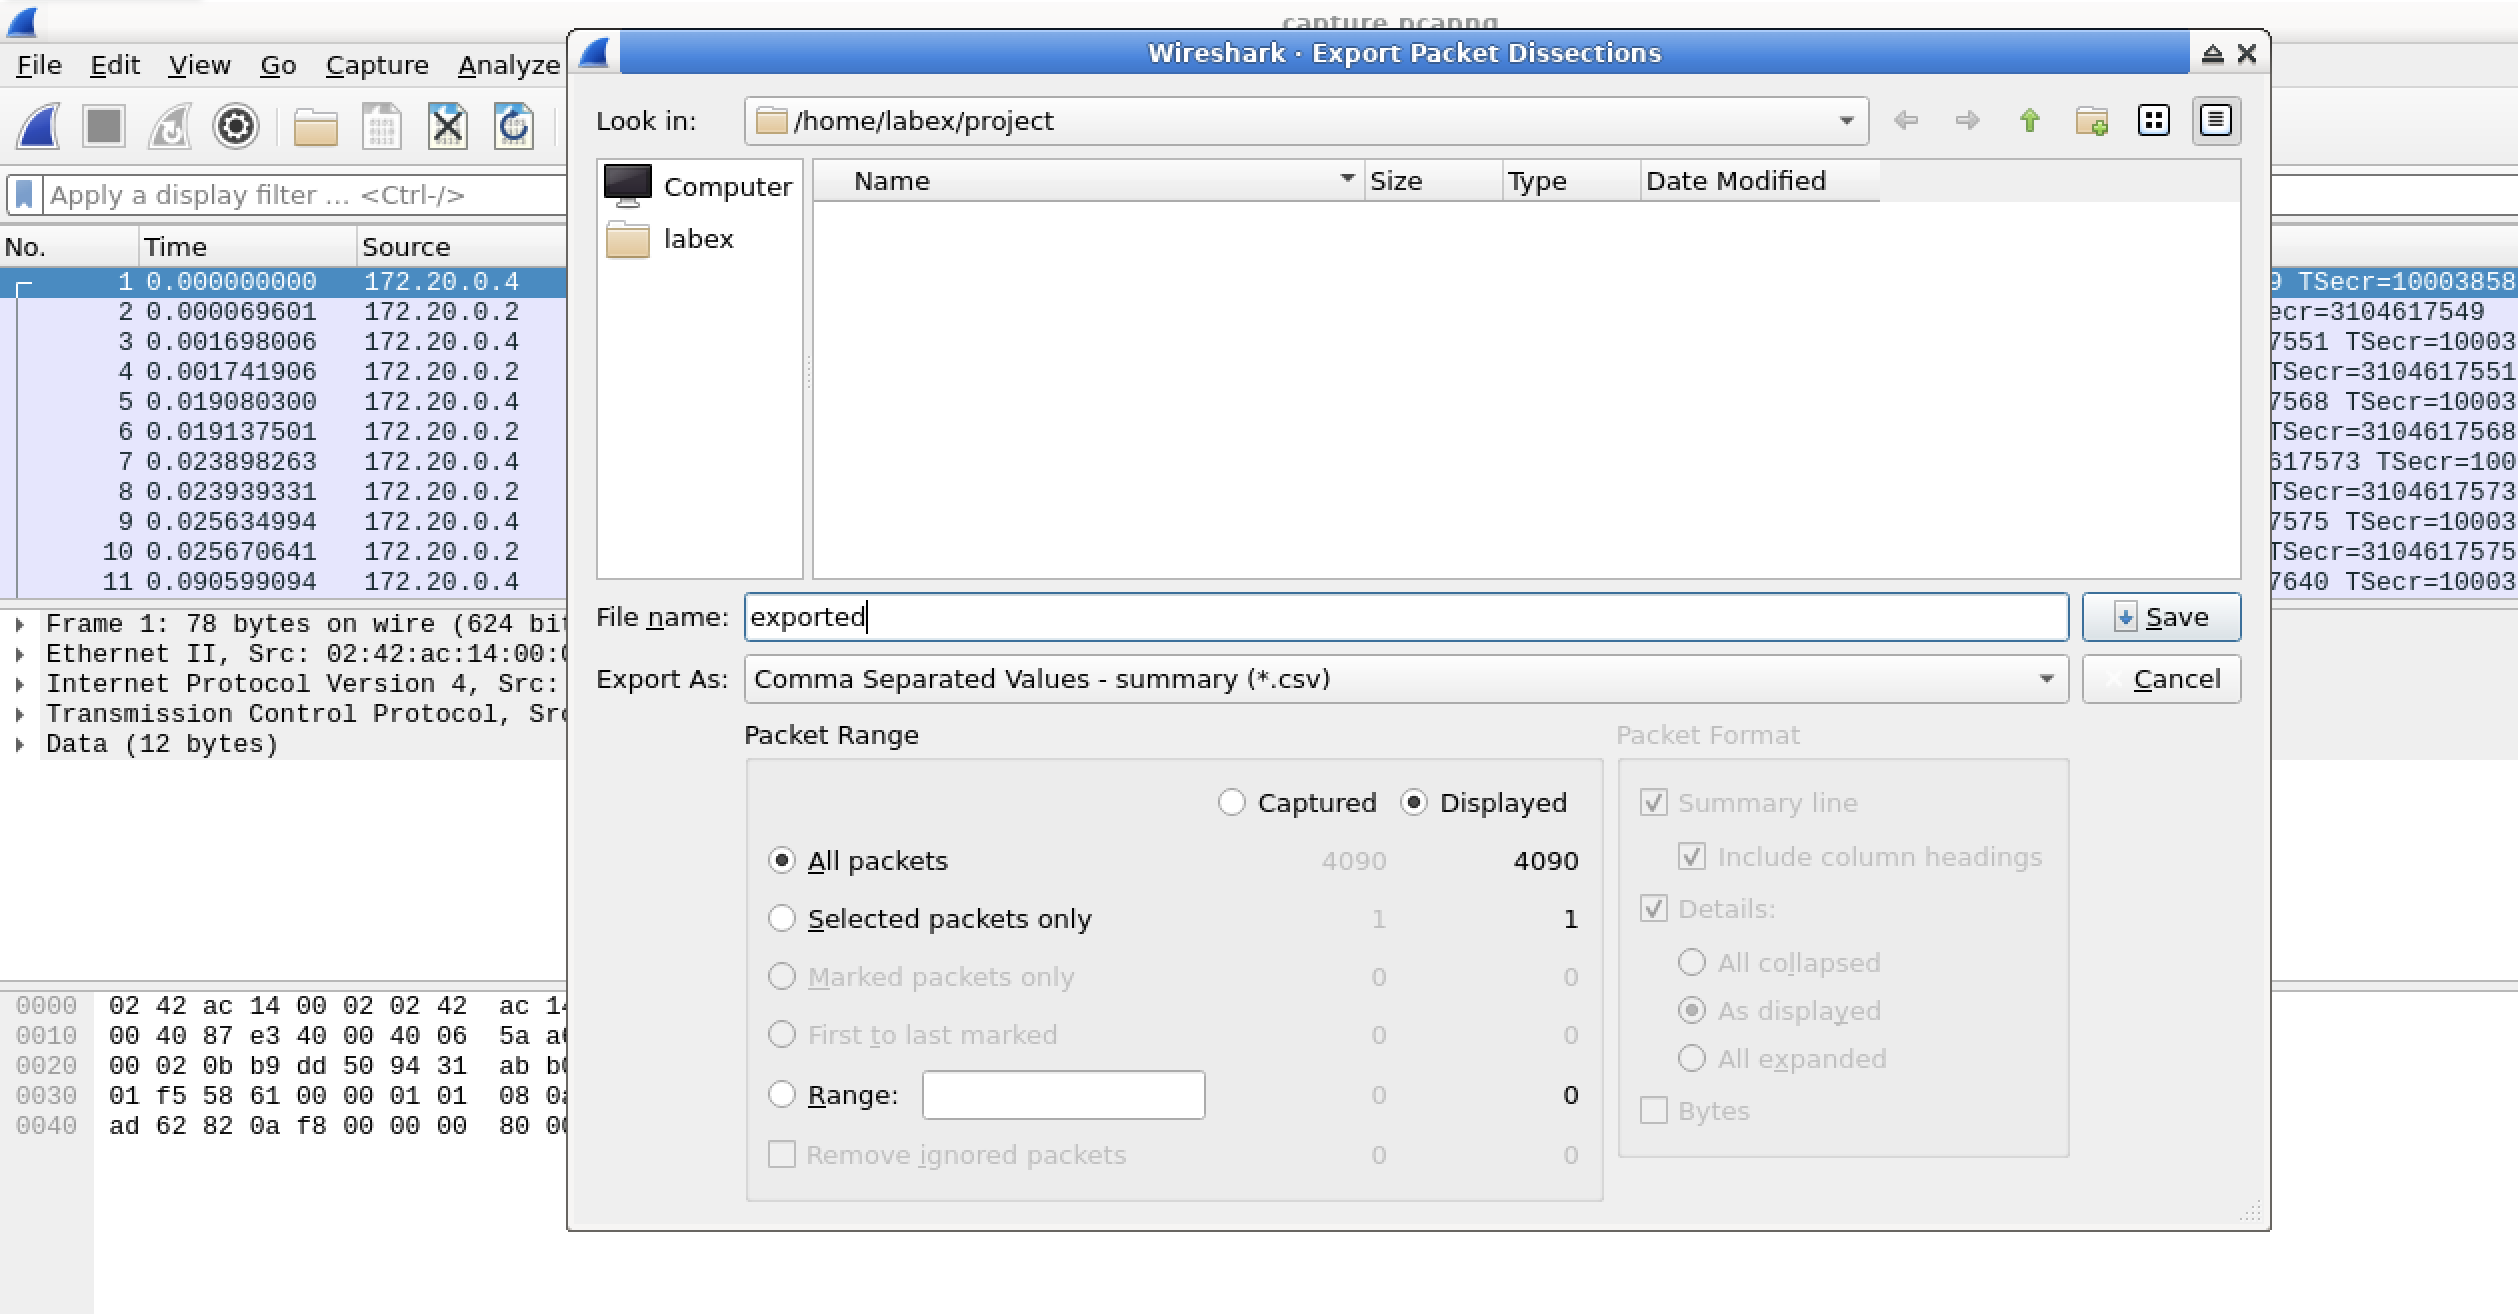
Ctrl+Ato select all packets again. Then, click onFilein the menu bar and selectExport Packet Dissections.... This option allows you to export the packet data in different formats.Click on the
As CSV...button. This will set the export format to CSV.In the export dialog:
- Navigate to the
/home/labex/projectdirectory to save the file. - Enter
exported.csvas the filename. - Click
Save.
- Navigate to the
You've now exported the packet data to a CSV file. To view the contents of this file, you can use the following command in a terminal:
head -n 10 /home/labex/project/exported.csvThis command will display the first 10 lines of the CSV file. It shows you the column headers and some packet data, giving you a quick overview of what's in the file.
Exporting Packet Bytes
Sometimes, you might need to export the actual raw bytes of a packet. Here's how you can do it:
Select a single packet in the packet list. This is the packet whose raw bytes you want to export.
Right - click on the packet and select
Export Packet Bytes.... This option allows you to save the raw data of the packet.In the export dialog:
- Navigate to the
/home/labex/projectdirectory. - Enter
packet_bytes.binas the filename. - Click
Save.
- Navigate to the
You've now exported the raw bytes of the selected packet. This can be very useful for detailed analysis or for extracting files that are embedded in packets.
These export options give you a lot of flexibility in how you analyze and share your packet capture data. The format you choose depends on your specific needs and the tools you plan to use for further analysis.
Summary
In this lab, you have learned how to use Wireshark, a powerful network protocol analyzer, to capture, filter, and export network packets. First, you familiarized yourself with the Wireshark interface and captured live network traffic. Then, you learned to apply filters to target specific traffic types, like HTTP requests or TCP communications. Finally, you explored different ways to export packets in formats such as PCAP and CSV for further analysis or sharing.
These skills are essential for network administrators, security analysts, and IT professionals. They enable efficient troubleshooting of network issues, investigation of security incidents, and understanding of network behavior. Mastering Wireshark's packet export capabilities provides a valuable tool for cybersecurity and network analysis, laying a foundation for more advanced techniques applicable in real - world IT and security roles.

