Introduction
In this lab, you will learn about the Wireshark interface and its components, which are crucial for network traffic analysis and troubleshooting. You'll explore the different parts of the Wireshark GUI, understand their functions, and gain hands - on experience in customizing the interface.
By the end of this lab, you will be familiar with the basic layout of Wireshark and well - prepared to start analyzing network traffic.
Launching Wireshark
In this step, we're going to launch Wireshark and get you acquainted with its initial interface. Wireshark is a very useful tool in the field of network analysis. It's a powerful network protocol analyzer, which means it can capture and examine the data traffic flowing through your network. This is crucial for understanding how different devices on your network communicate, detecting potential security threats, and troubleshooting network issues.
Launching Wireshark from the Terminal
First, we'll learn how to start Wireshark using the terminal. The terminal is a text - based interface that allows you to interact with your computer by typing commands.
- Make sure you are in the Desktop environment of your LabEx VM. The Virtual Machine (VM) is like a separate computer running inside your actual computer, and the desktop environment is the graphical interface where you can see icons and windows.
- Open a terminal. You can do this in two ways. You can click on the terminal icon in the taskbar, which is usually at the bottom or top of your screen. Or, you can use a keyboard shortcut: press
Ctrl+Alt+Tsimultaneously. - Once the terminal is open, you need to type a command to start Wireshark. In the terminal, type the following command and then press Enter:
wireshark
This command tells the computer to start the Wireshark program.
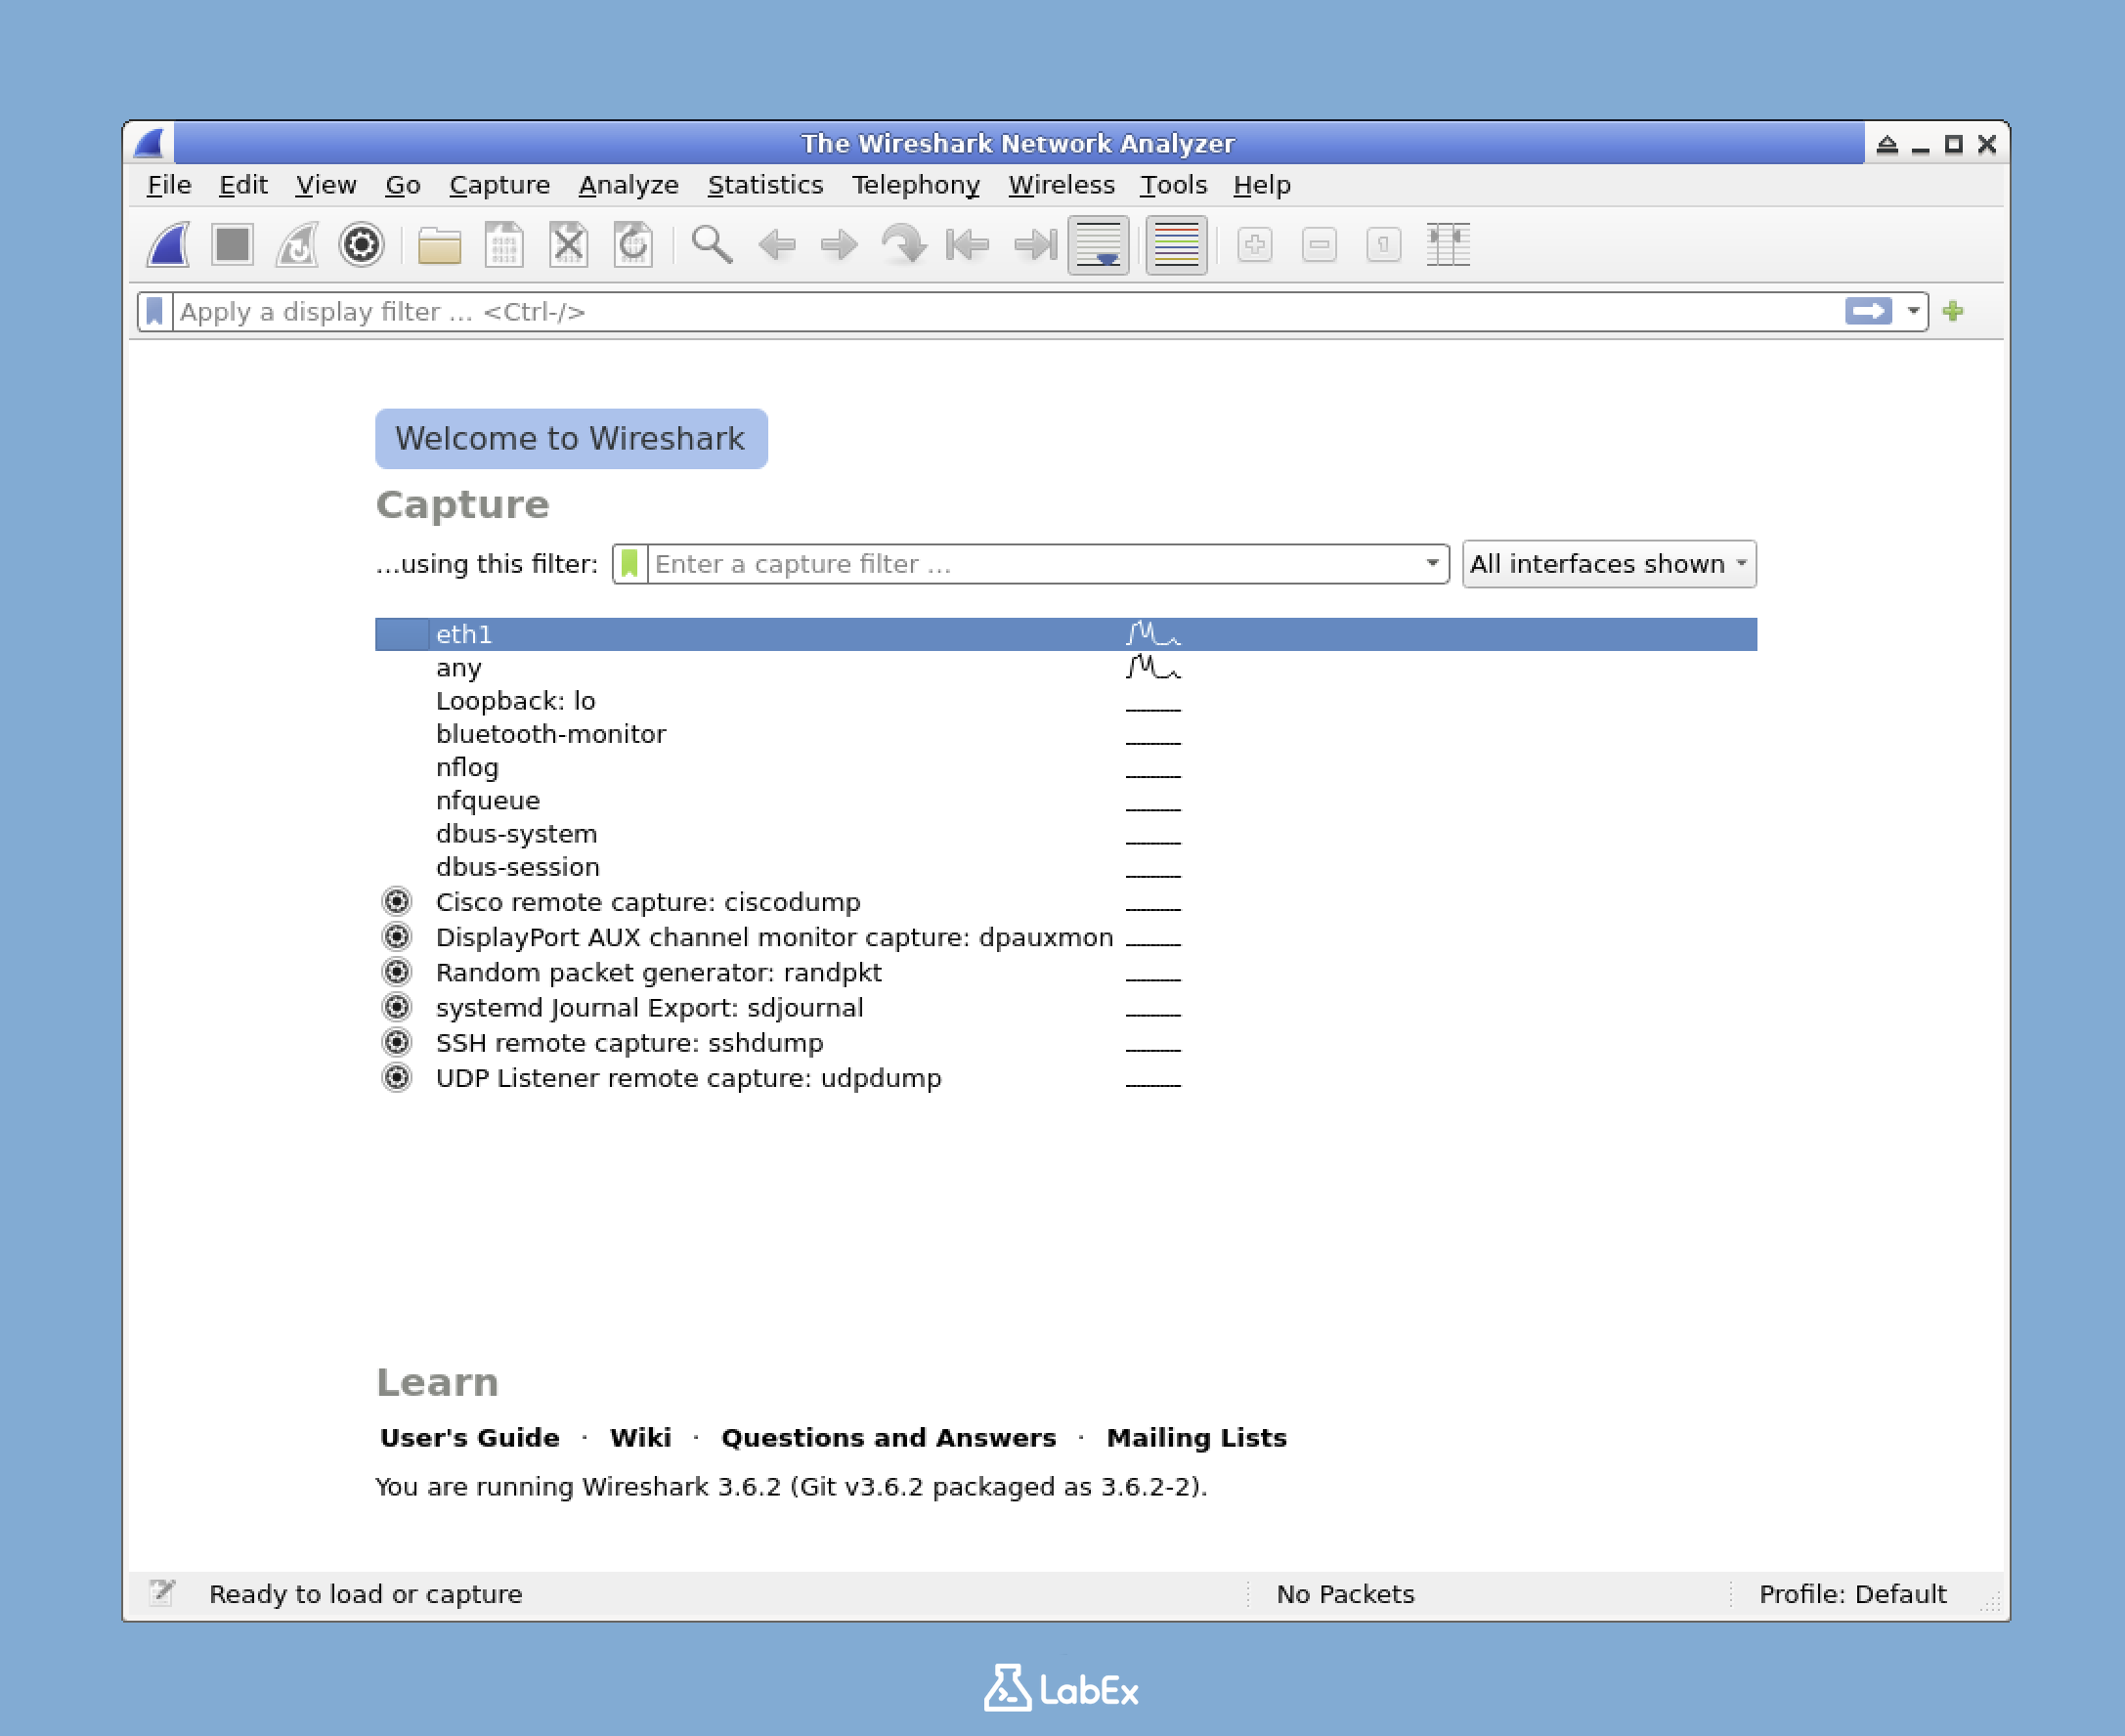
- After you press Enter, you need to wait a few seconds for Wireshark to start up. Once it's ready, you should see the main Wireshark window appear on your screen, as shown below:
Understanding the Initial Screen
When Wireshark first opens, there are several important elements on the screen that you should be aware of.
- There is a welcome screen that provides some basic information about Wireshark. This can give you an overview of what the tool can do.
- You'll see a list of available network interfaces. Network interfaces are like doors through which your computer connects to a network. You can choose one of these interfaces to capture the traffic that is going in and out of your computer.
- There might be a list of recent capture files. If you've used Wireshark before and saved some capture files, you can open them here to review the previously captured network traffic.
- There are also display filter and capture filter entry fields. Filters are used to focus on specific types of network traffic. For example, you can use a filter to only show traffic from a certain IP address.
Take a moment to look at this initial screen. This is the starting point where you'll usually select a network interface to start capturing traffic or open a previously saved capture file.
Identifying the Main Areas of the Interface
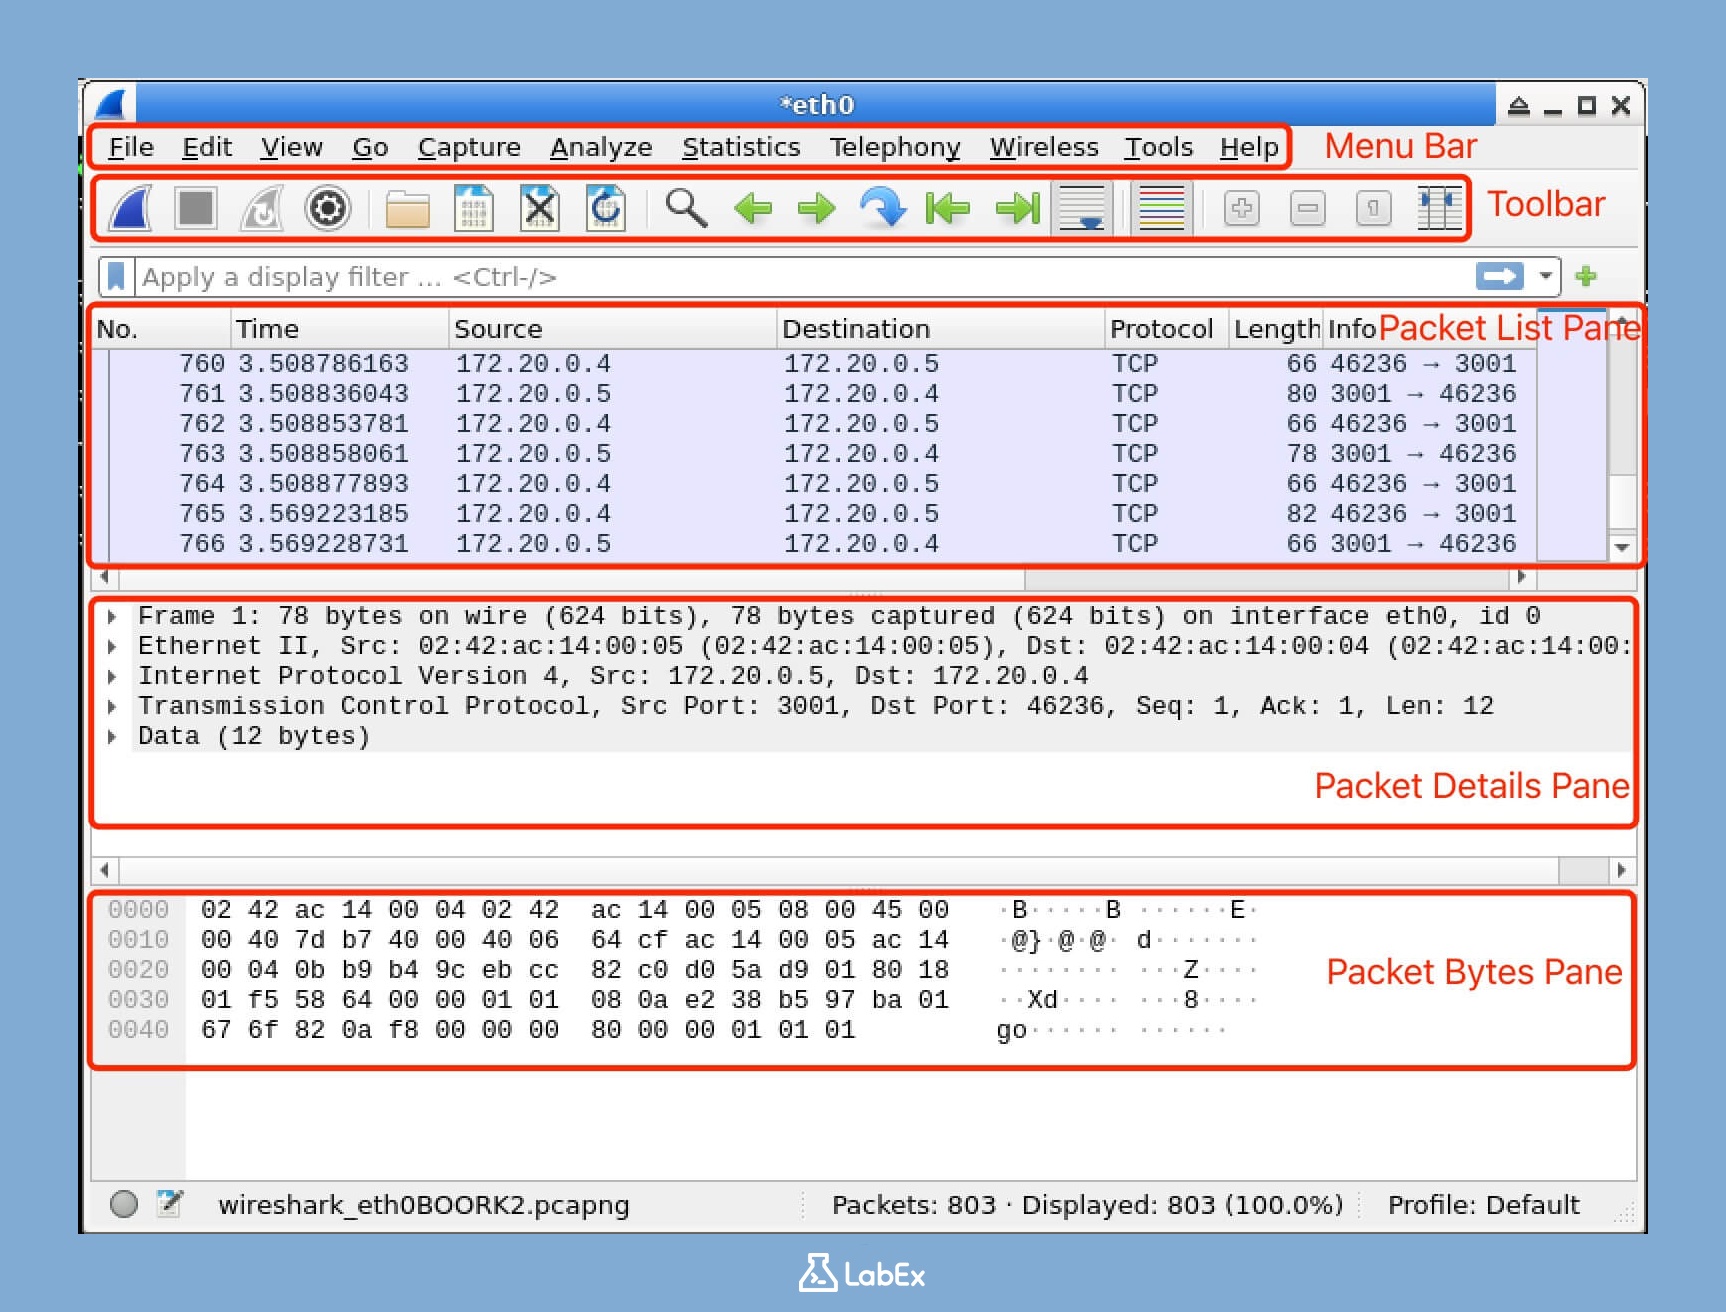
Even before you start capturing network traffic, you can identify the main areas of the Wireshark interface. These areas are important because they provide different functions and controls for using Wireshark effectively.
- At the very top of the window, there is the Menu Bar. It contains options like File, Edit, View, etc. You can use these options to perform various actions such as saving a capture file, changing the view settings, or editing preferences.
- Below the menu bar, there is the Toolbar. It has buttons for common actions. For example, there might be a button to start or stop a capture, or to save a file quickly.
- The Filter Bar is where you can enter display filters. As mentioned earlier, filters help you focus on specific types of traffic. You can type in a filter expression here to show only the traffic that meets your criteria.
- The main content area is currently showing the welcome screen. Later, when you start a capture, this area will display the captured network traffic.
In the next step, we will explore these components in more detail.
Exploring the Wireshark Interface
In this step, we're going to take a detailed look at the different parts of the Wireshark interface. Wireshark is a powerful tool for network traffic analysis, and understanding its components is essential for effectively examining network data. By getting familiar with these elements, you'll be better equipped to analyze network traffic and troubleshoot issues.
Starting a Sample Capture
To make it easier to explore the Wireshark interface, we'll start by capturing some sample network traffic. Here's how you can do it:
- Open the Wireshark main window. In this window, you'll see a list of network interfaces. These interfaces are like doors through which your computer connects to different networks. For example,
eth0might be your Ethernet network connection, andlois the loopback interface. The loopback interface is a special network interface that allows a computer to communicate with itself.
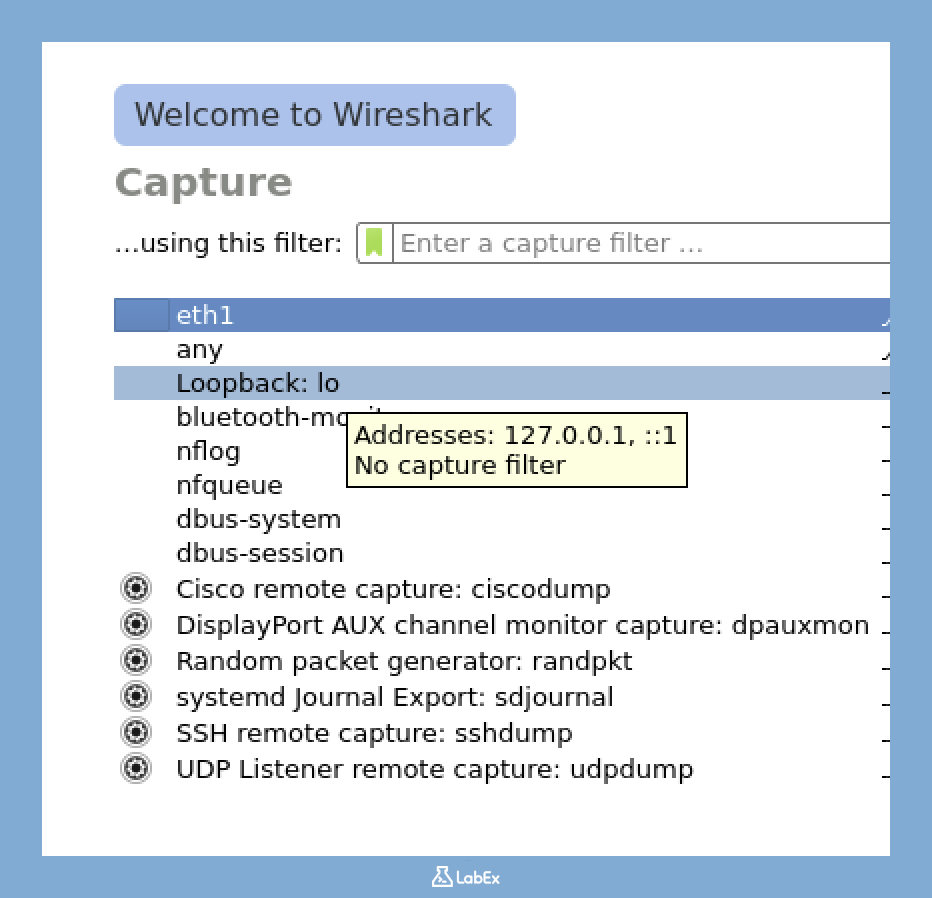
Find the interface named
loin the list and click on it. When you click onlo, Wireshark will start capturing all the network traffic that goes through your local loopback interface. This is a great way to start because it's a simple and controlled environment.After a few seconds, look at the Wireshark toolbar. You'll see a red square icon, which is the Stop button. Click on it to stop the traffic capture.
Once you've stopped the capture, you should see a list of captured packets in the Wireshark window. These packets will help us explore the different components of the Wireshark interface.
Main Interface Components
The Wireshark interface is divided into several important areas. Each area has a specific function and provides different types of information about the captured network traffic.
1. Menu Bar
At the very top of the Wireshark window, you'll find the menu bar. The menu bar contains various menus, each with a set of related commands. Here's what each menu does:
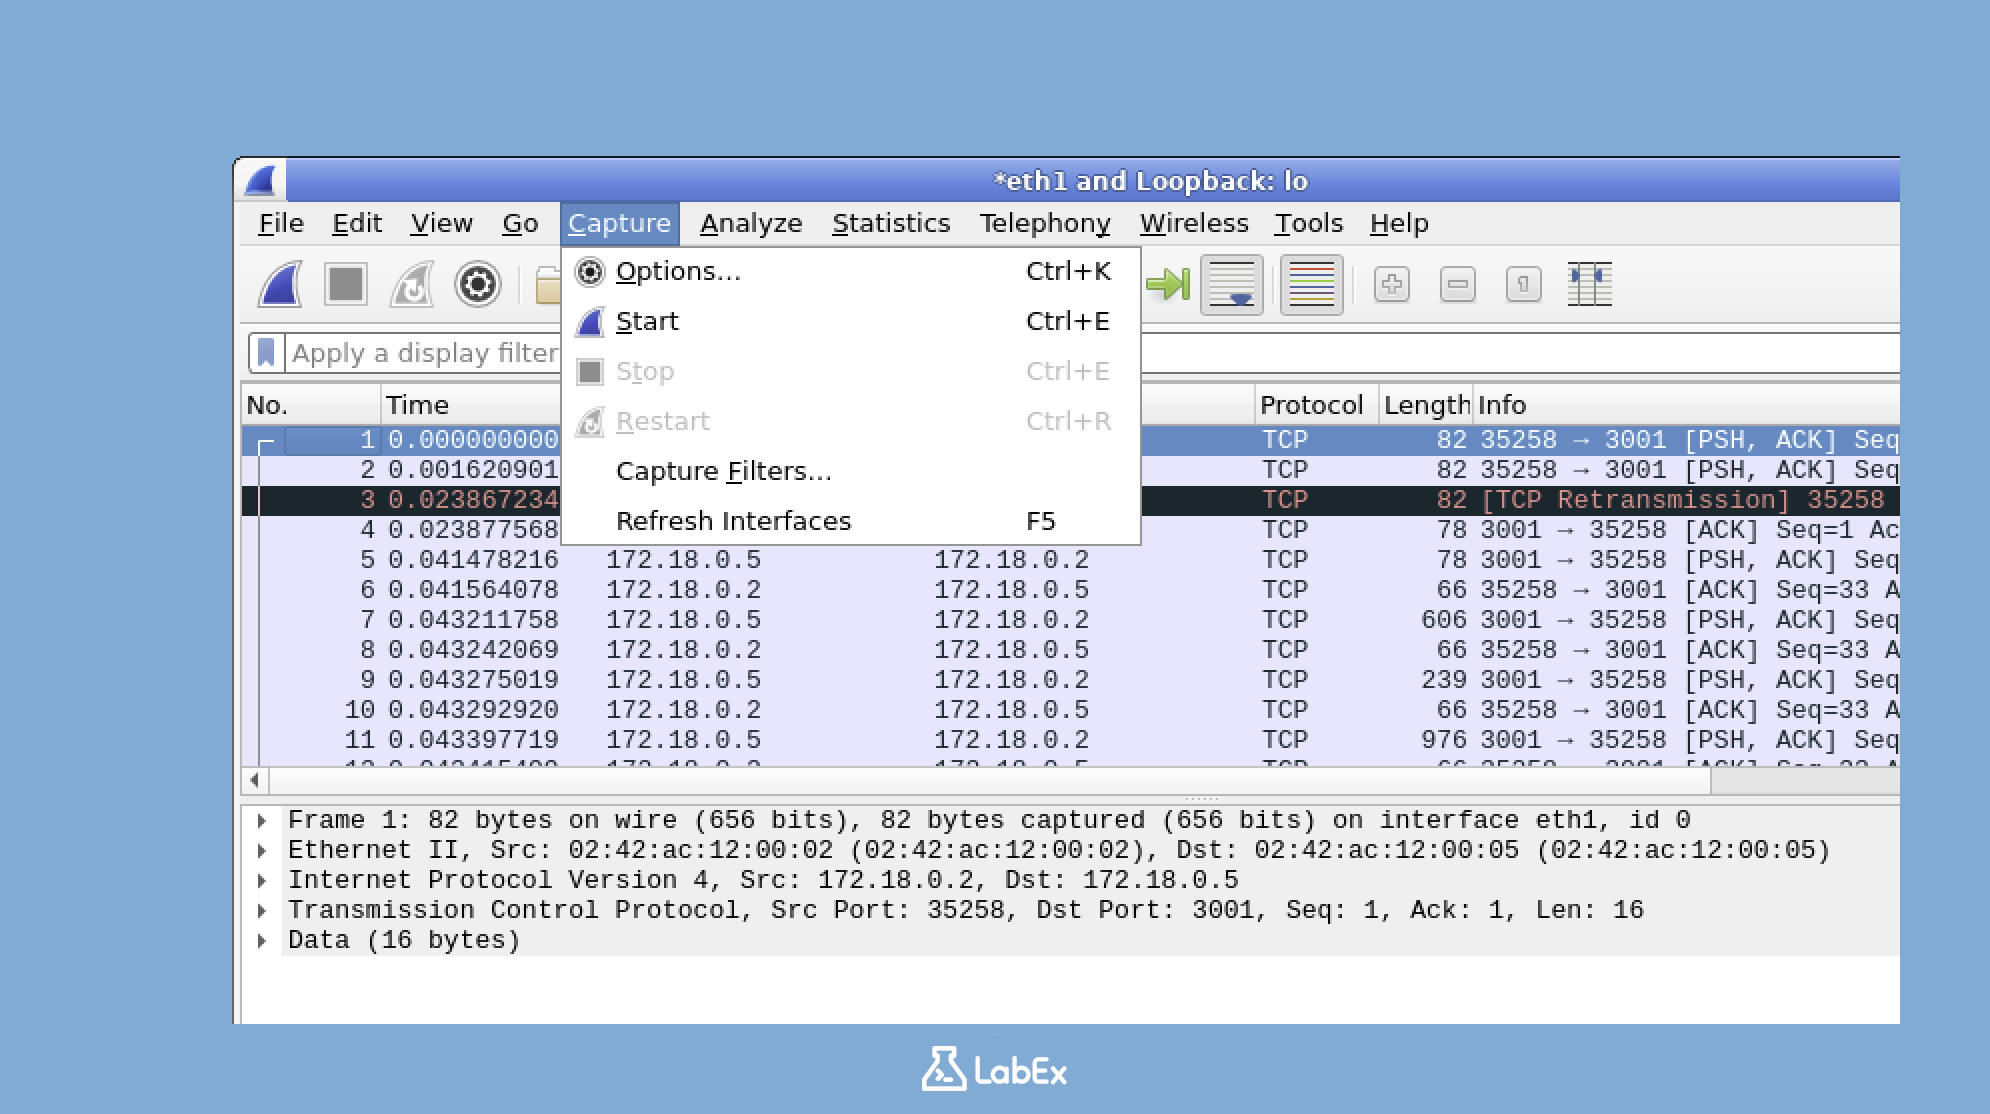
- File: This menu is used for basic file operations. You can use it to open existing capture files, save the current capture, or export the captured data in different formats.
- Edit: The Edit menu has commands for copying data from the captured packets, finding specific information within the packets, and setting your personal preferences for how Wireshark behaves.
- View: This menu allows you to control how the packets and interface elements are displayed. You can change the layout, font size, and other visual aspects of the Wireshark window.
- Capture: The Capture menu provides options for starting, stopping, and configuring the traffic capture process. You can set filters, choose which network interfaces to capture from, and more.
- Analyze: This menu contains tools for in - depth analysis of the packet data. You can use these tools to look for patterns, detect anomalies, and understand the behavior of the network traffic.
- Statistics: The Statistics menu offers various statistical tools. These tools can help you understand the overall characteristics of the captured traffic, such as the number of packets sent and received, the distribution of protocols, and more.
- Telephony: If you're working with VoIP (Voice over Internet Protocol) or other telephony - related network traffic, the Telephony menu has analysis tools specifically designed for these types of protocols.
- Wireless: For wireless network analysis, the Wireless menu provides tools that are tailored to the unique characteristics of wireless networks, such as signal strength, channel usage, and more.
- Help: The Help menu contains documentation and assistance resources. If you're stuck or need more information about how to use a particular feature in Wireshark, this is where you can find answers.
2. Toolbar
The toolbar is located just below the menu bar. It provides quick access to some of the most commonly used functions in Wireshark.
When you move your mouse over the toolbar, you'll see a tooltip with the name of the button.
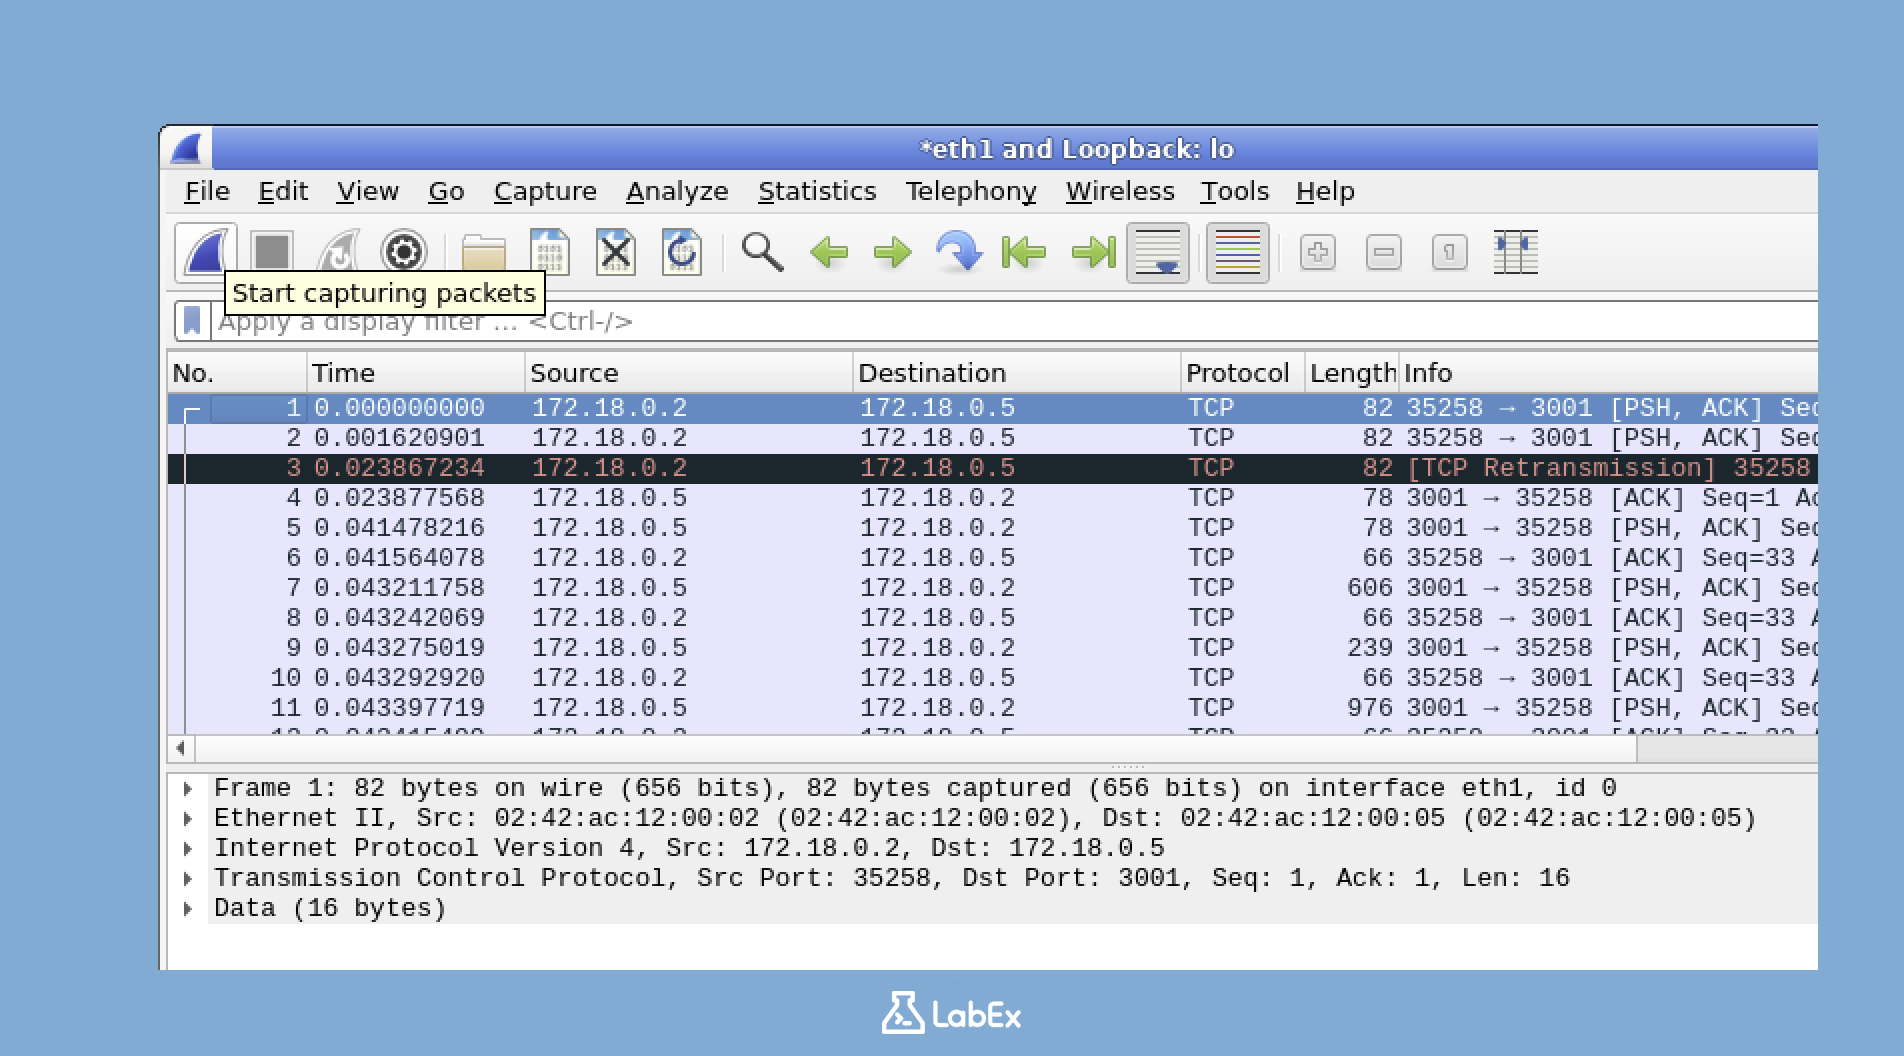
Here's what each group of buttons on the toolbar does:
- Start/Stop Capture: These buttons allow you to easily start and stop the traffic capture process without having to go through the Capture menu.
- Open/Save: The Open and Save buttons are shortcuts for the file operations in the File menu. You can use them to quickly open an existing capture file or save the current capture.
- Zoom (+/-): The Zoom tools let you zoom in and out of the packet view. This is useful when you want to get a closer look at a particular packet or see more packets at once.
- Go To: The Go To buttons are used for navigation. You can use them to quickly move between different packets in the captured list.
- Colorize: The Colorize controls allow you to change the coloring of the packets in the packet list. Coloring can help you quickly identify different types of packets based on their characteristics.
3. Packet List Pane
The Packet List Pane is one of the most important parts of the Wireshark interface. It displays a list of all the captured packets, along with some important summary information about each packet. Here's what each column in the Packet List Pane means:
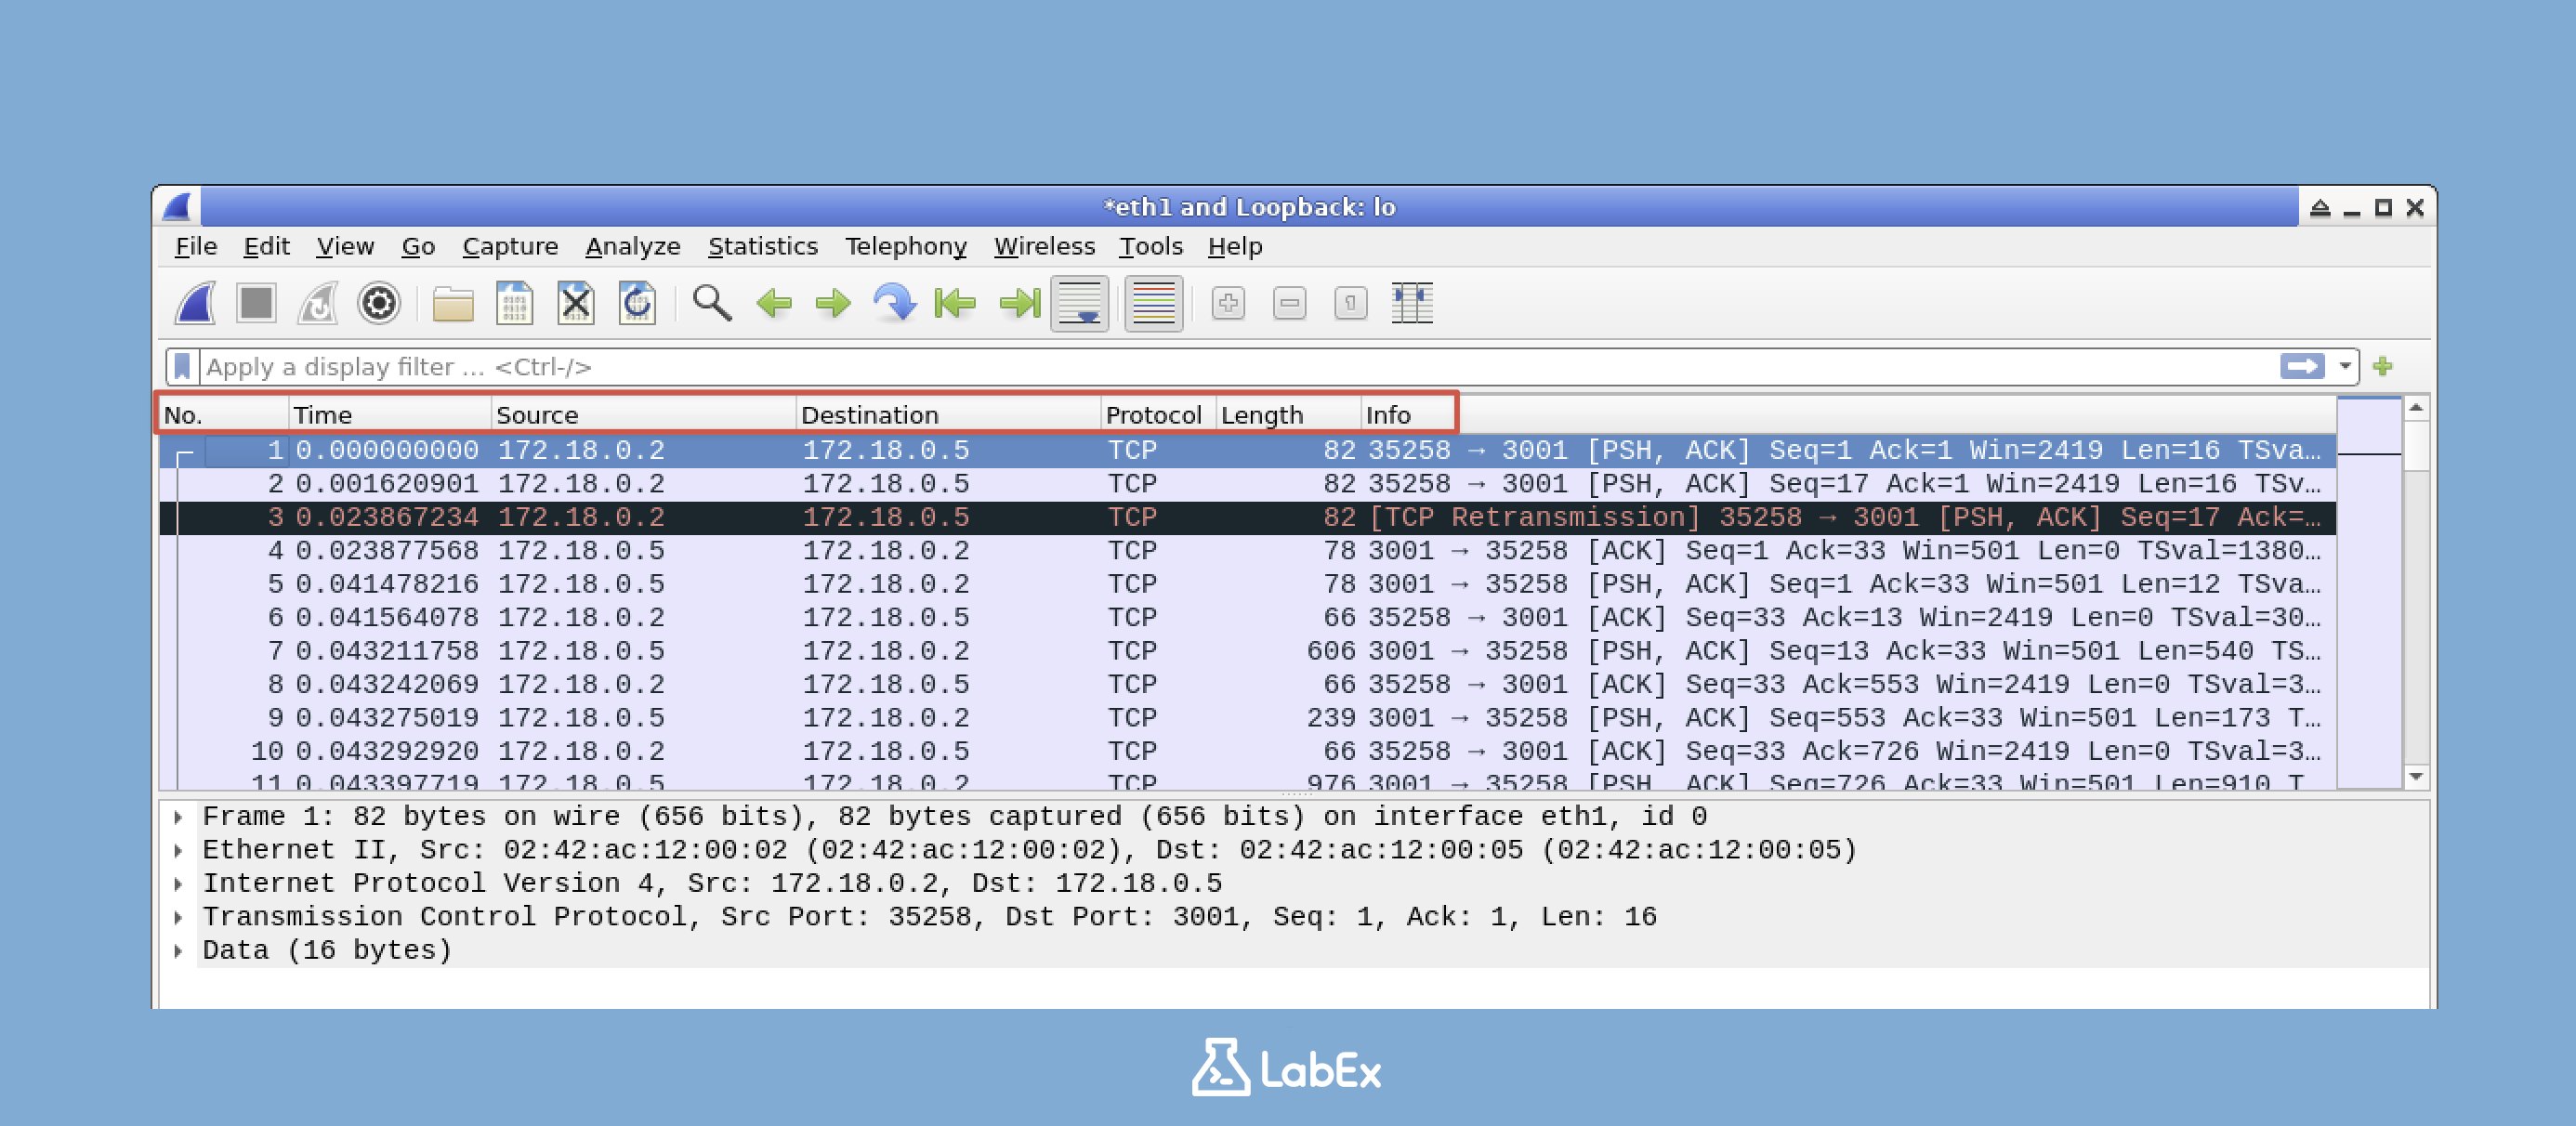
- No.: This is the packet number in the capture. It's a sequential number that helps you keep track of the order in which the packets were captured.
- Time: The Time column shows the timestamp of when the packet was captured. This can be useful for understanding the timing of network events.
- Source: The Source column displays the IP address of the device that sent the packet. This helps you identify where the network traffic is coming from.
- Destination: The Destination column shows the IP address of the device that the packet is intended for. It tells you where the network traffic is going.
- Protocol: The Protocol column indicates the highest layer protocol detected in the packet. For example, it could be TCP (Transmission Control Protocol), UDP (User Datagram Protocol), or HTTP (Hypertext Transfer Protocol).
- Length: The Length column shows the length of the packet in bytes. This can give you an idea of the size of the data being transmitted.
- Info: The Info column provides a summary of the packet contents. It gives you a quick overview of what the packet is doing, such as a request for a web page or a response from a server.
To see more detailed information about a specific packet, click on it in the Packet List Pane. When you do this, the other panes in the Wireshark interface will update to show details about the selected packet.
4. Packet Details Pane
The Packet Details Pane shows detailed information about the selected packet in a hierarchical format. When you click on a packet in the Packet List Pane, this pane will display all the information about that packet, broken down by protocol layers.
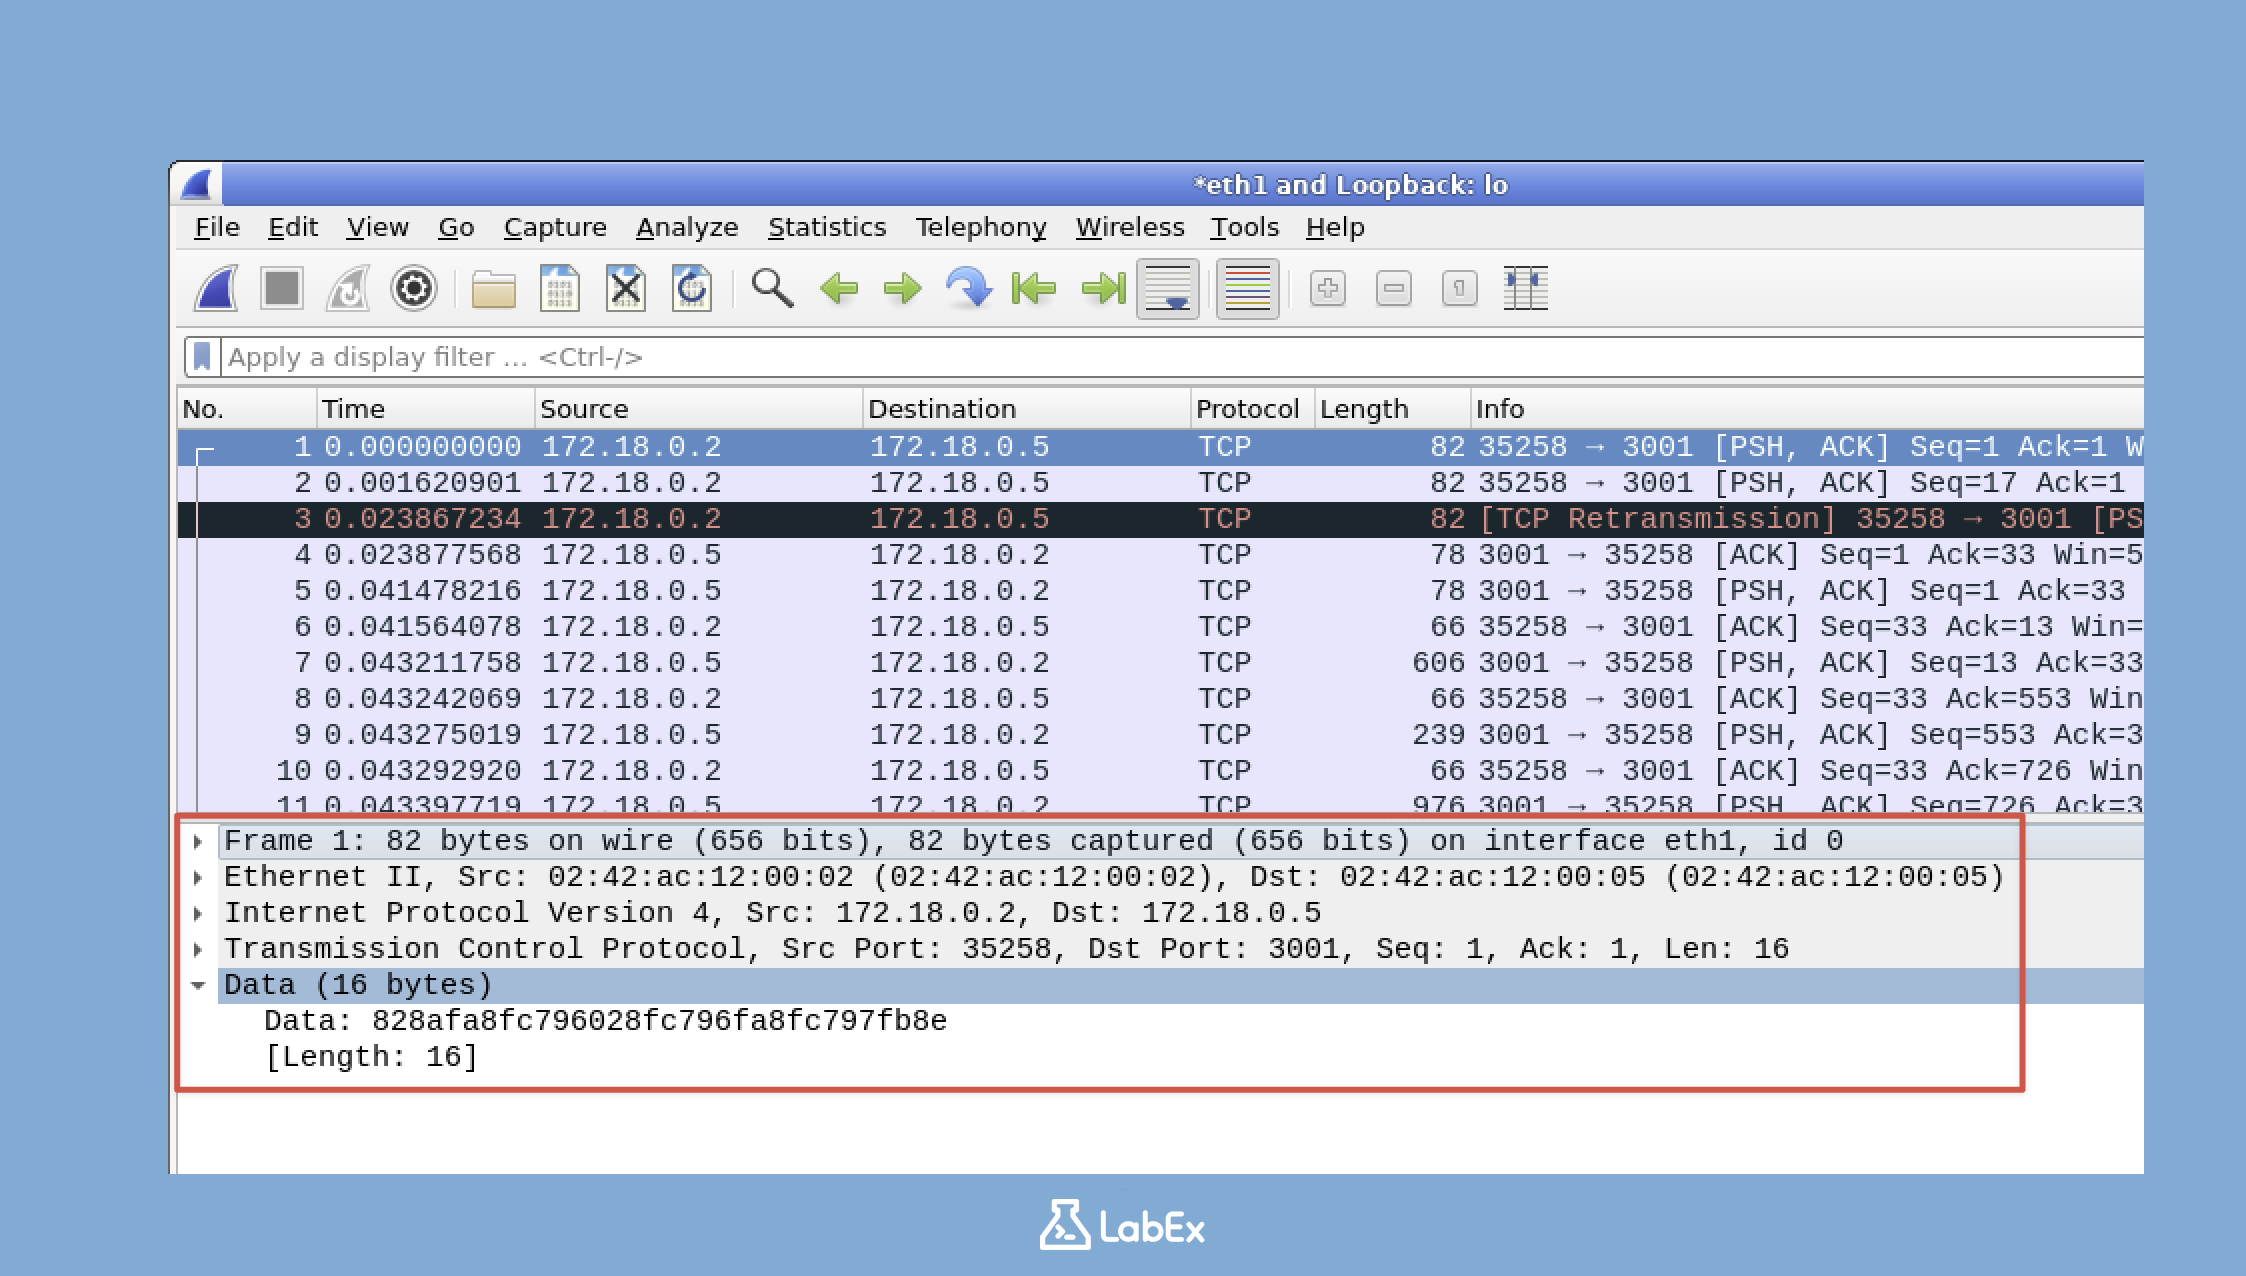
- The packet is divided into different protocol layers, such as the Frame layer, Ethernet layer, IP layer, TCP layer, and so on. Each layer represents a different part of the network communication process.
- Next to each layer, there's an arrow. You can click on this arrow to expand or collapse the layer. When you expand a layer, you'll see all the fields and values within that layer, which provide specific information about the packet.
Try clicking on the arrows next to different protocol layers to see how you can drill down into the specific details of a packet. This is a great way to understand how network protocols work and how data is transmitted over the network.
5. Packet Bytes Pane
The Packet Bytes Pane displays the raw bytes of the selected packet in both hexadecimal and ASCII format. This pane gives you a low - level view of the packet data.
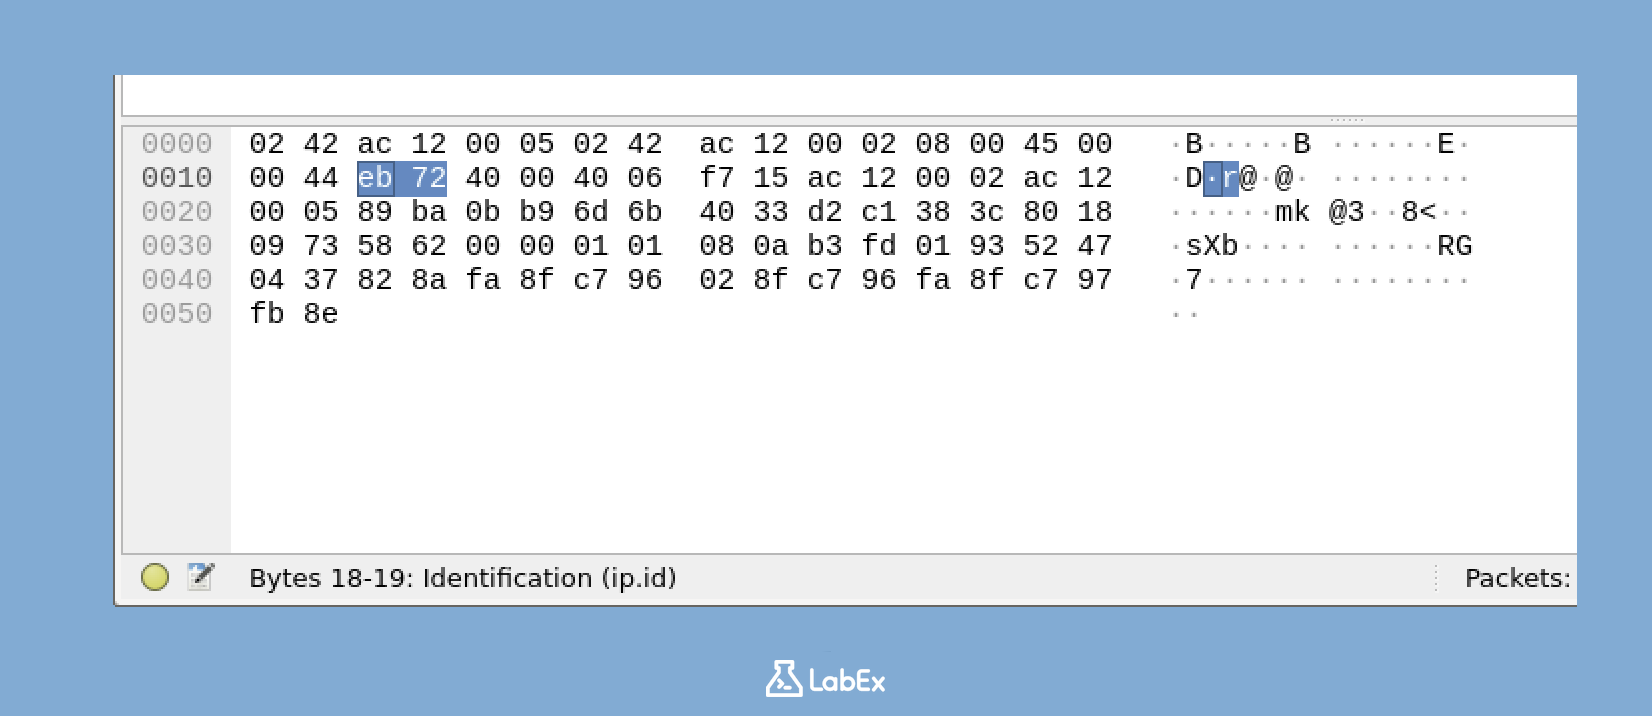
- The left column in the Packet Bytes Pane shows the offset, which is the position of each byte in the packet.
- The middle columns display the hexadecimal values of the bytes. Hexadecimal is a numbering system commonly used in computer science to represent binary data in a more human - readable way.
- The right column shows the ASCII representation of the bytes. ASCII is a character encoding standard that maps binary data to characters.
When you select a specific field in the Packet Details Pane, the corresponding bytes in the Packet Bytes Pane will be highlighted. This helps you see the relationship between the high - level protocol information in the Packet Details Pane and the raw binary data in the Packet Bytes Pane.
Resizing Panes
You can adjust the size of each pane in the Wireshark interface to focus on the information that's most important for your analysis. Here's how you can do it:
Move your cursor to the divider between two panes. When you do this, the cursor will change to a resize cursor, which looks like a double - headed arrow. This indicates that you can now resize the panes.
Click and hold the mouse button, then drag the divider to resize the panes according to your preference. You can make one pane larger and the other smaller.
For example, if you want to see more packets at once, you can make the Packet List Pane larger. If you want to see more detailed information about a packet without having to scroll, you can make the Packet Details Pane larger.
You can also double - click on a divider. When you do this, Wireshark will automatically resize the panes to a default or optimal size.
The ability to resize panes is very useful, especially when you're analyzing complex network captures with a large number of packets or detailed protocol information. It allows you to customize the Wireshark interface to suit your specific analysis needs.
Customizing the Wireshark Interface
In this step, we'll explore how to customize the Wireshark interface. Customizing the interface is crucial as it allows you to tailor Wireshark to your personal preferences, making your network analysis tasks more efficient. Wireshark comes with a wide range of customization options that can greatly enhance your workflow.
Customizing the Layout
Wireshark provides different layout options that determine how the main panes are arranged. These panes are essential as they display different aspects of the captured network data.
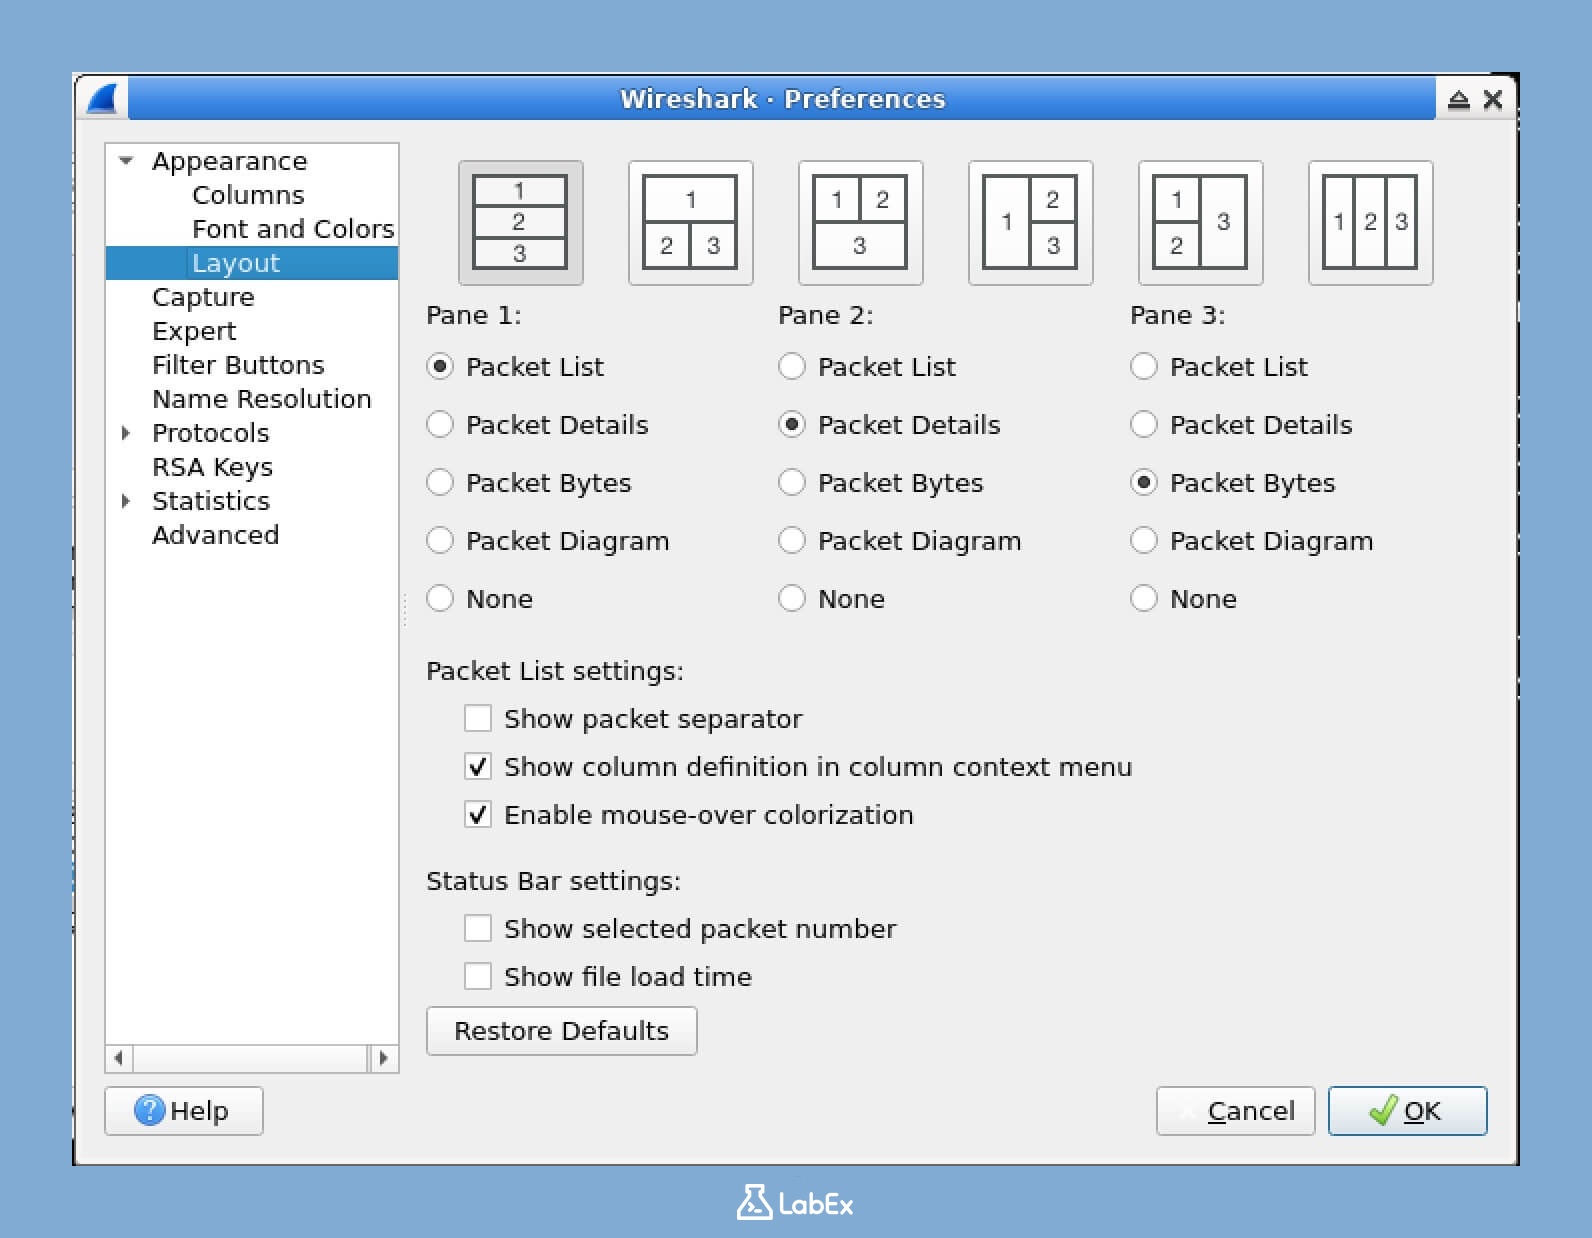
- First, locate the menu bar at the top of the Wireshark window. Click on Edit and then select Preferences from the dropdown menu. This will open the Preferences window where you can make various configuration changes.
- In the Preferences window, look at the left sidebar. Navigate to Appearance and then click on Layout. Here, you'll find the settings related to the interface layout.
- You have several layout options to choose from:
- Packet List, Packet Details, and Packet Bytes in one column (default): This is the default layout where all the important information is stacked in one column.
- Packet List on top, Packet Details and Packet Bytes in one column below: In this layout, the Packet List is at the top, and the other two panes are below it in a single column.
- Packet List on top, Packet Details and Packet Bytes side by side below: Here, the Packet List is on top, and the Packet Details and Packet Bytes panes are arranged side by side below it.
- Custom layout: This option allows you to arrange the panes in a grid according to your specific needs.
- Try selecting a different layout, for example, "Packet List on top, Packet Details and Packet Bytes side by side below". This can give you a better view of the data depending on your analysis requirements.
- After selecting the layout, click OK to apply the changes.
- Observe how the interface layout changes. Different layouts may be more suitable for different analysis tasks or screen sizes. For instance, if you have a large screen, the side - by - side layout might be more convenient for detailed analysis.
Customizing Columns in the Packet List
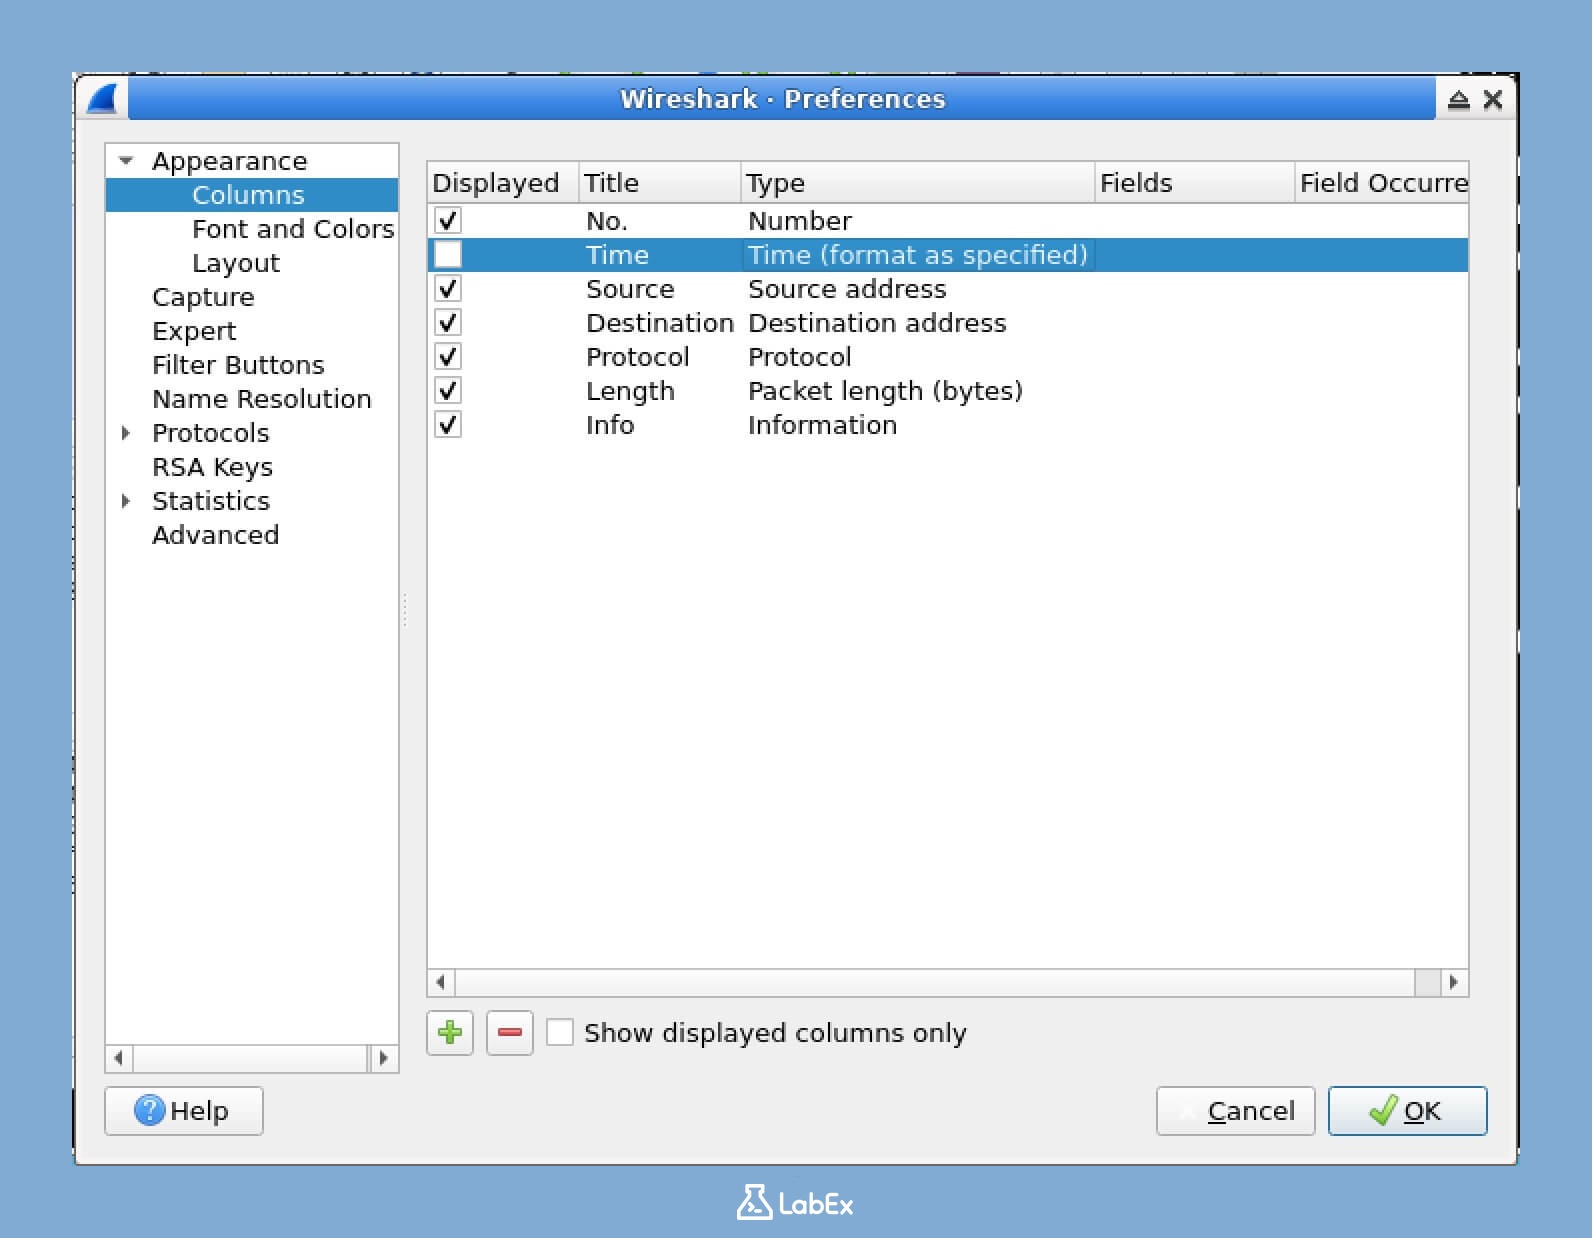
The Packet List Pane shows a list of captured packets. You can modify which columns appear in this pane to display the information that is most relevant to your analysis.
- Right - click on any column header in the Packet List Pane. A context menu will appear with several options.
- From the context menu, select Column Preferences. This will open a window where you can manage the columns in the Packet List Pane.
- In the Preferences window that opens:
- To add a new column: Click the + button. A dropdown menu will appear where you can select a column type. After selecting the type, provide a title for the new column.
- To remove a column: Select the column you want to remove from the list and click the - button.
- To reorder columns: Select a column and use the up/down arrow buttons to move it up or down in the list.
- To modify a column: Double - click on the column. This will allow you to edit its properties such as the title or the field it displays.
- Let's try adding a new column:
- Click the + button.
- For "Field type", select "Custom". This gives you the flexibility to choose a specific field to display.
- For "Field name", enter "ip.src". This will show the source IP addresses of the packets.
- For "Title", enter "Source IP". This will be the title of the new column.
- Click OK to confirm the settings.
- Click OK in the Preferences window to apply your changes.
- You should now see your new column in the Packet List Pane. This new column will help you quickly identify the source IP addresses of the captured packets.
Configuring Color Rules
Wireshark uses colors to help you quickly identify different types of traffic. By customizing these color rules, you can make it even easier to distinguish between various packet types.
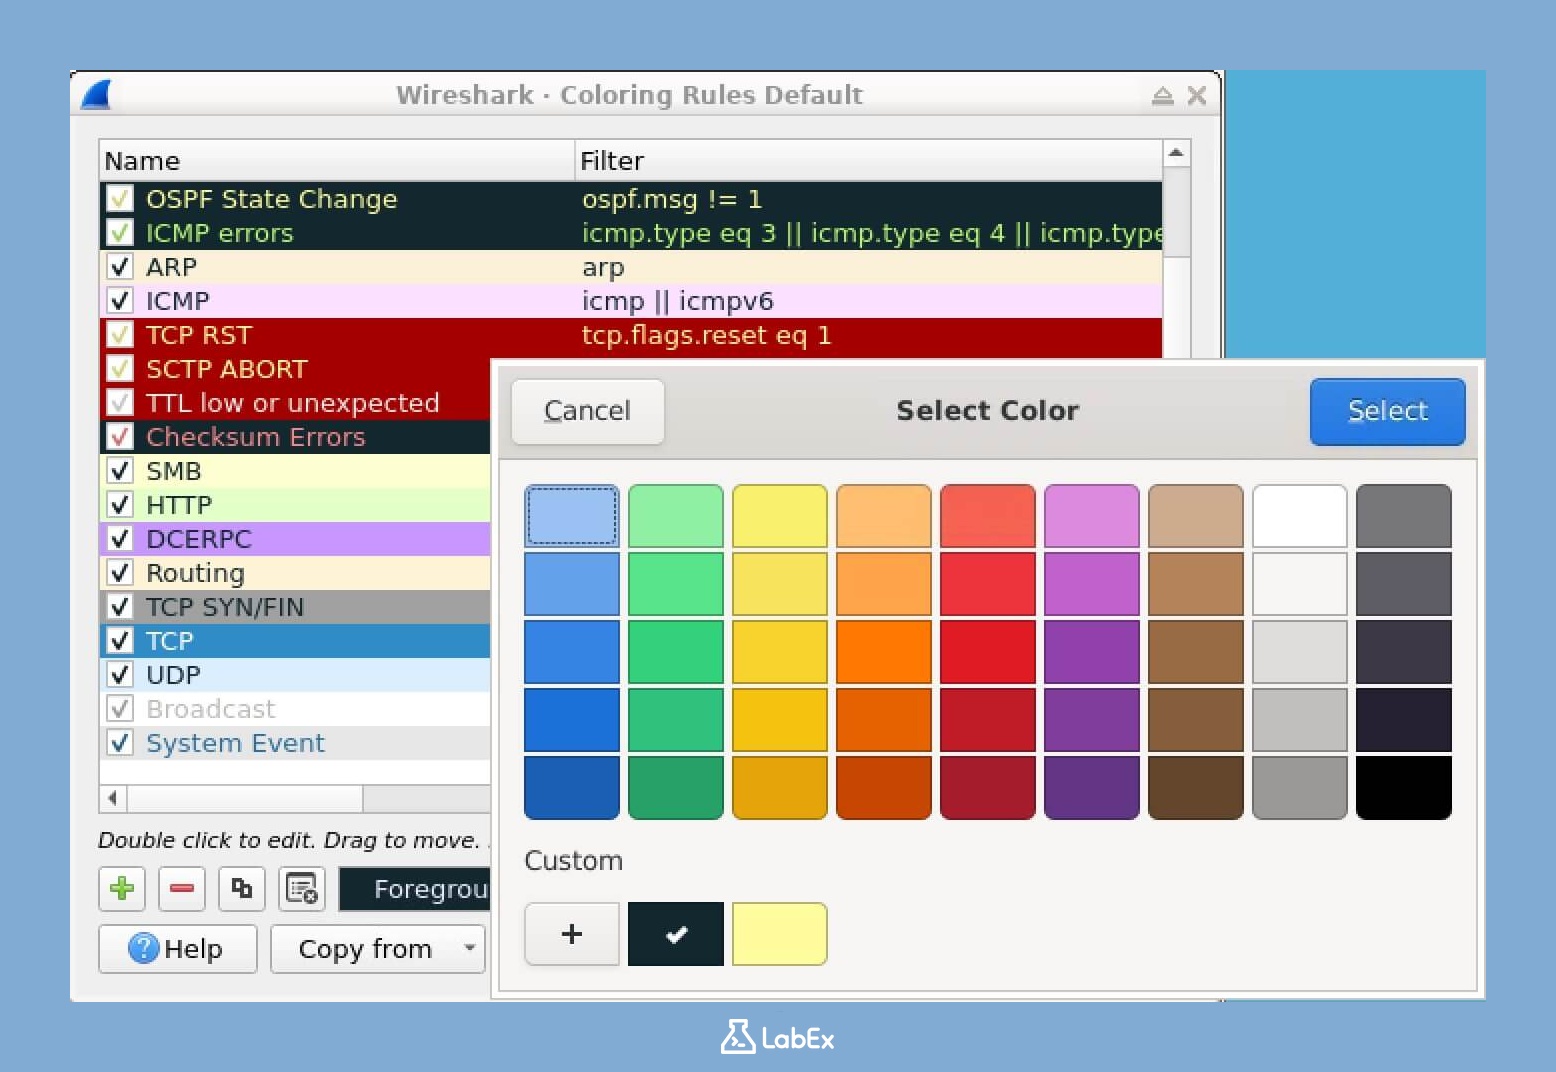
- From the menu bar, select View and then click on Coloring Rules. This will open the Coloring Rules window.
- In the Coloring Rules window, you'll see a list of existing color rules. Each rule has three main components:
- A name: This is a label for the rule, making it easy to identify.
- A display filter: This determines which packets the rule applies to. For example, a filter can be set to match only packets of a certain protocol.
- Foreground and background colors: These are the colors used to highlight the matching packets.
- To add a new color rule:
- Click the + button.
- Enter a name for your rule, such as "ICMP Packets". This will help you easily recognize the rule later.
- Enter a display filter, for example, "icmp". This filter will ensure that the rule applies only to ICMP packets.
- Click on the foreground and background color buttons to choose the colors you want to use for highlighting these packets.
- Click OK to save the new rule.
- To change the priority of rules, select a rule and use the up/down buttons. Rules at the top have higher priority than those below. This means that if a packet matches multiple rules, the rule with the highest priority will be applied.
- Click OK to apply your changes.
- Observe how the packets matching your filter now appear with your chosen colors. This makes it much easier to quickly spot specific types of traffic in the captured data.
Saving Your Profile
After customizing Wireshark to your liking, you can save your configuration as a profile. Profiles are useful because they allow you to quickly switch between different interface configurations depending on the type of network analysis task you're working on.
- From the menu bar, select Edit and then click on Configuration Profiles. This will open the Configuration Profiles window.
- In the Configuration Profiles window, click + to create a new profile.
- Enter a name for your profile, such as "My Custom Profile". This name will help you easily identify the profile later. Then click OK.
- Your current configuration settings are now saved to this profile. This means that whenever you select this profile, Wireshark will load the settings you've customized.
- You can switch between different profiles by going to Edit > Configuration Profiles and selecting a profile from the list. For example, you might have one profile for general browsing and another for detailed protocol analysis.
Restoring Default Settings
If you want to return to the default Wireshark settings after making many changes, the correct way is to switch back to the default configuration profile. This profile is built-in and preserves the original settings.
- From the menu bar, select Edit and then click on Configuration Profiles. This will open the Configuration Profiles window.
- In the list of profiles, select the Default profile.
- Click OK. This will immediately restore the layout, columns, and colors to their default state.
A faster way to do this is to right-click the profile name in the status bar at the bottom-right of the Wireshark window and select Default from the context menu.
Your custom profile is not deleted by this action. You can switch back to it at any time.
Summary
In this lab, you have learned about the Wireshark interface and its components, which are essential for network traffic analysis and troubleshooting. You explored the process of launching Wireshark, familiarized yourself with its five main components, and learned how to start a basic capture and generate traffic for analysis.
You also mastered methods for navigating captured packets, customizing the interface, and creating configuration profiles. These skills lay a solid foundation for advanced network analysis. As you progress in cybersecurity and network administration, your ability to use and customize Wireshark will be invaluable for troubleshooting, incident analysis, and understanding network protocols.


