
Introduction
In this lab, you will learn how to utilize the "Follow TCP Stream" feature in Wireshark for TCP traffic analysis. This feature enables you to extract and view the data payload of a particular TCP conversation. It is highly useful in multiple cybersecurity scenarios, like investigating suspicious network traffic and analyzing application protocols.
By the end of this lab, you will grasp how to use this powerful tool to gain insights into network communications. This will enhance your network analysis capabilities significantly.
Understanding TCP and Capturing Network Traffic
In this step, we'll start by getting to know TCP (Transmission Control Protocol), a fundamental part of network communication. Then, we'll use a powerful tool called Wireshark to capture network traffic. Understanding TCP and being able to capture network traffic are essential skills in the field of cybersecurity, as they allow you to see what's happening on a network and analyze it for potential issues.
What is TCP?
TCP, or Transmission Control Protocol, is one of the most important protocols in the Internet Protocol suite. The Internet Protocol suite is a set of rules that govern how data is transmitted over the internet. TCP provides a reliable way to send data between applications running on different hosts that are communicating over an IP network.
Reliability means that TCP ensures all the data packets sent from one application to another arrive correctly and in the right order. This is different from UDP (User Datagram Protocol), which is a connectionless protocol. UDP doesn't establish a connection before sending data and doesn't guarantee that all packets will arrive or that they'll arrive in order. TCP, on the other hand, is connection - oriented. It first establishes a connection between the sender and the receiver, and then it sends the data. This process helps in maintaining the integrity of the data being transferred.
Launching Wireshark
To start capturing network traffic, we need to launch Wireshark. Here's how you can do it:
First, open a terminal window. You can do this by clicking on the terminal icon in the dock or by pressing
Ctrl+Alt+T. The terminal is a text - based interface that allows you to interact with your computer's operating system by typing commands.Once the terminal is open, you need to type a command to launch Wireshark. Type the following command and then press Enter:
wireshark
This command tells the operating system to start the Wireshark application.
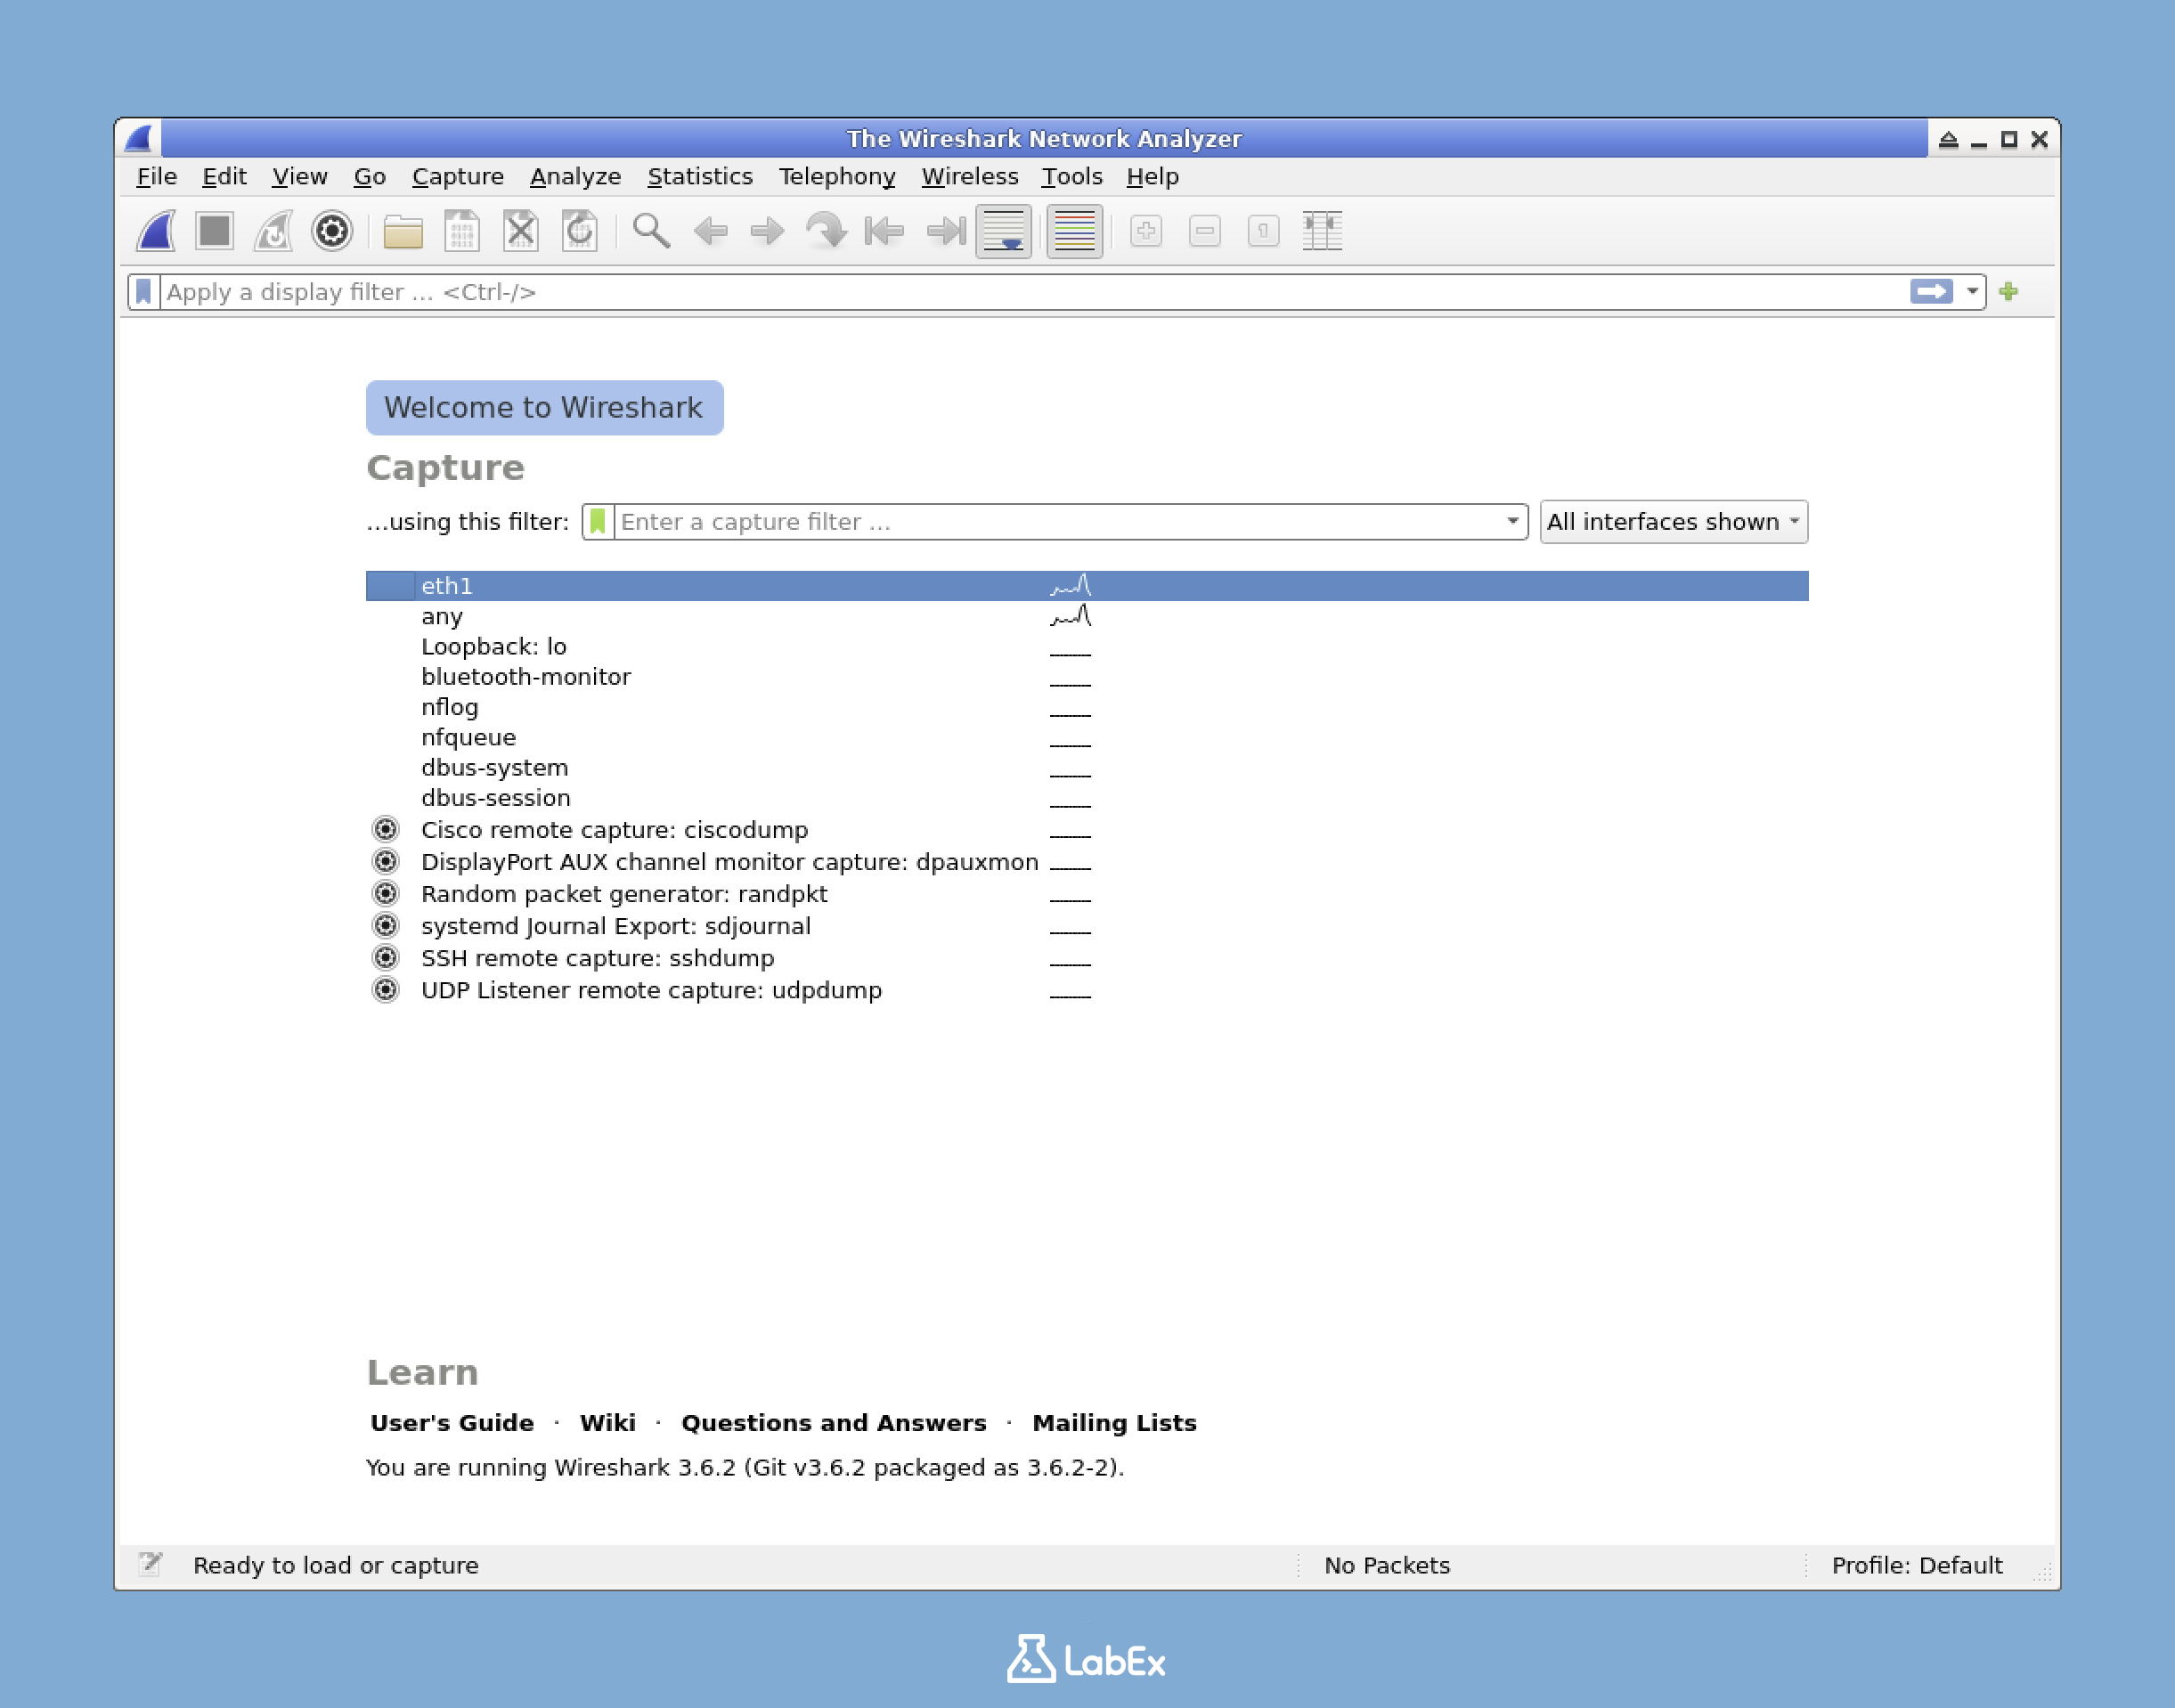
- When Wireshark opens, you'll be presented with the main interface. In this interface, you'll see a list of available network interfaces. Network interfaces are the points of connection between your computer and the network. Each interface can be used to send and receive network traffic.
Capturing Network Traffic
Now that Wireshark is open, we're ready to start capturing network traffic. Here are the steps:
In the list of network interfaces, click on the
eth1interface. This is usually the primary network interface for your virtual machine. A virtual machine is like a computer within your computer, and theeth1interface is how it connects to the network.After selecting the
eth1interface, click theStart capturing packetsbutton, which is represented by a blue shark fin icon in the toolbar. This action tells Wireshark to start monitoring the selected network interface and capture all the network packets passing through it.
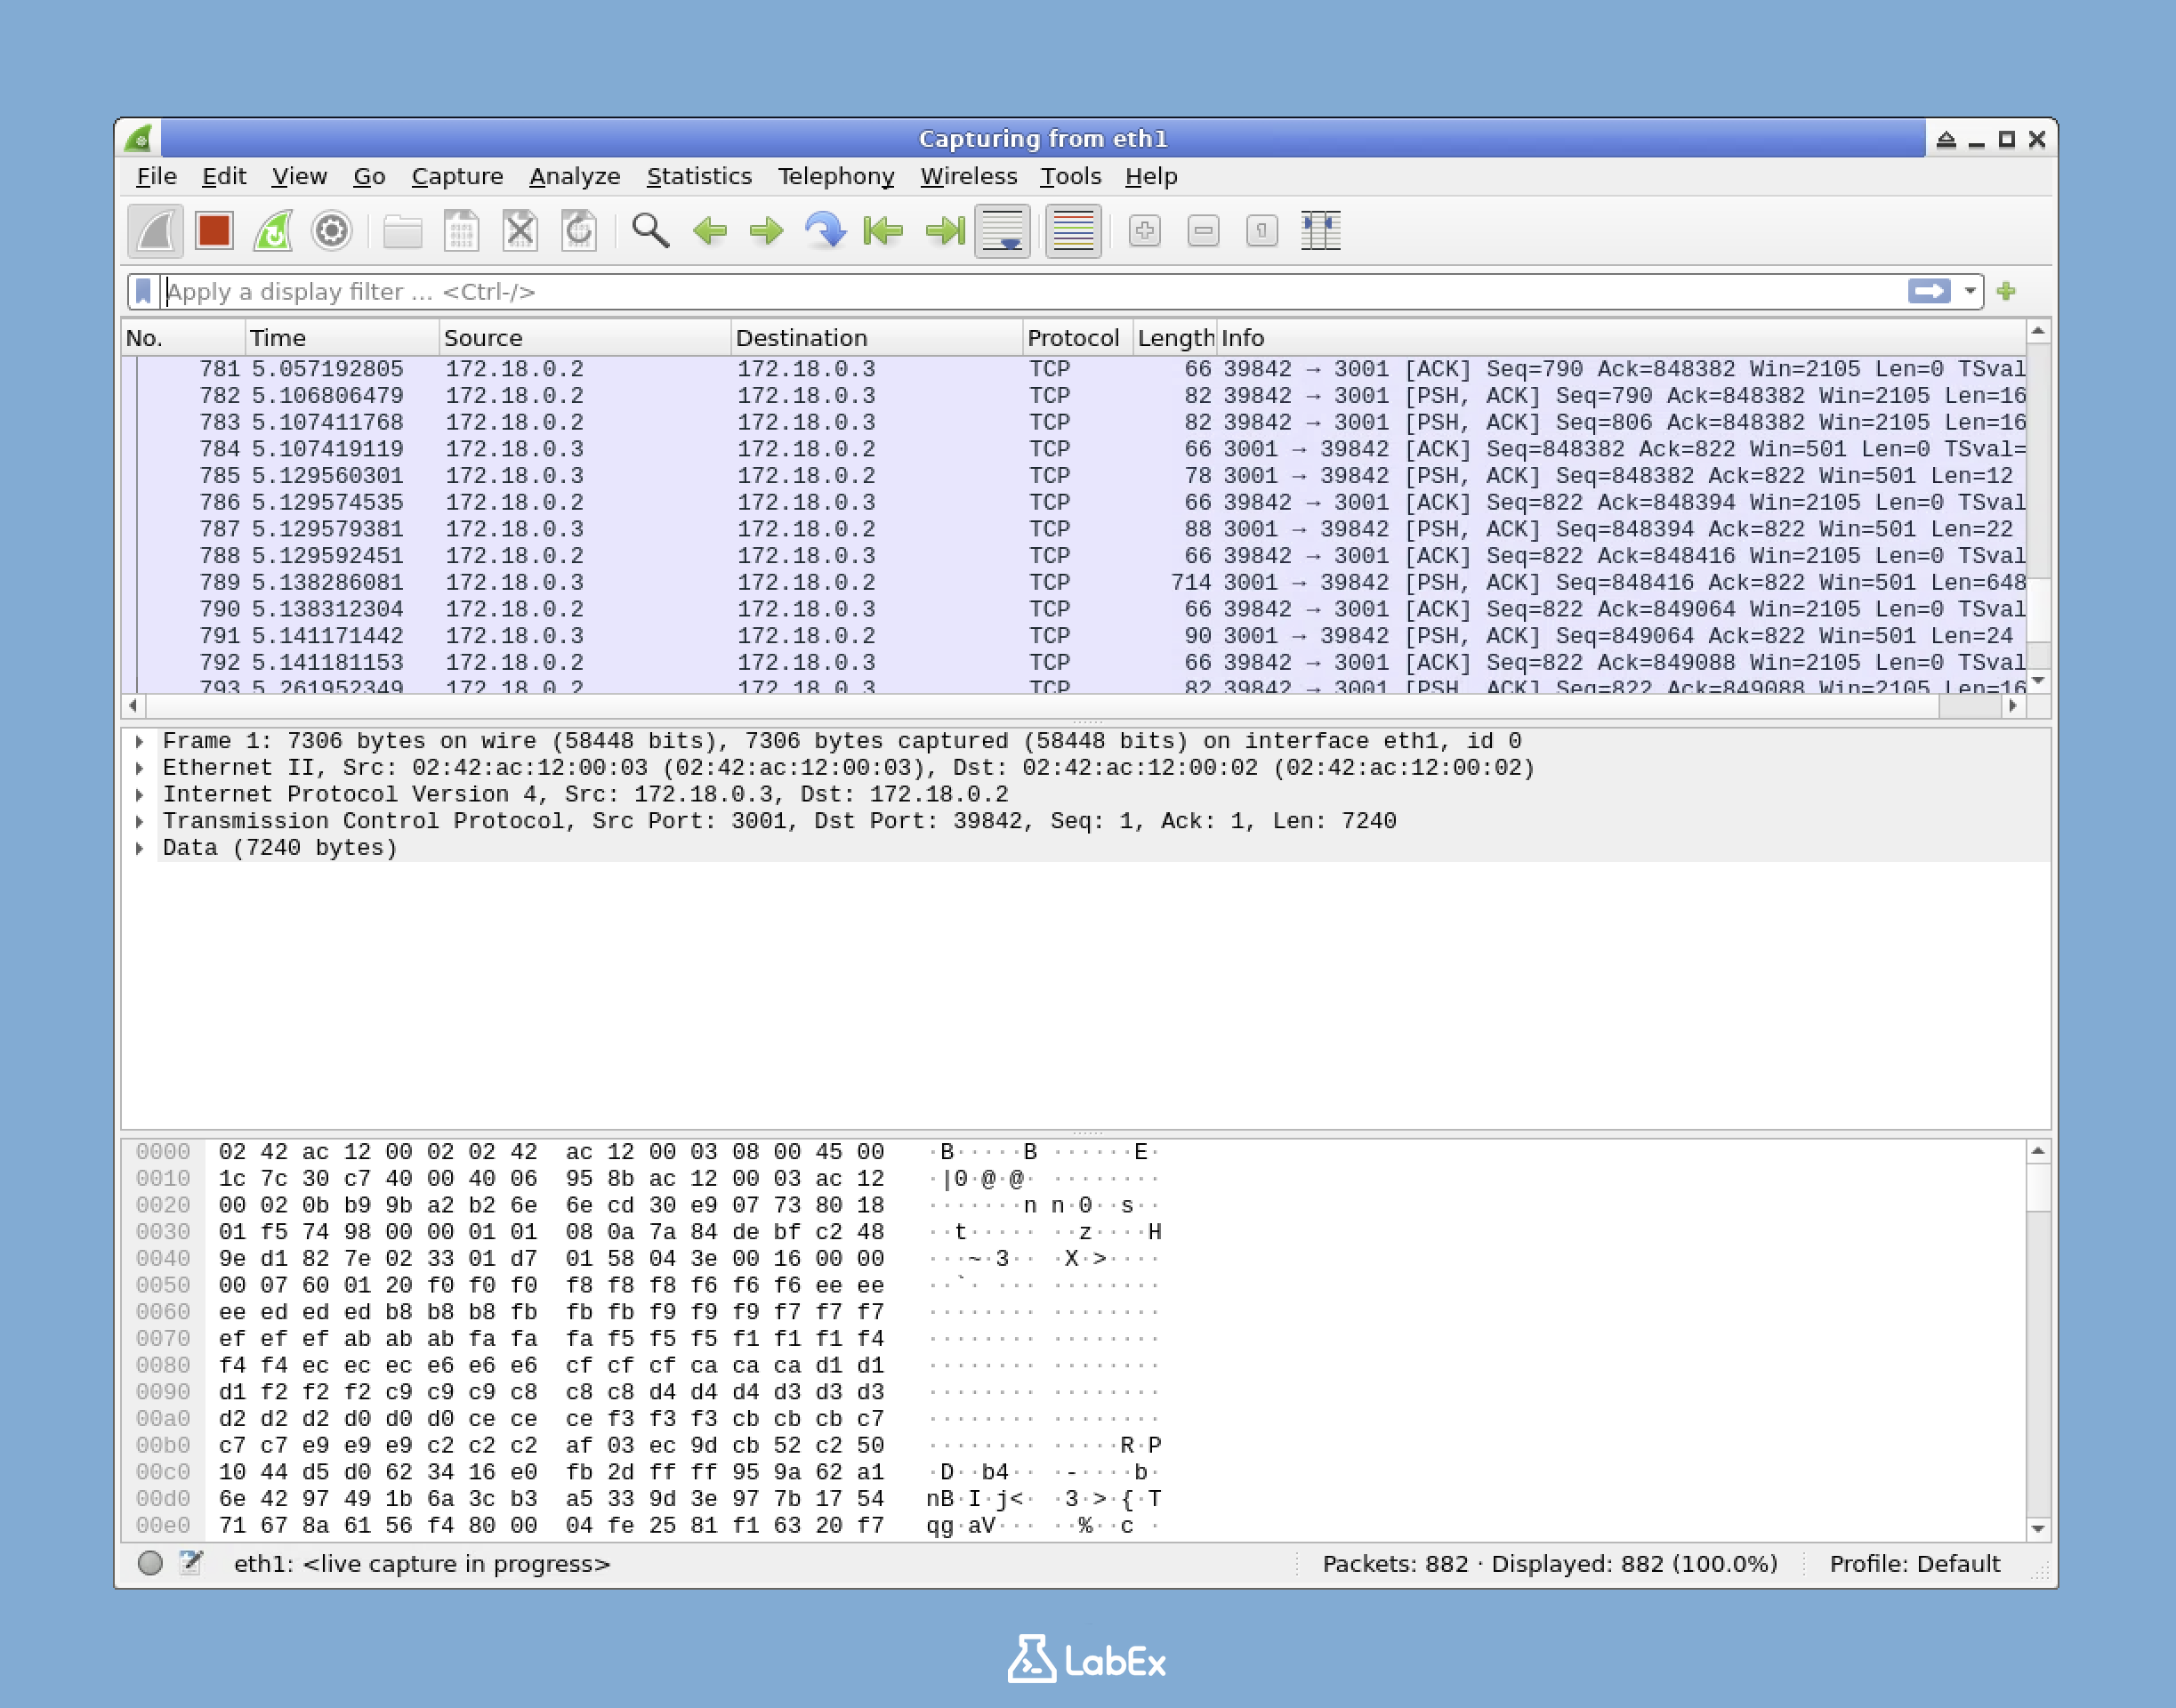
As Wireshark starts capturing, you'll see packets appearing in the main Wireshark window. These packets are the building blocks of network traffic. Each packet contains a small amount of data and some information about where it's coming from and where it's going.
To generate some TCP traffic that we can analyze, we'll use the
curlcommand. Open a new terminal window and type the following command:
curl https://labex.io
The curl command is used to transfer data from or to a server. In this case, it's fetching the web page content from https://labex.io. This action will generate TCP traffic because the HTTP request to the web page uses the TCP protocol.
Once you run the
curlcommand, you'll see the web page content displayed in the terminal. At the same time, Wireshark will capture all the TCP packets related to this HTTP request. These packets contain information about the request and the response between your computer and the web server.After capturing for about 10 - 15 seconds, which is usually enough to get a good sample of the traffic, go back to Wireshark and click the
Stop capturing packetsbutton, represented by a red square icon in the toolbar. This stops Wireshark from capturing any more packets.
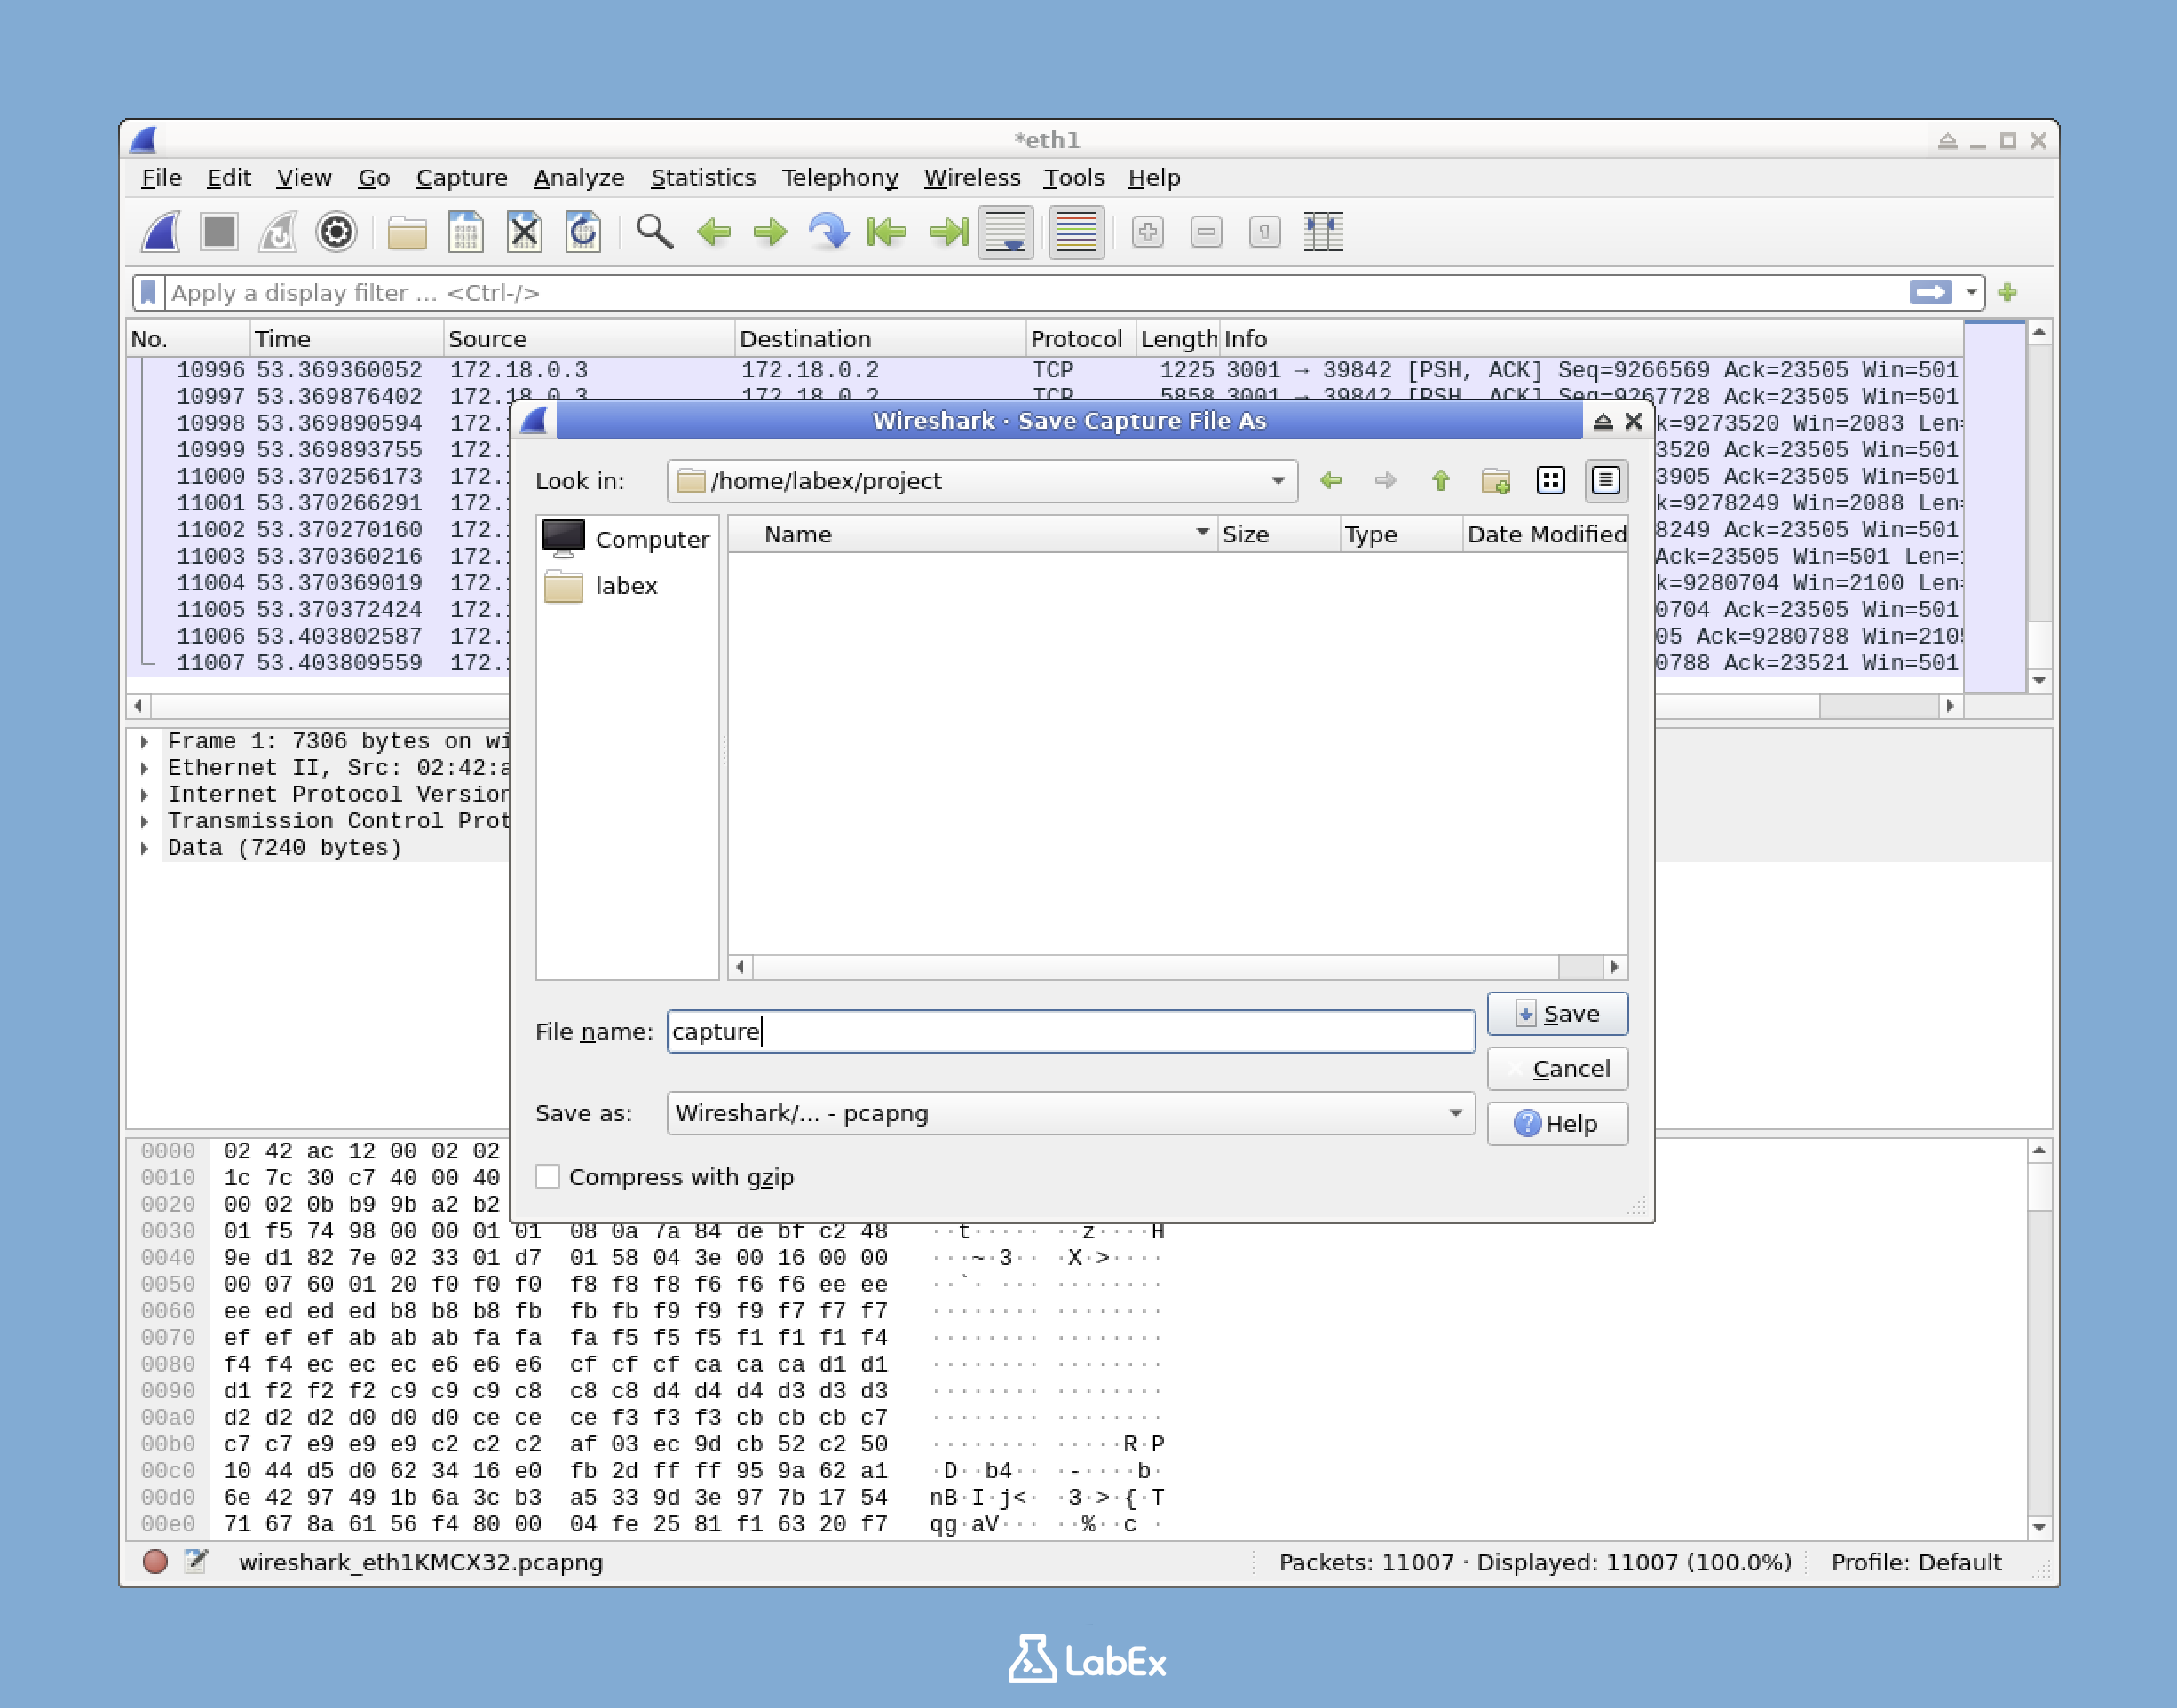
- To save the captured traffic for future analysis, go to the
Filemenu and selectSave, or you can pressCtrl+S. Navigate to the/home/labex/project/directory, give your file the namecapture.pcapng, and then clickSave. The.pcapngfile format is a standard format for storing network packet captures, and it allows you to open and analyze the captured traffic later.
Now you have successfully captured some network traffic that contains TCP conversations. In the next steps, we'll analyze this captured traffic to learn more about TCP.
Filtering and Following TCP Streams
In this step, we'll analyze the labex.io traffic we captured in the previous step. We'll learn how to filter network traffic to isolate specific TCP conversations and explore Wireshark's powerful "Follow TCP Stream" feature. This feature acts like a magnifying glass for network communications, allowing you to see the complete conversation between two endpoints.
Filtering for TCP Traffic
First, let's filter the traffic to focus specifically on our labex.io communication:
- In the Wireshark main window, look at the top of the packet list. You'll see a display filter text box with placeholder text that says "Apply a display filter".
- Type
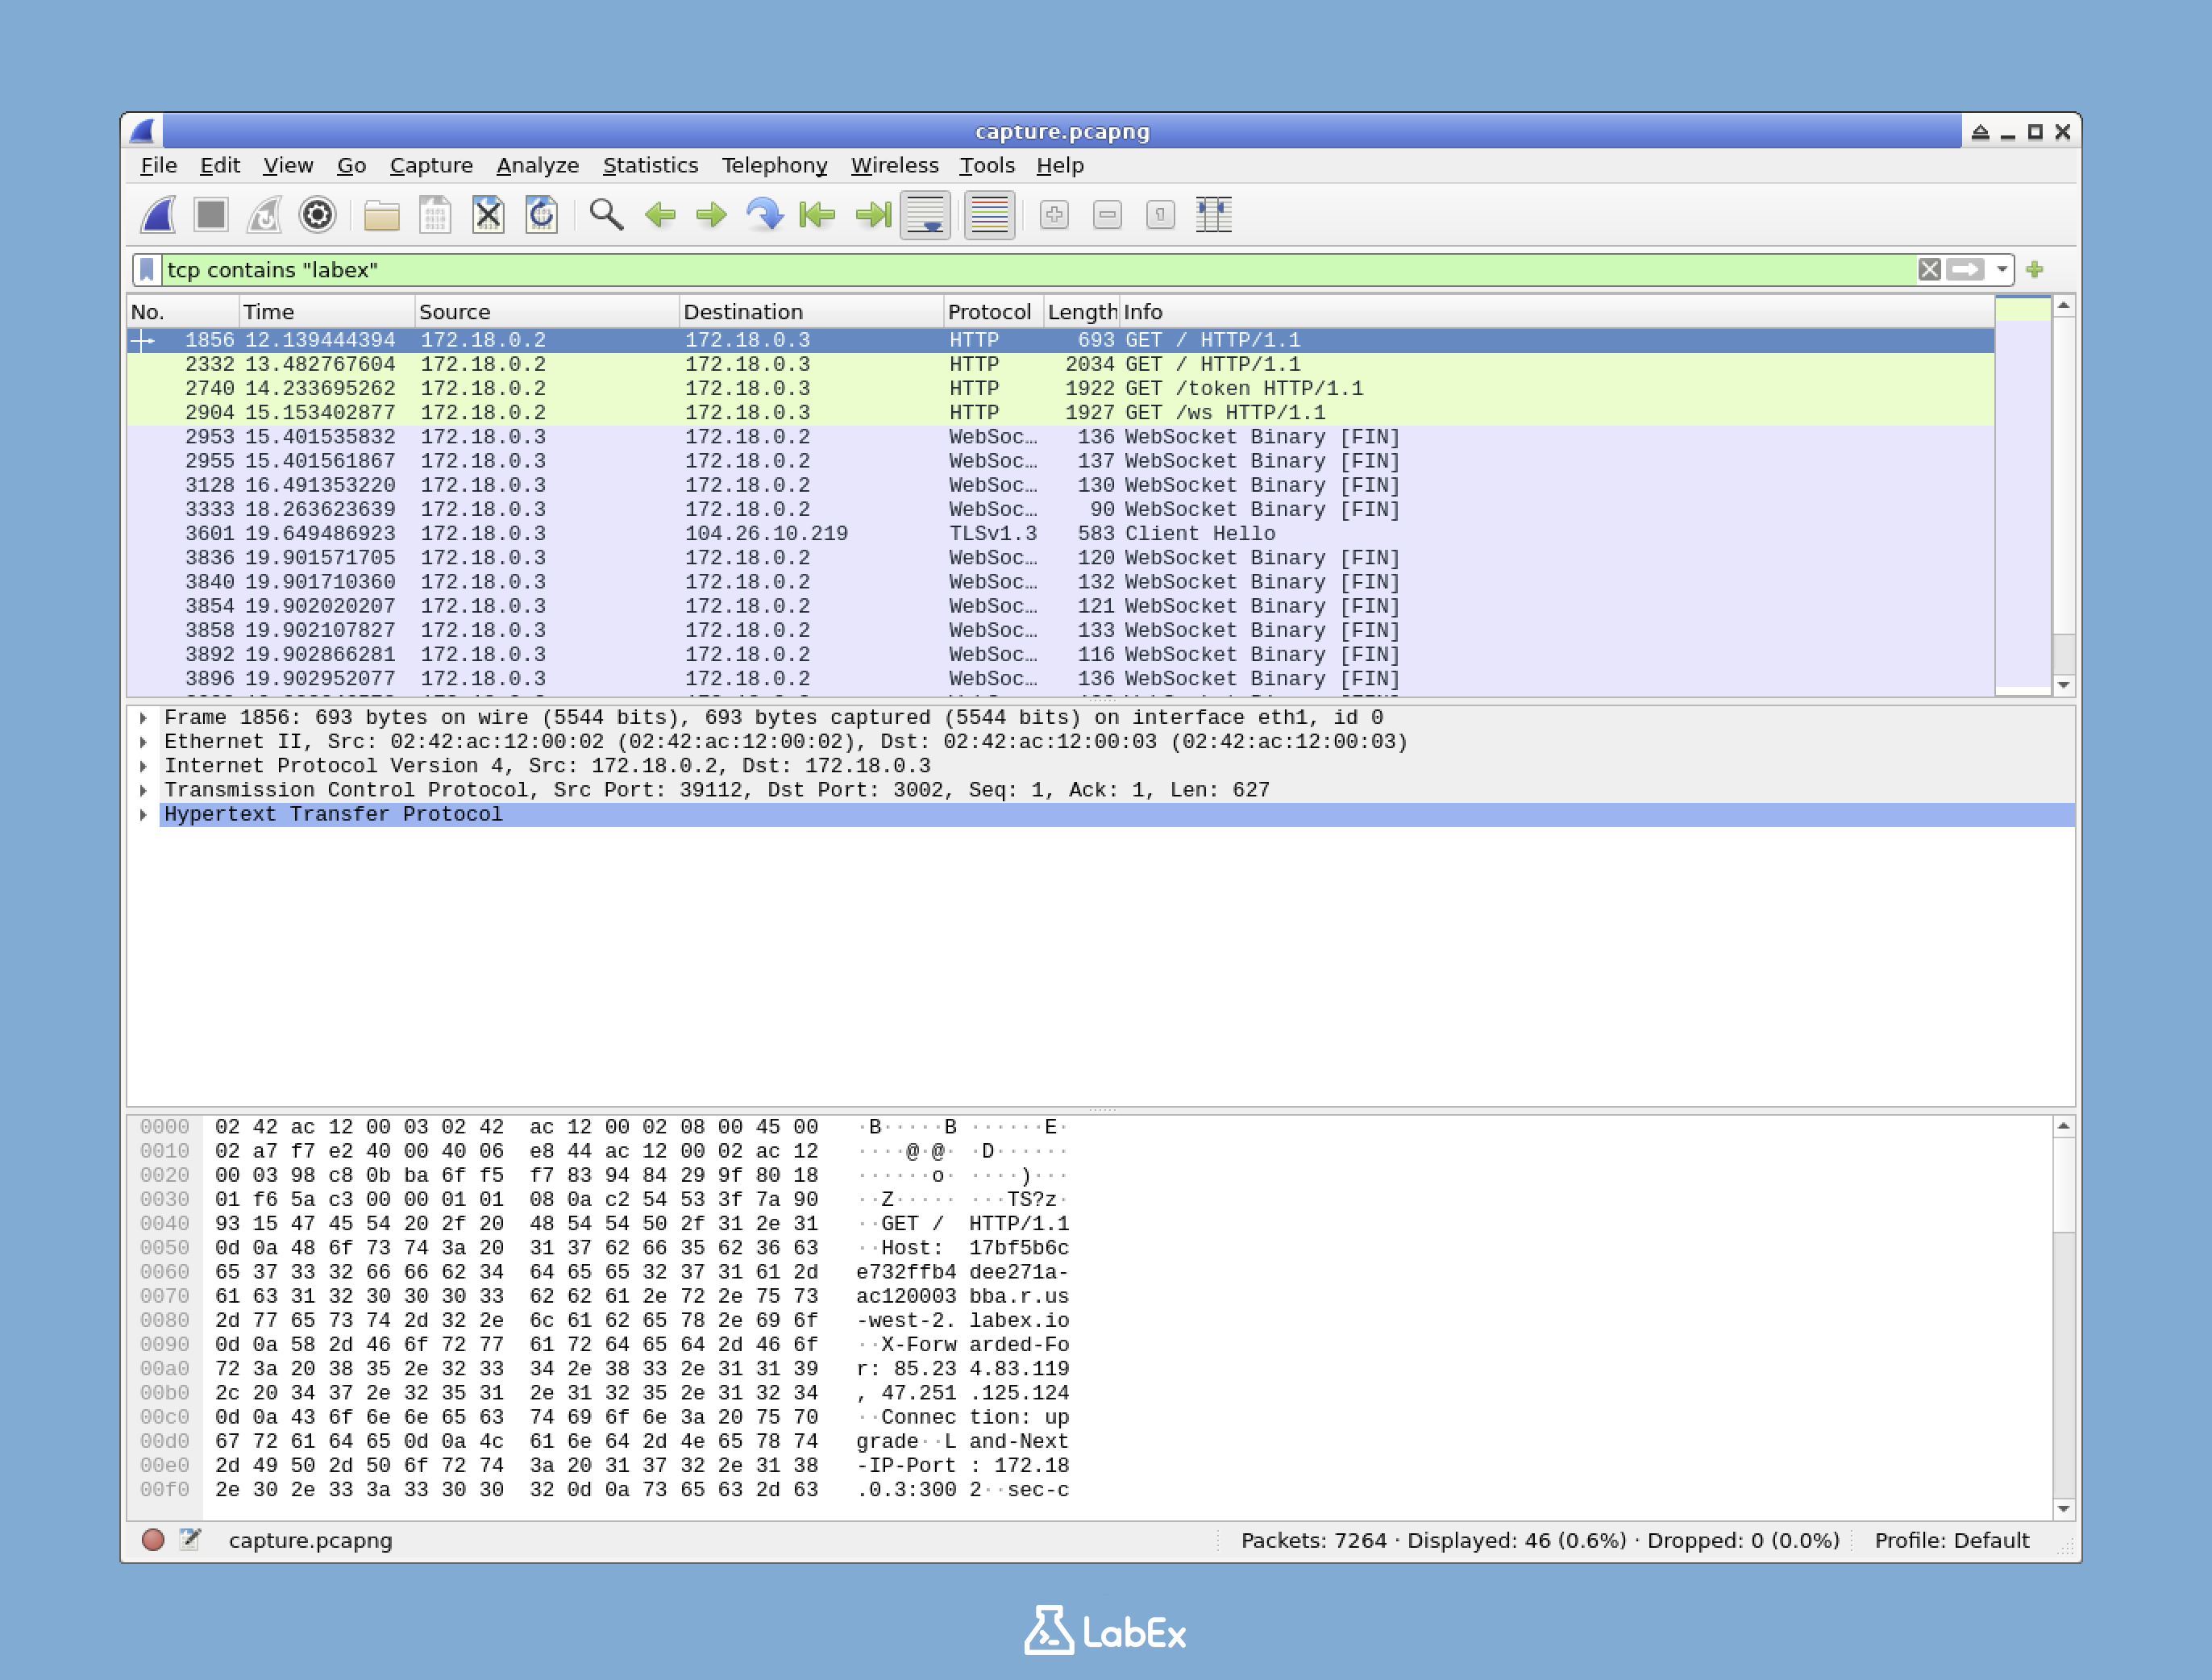
tcpin the filter box and press Enter or click the arrow button to apply the filter. - The packet list now shows only TCP packets, but we can narrow it down further. Since we're interested in the labex.io traffic we generated with our curl command, let's refine our filter.
- Type
tcp contains "labex"in the filter box and apply it. This will show only TCP packets that contain "labex" in their content, helping us find the relevant traffic.
Understanding TCP Conversations
Before we start following TCP streams, it's important to understand what a TCP conversation is. A TCP conversation consists of all the packets exchanged between two endpoints (IP address and port combinations) during a TCP session. Each TCP conversation has several key components:
- A source and destination IP address: In our case, your machine's IP and labex.io's server IP
- A source and destination port: For our HTTPS connection to labex.io, the destination port is likely 443
- Sequence and acknowledgment numbers: These track data and ensure correct delivery
- Various flags (SYN, ACK, FIN, etc.): These control the connection state
In our capture, we should see a TCP conversation between your machine and the labex.io server.
Following a TCP Stream
Now let's analyze the TCP stream for our labex.io request:
- In the filtered packet list, look for packets with a destination IP that likely belongs to
labex.io. You should see packets with destination port443(HTTPS), which is used for secure web traffic. - Click on one of these packets to select it.
- Right-click on the selected packet and choose
Follow>TCP Streamfrom the context menu.
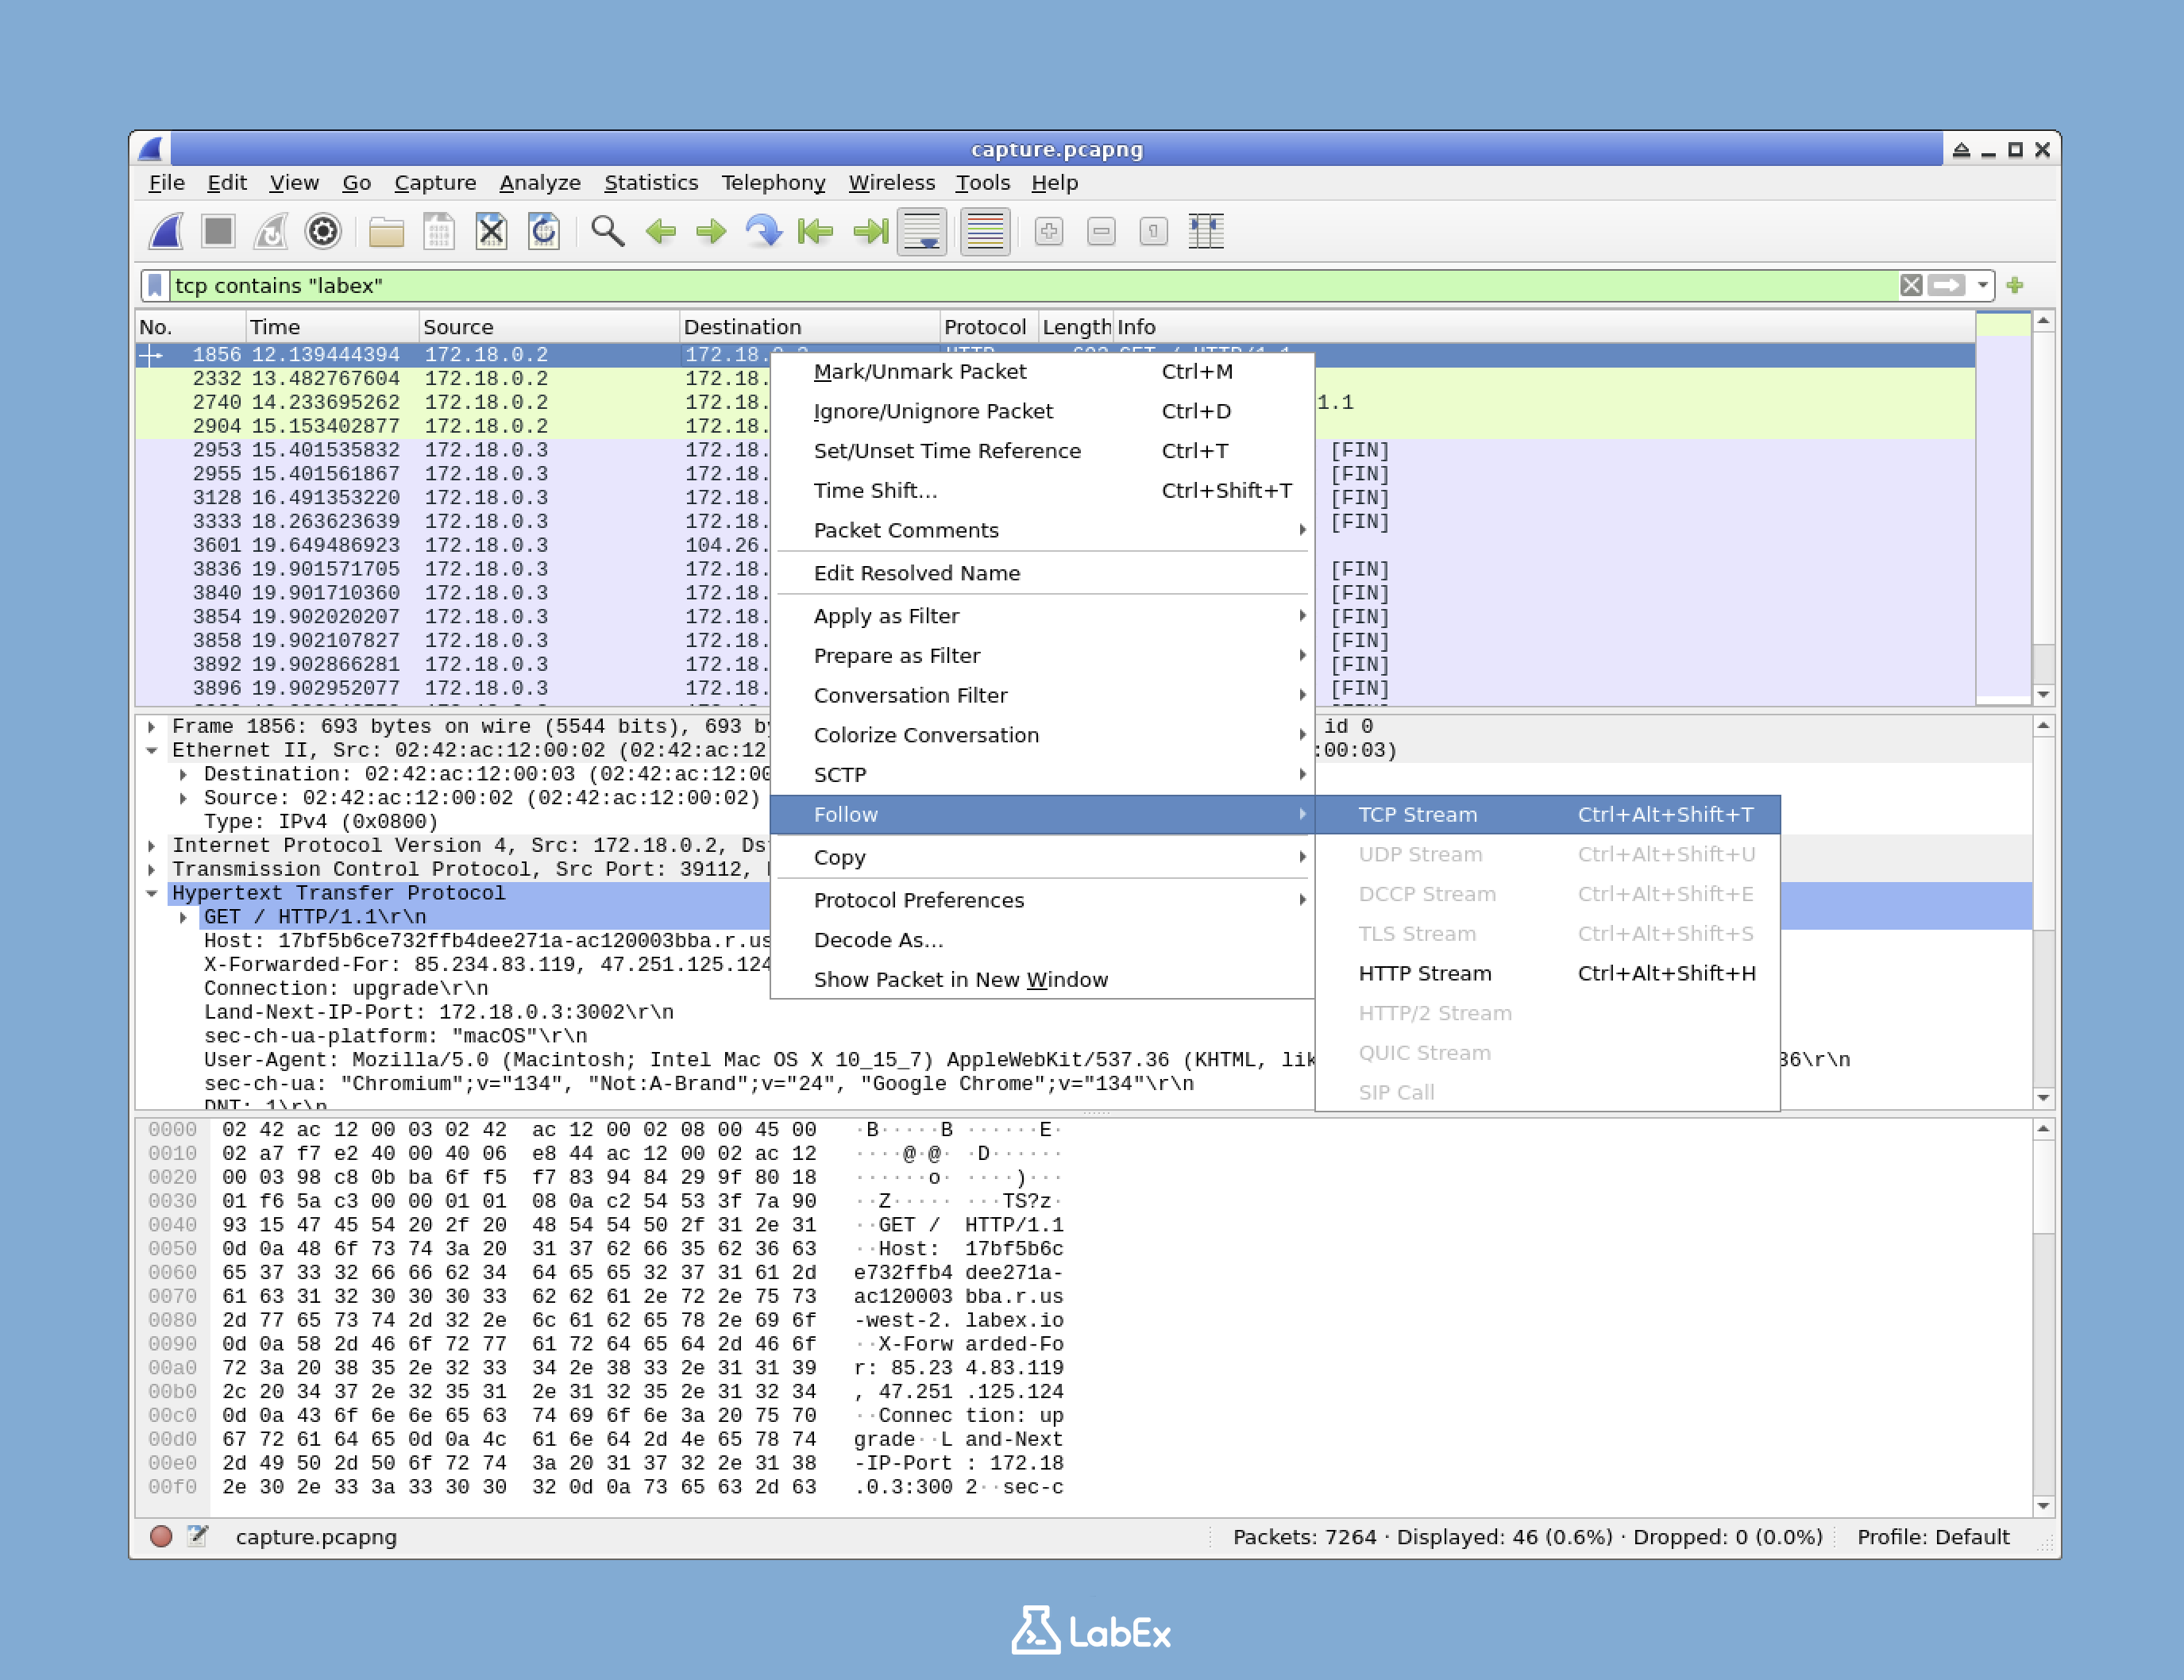
- A new window will open, showing the entire TCP conversation between your machine and the
labex.ioserver.
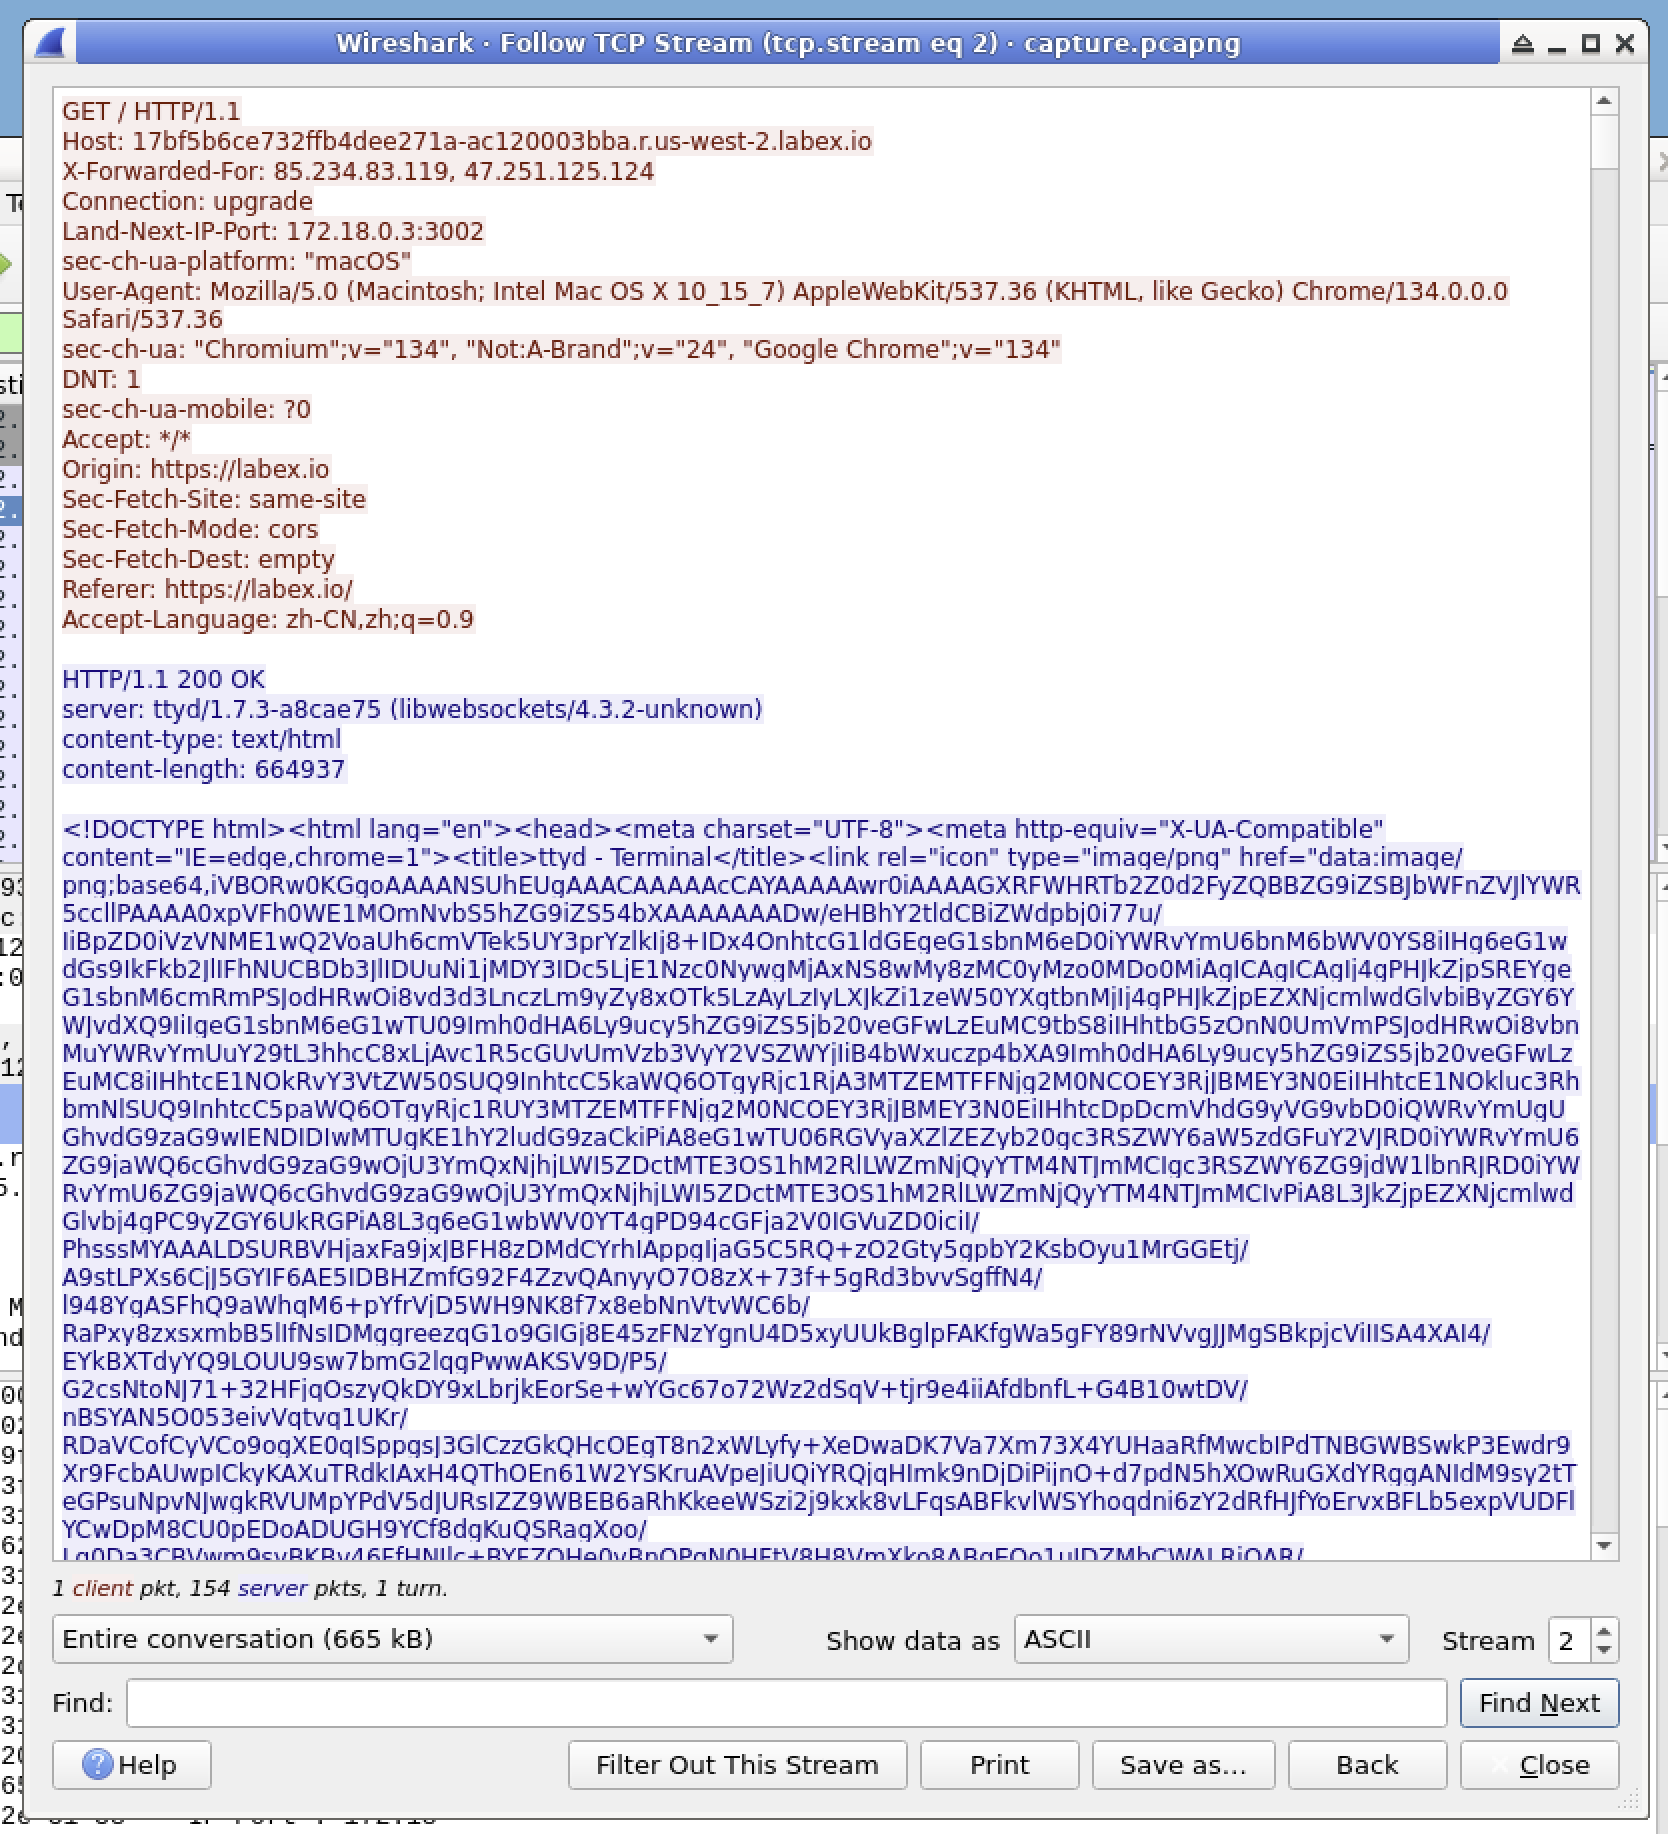
In this window:
- Text in red represents data sent from your machine (client) to the labex.io server
- Text in blue represents data sent from the labex.io server back to your machine
- The entire conversation is reconstructed in the order it occurred
Since we accessed labex.io via HTTPS, you'll mostly see encrypted data in the stream. This is normal and expected because HTTPS encrypts the data to protect it during transmission. You might be able to identify the TLS handshake at the beginning of the communication, but the actual HTTP request and response will be encrypted.
Explore the different viewing options by using the "Show and save data as" dropdown menu:
ASCII: Shows the data as text (useful for reading any unencrypted portions)Hex Dump: Shows both hexadecimal and ASCII representations (good for examining the encrypted data)C Arrays: Formats the data as C programming language arraysRaw: Shows only the raw binary data
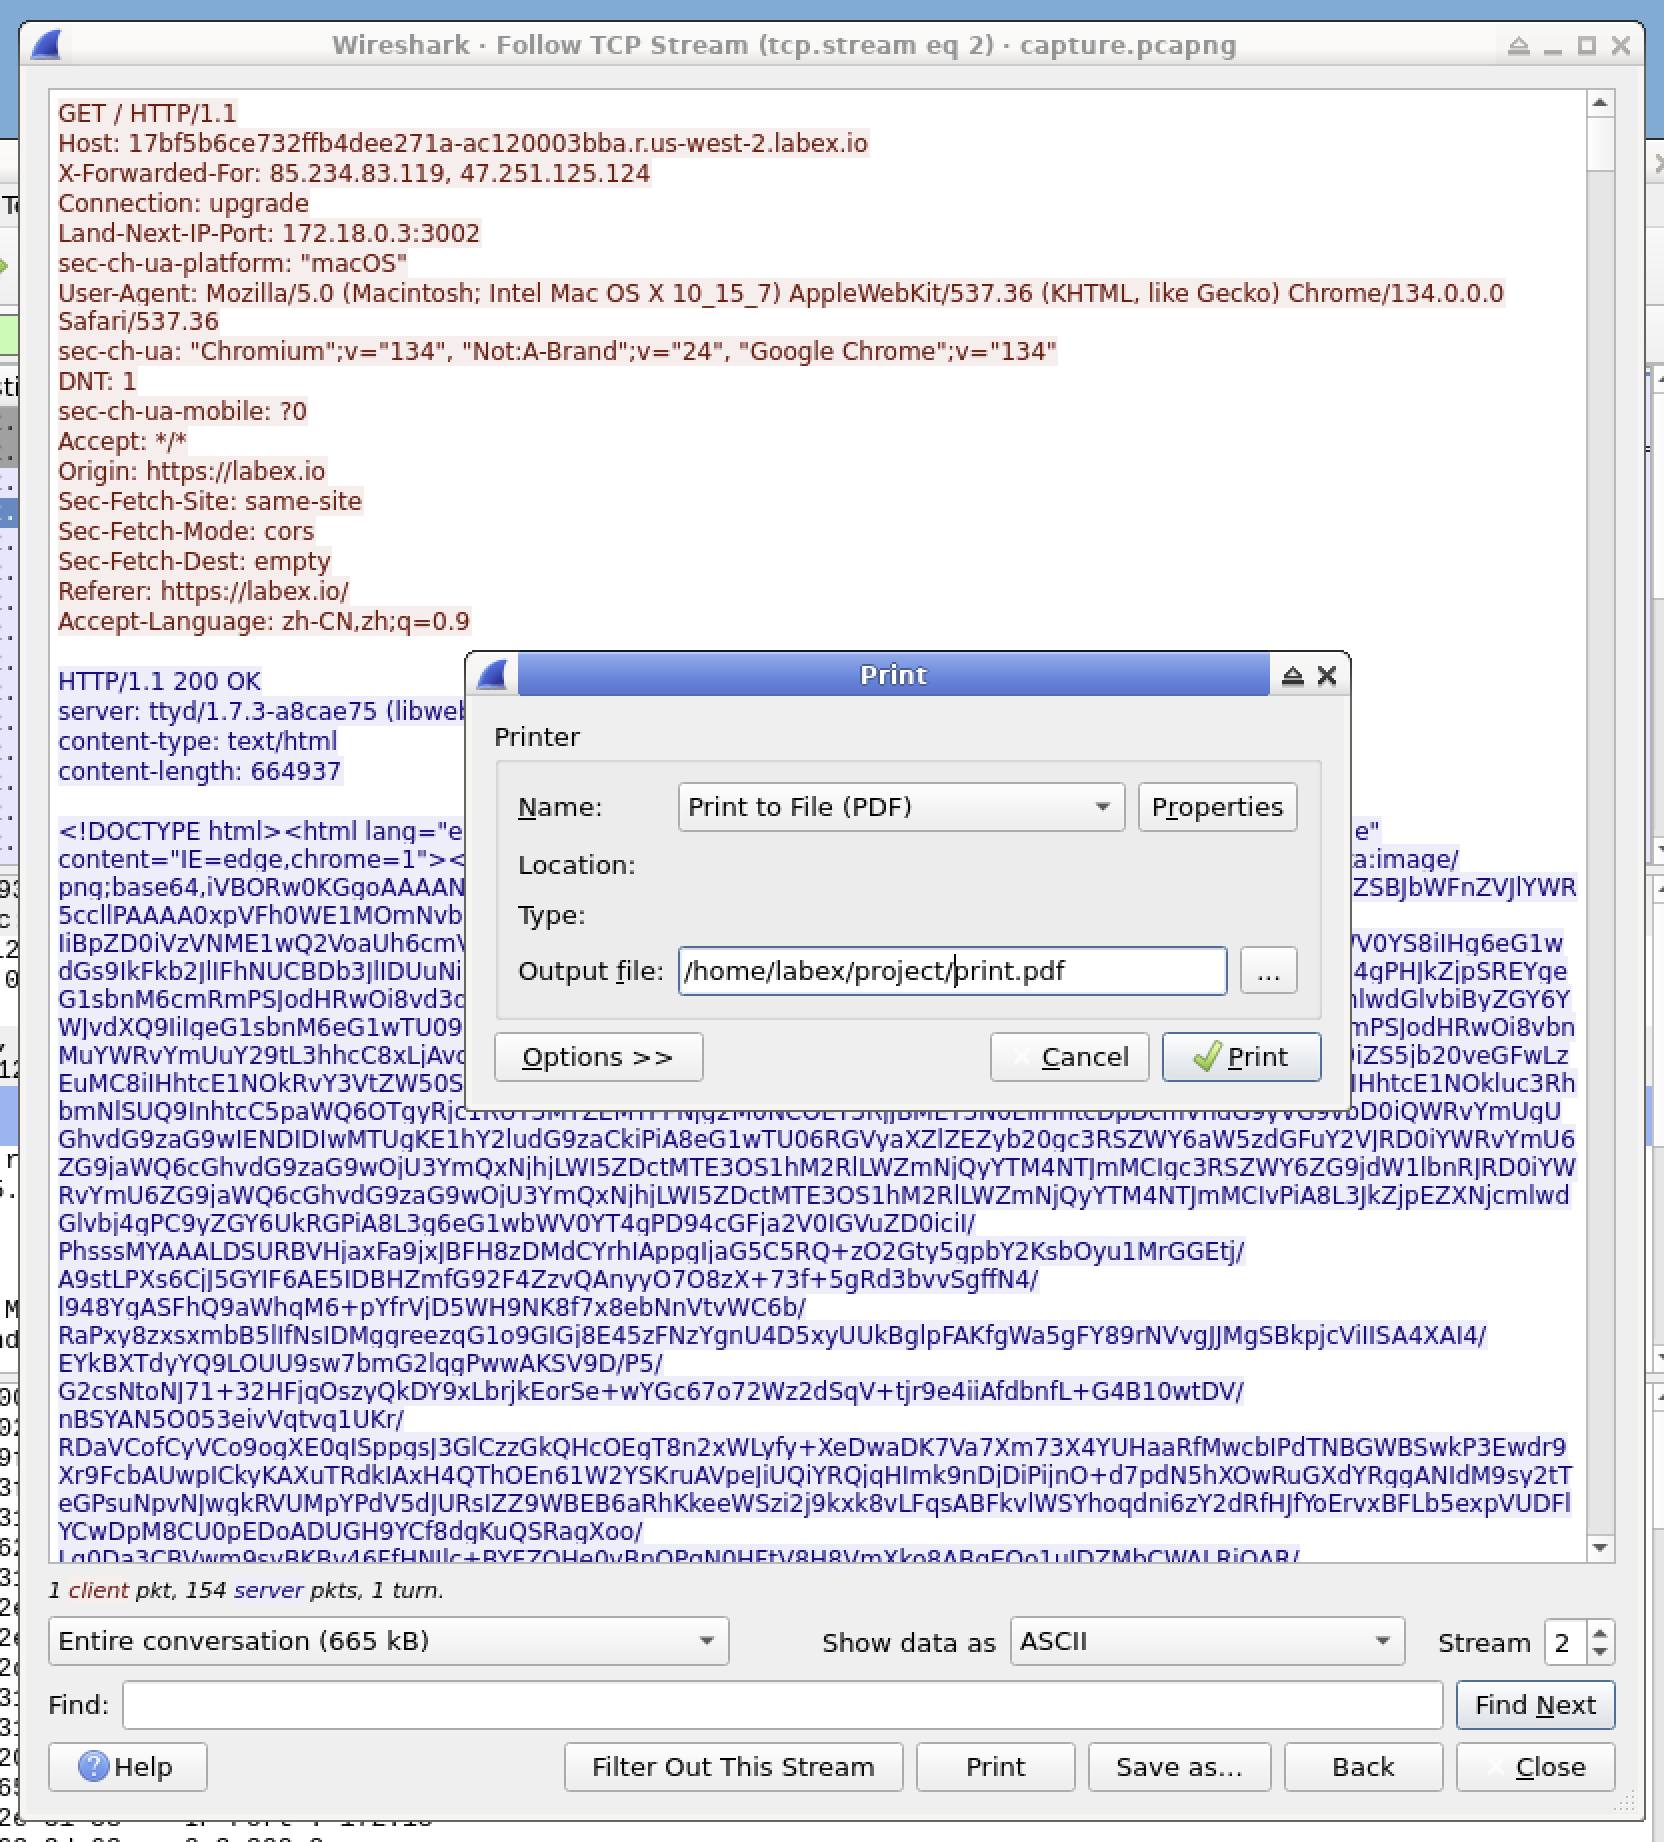
To keep a record of this analysis, click the
Printbutton. Save the print output as a PDF namedprint.pdfin the/home/labex/project/directory.
By following the TCP stream, you can see the complete communication between your machine and the labex.io server without having to manually piece together data from individual packets. In the next step, we'll learn how to save and analyze this data in more detail.
Saving and Analyzing TCP Stream Data
In this step, we'll save the labex.io TCP stream data we examined in the previous step for offline analysis. We'll also learn how to interpret this saved information to extract valuable insights from the encrypted HTTPS communication.
Saving TCP Stream Data
Let's save the TCP stream data from our labex.io connection:
You should still have the TCP Stream window open from the previous step, showing the communication between your machine and labex.io. If you accidentally closed it, just repeat the steps to follow the TCP stream of one of the labex.io packets.
At the bottom of the TCP Stream window, locate the
Save Asbutton.
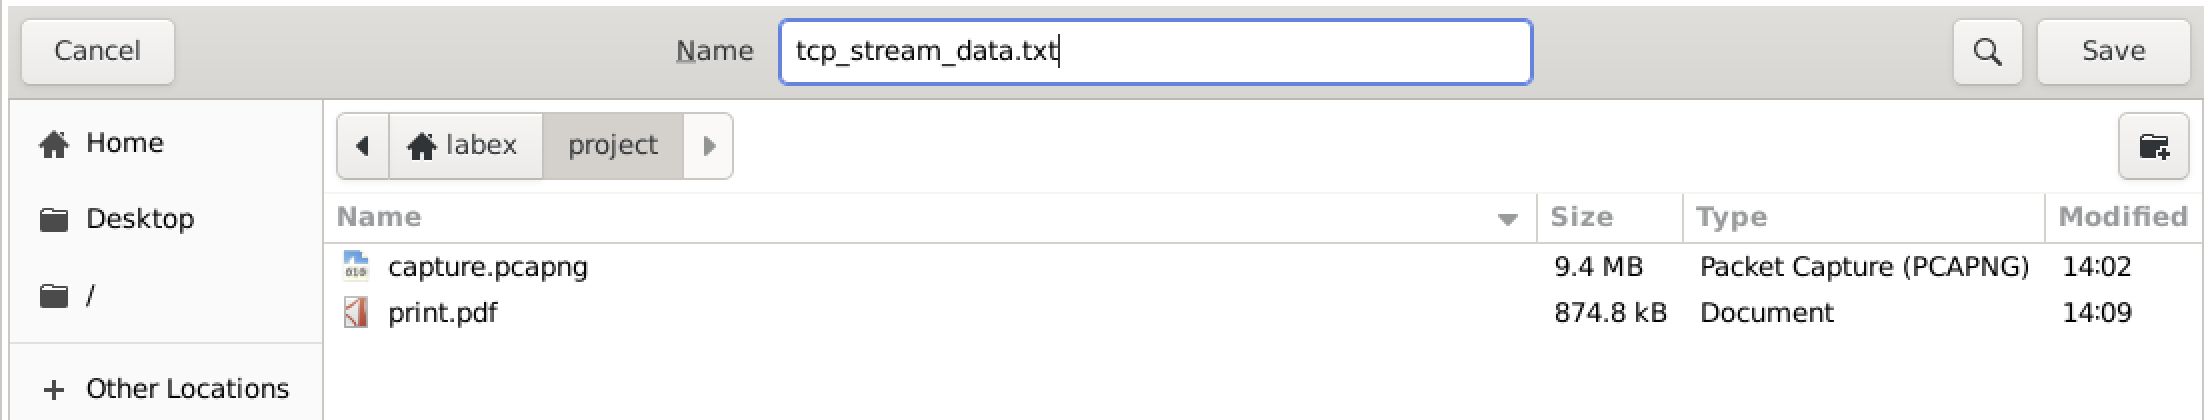
Click the
Save Asbutton, which will open a save dialog.Navigate to the
/home/labex/project/directory and enter the filenametcp_stream_data.txt.Click the
Savebutton. This saves the entire labex.io TCP stream to a text file with the specified name.The content will be saved in the format that was selected in the "Show and save data as" dropdown menu. If you want to save it in a different format (such as Hex Dump instead of ASCII), you can change the format in the dropdown menu before saving.
Understanding the Saved Data
Now that we've saved the TCP stream from our labex.io connection, let's examine its contents:
- Open a terminal to view the saved file:
head /home/labex/project/tcp_stream_data.txt
Or you can use cat to view the entire file:
cat /home/labex/project/tcp_stream_data.txt
Examine the file contents. Since our traffic to labex.io was over HTTPS, much of the data will be encrypted and appear as non-readable characters. However, you can still observe several important elements:
- The TLS handshake at the beginning of the communication, where your client and the
labex.ioserver negotiate encryption parameters - Client hello and server hello messages, which are part of the TLS handshake
- The encrypted application data that contains your actual HTTP request and the server's response
- The TLS handshake at the beginning of the communication, where your client and the
Notice how the data is organized in the same way it appeared in the TCP Stream window, with client data (from your machine to labex.io) separated from server data (from labex.io to your machine).
Practical Applications of TCP Stream Analysis
The TCP stream analysis skills you're developing are valuable in many cybersecurity scenarios. Let's relate these to what we've observed with our labex.io traffic:
- TLS/SSL Inspection: By analyzing the TLS handshake in the labex.io stream, security professionals can verify that secure connections are using strong encryption algorithms.
- Security Monitoring: Even with encrypted HTTPS traffic like our labex.io connection, analysts can identify communication patterns without necessarily decrypting the content.
- Network Troubleshooting: If our connection to labex.io had failed, analyzing the TCP stream could help identify whether the issue was during the TCP connection establishment, the TLS handshake, or the HTTP exchange.
- Network Forensics: In an investigation scenario, TCP streams like our labex.io connection would help reconstruct a timeline of network activities.
- Performance Analysis: By examining the timing and sequence of packets in the labex.io TCP stream, you could identify potential performance bottlenecks in the network.
By saving TCP streams, as we did with our labex.io connection, you create a permanent record that can be:
- Shared with team members for collaborative analysis
- Used as evidence in security investigations
- Compared with other captured streams to identify patterns
- Analyzed with additional tools beyond Wireshark
This ability to extract, save, and analyze actual network communication data is what makes TCP stream analysis such a powerful technique for network security professionals.
Advanced TCP Stream Analysis Techniques
In this final step, we'll explore some advanced techniques for analyzing TCP streams in our capture, focusing on our labex.io traffic and any other TCP conversations that might be present. These advanced skills will help you become more efficient when working with complex network traffic captures.
Filtering Multiple TCP Streams
Let's learn how to explore and filter all the TCP conversations in our capture, not just the labex.io traffic:
Return to the main Wireshark window. If the TCP Stream window from our labex.io analysis is still open, close it.
To view all the TCP conversations in your capture, go to
Statistics>Conversationsin the top menu.In the Conversations window, click on the
TCPtab to filter the view to show only TCP conversations.This view shows details about all TCP conversations in your capture, including:
- Source and destination addresses and ports
- Bytes transferred in each direction
- Duration of each conversation
- Packets in each direction
Look for the conversation that corresponds to our labex.io connection. It should involve the same IP addresses you observed in Step 2. You may also see other TCP conversations that were happening during your capture period.
Select the labex.io conversation and click the
Follow Streambutton at the bottom. This provides another way to access the same TCP stream we analyzed earlier.
Using TCP Stream Numbers
Each TCP stream in your capture has a unique identifier called the "tcp.stream" number. This provides a precise way to filter and analyze specific streams:
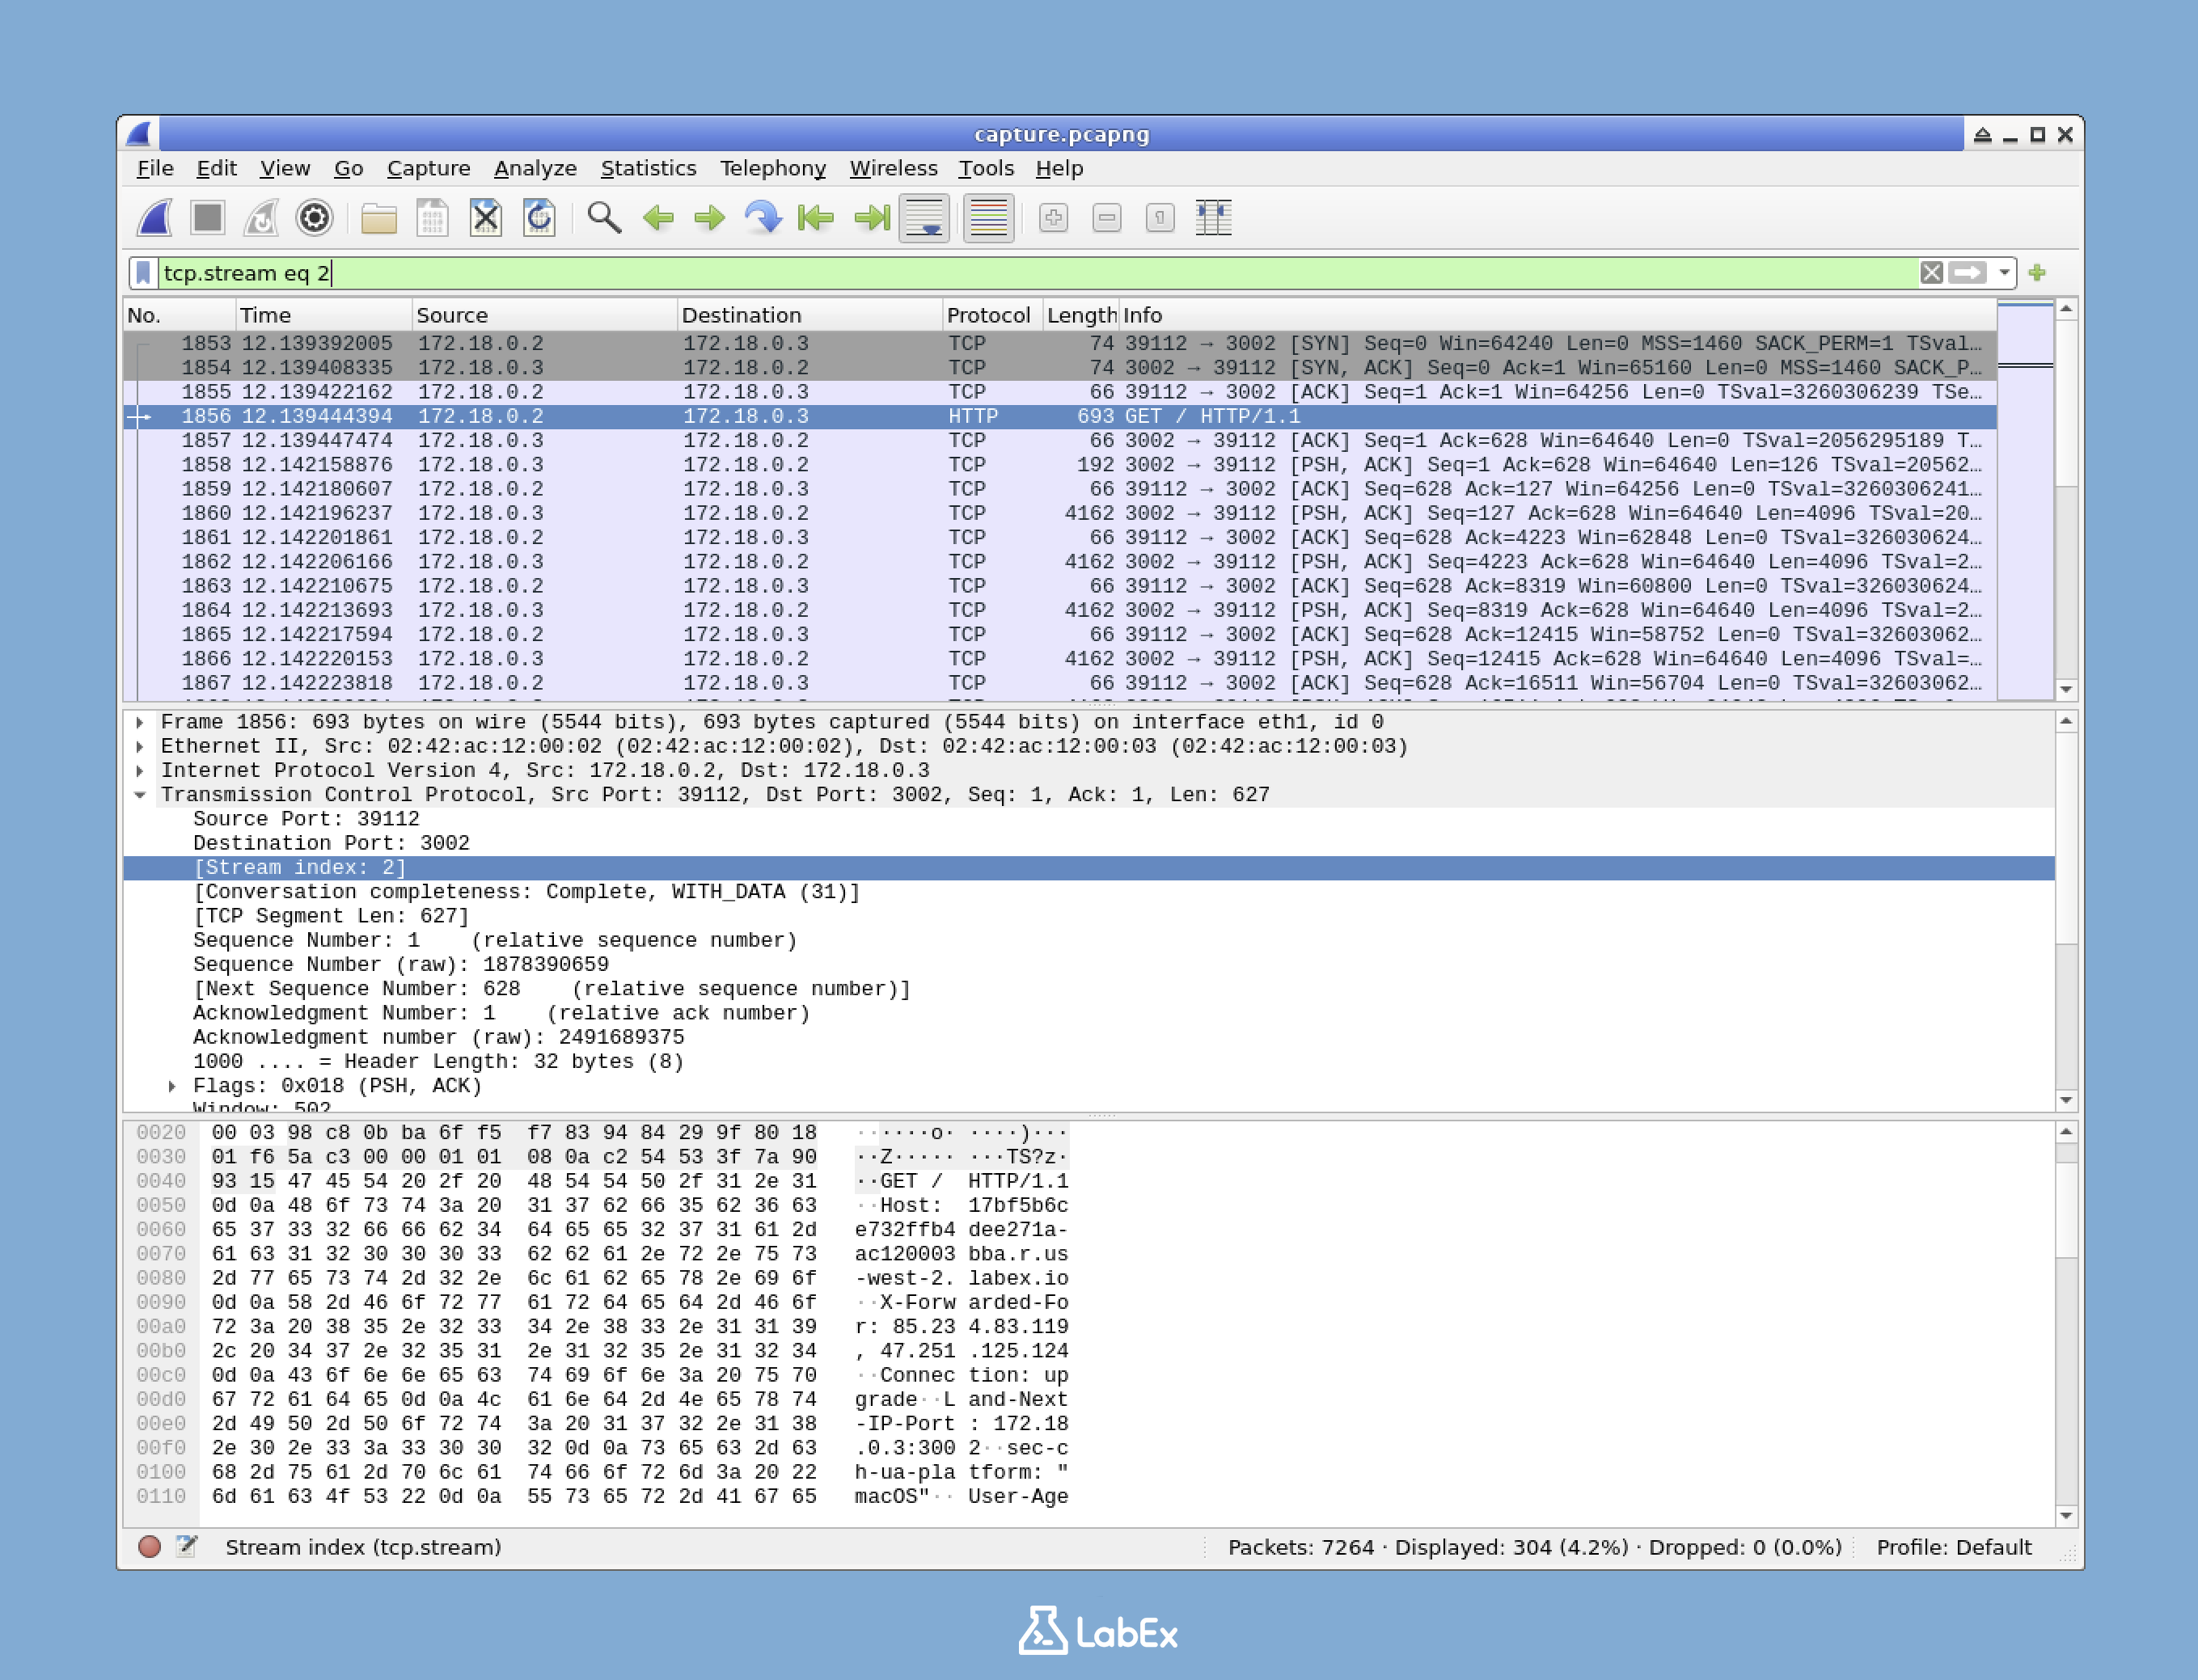
With the main Wireshark window open, look at the packet details of one of the labex.io packets you identified earlier. Expand the "Transmission Control Protocol" section in the middle pane, and look for a field called "Stream index" or similar. This number is the unique identifier for the labex.io TCP stream.
To filter packets belonging to this specific stream, use a display filter like this:
tcp.stream eq N
Replace N with the stream index number you found. For example, if the labex.io stream has index 0, you would use:
tcp.stream eq 2
Apply this filter in the display filter box. Wireshark will now show only the packets that belong to the labex.io TCP stream, providing a cleaner view of just this conversation.
This filter is especially useful when you have many TCP conversations in your capture and want to focus on a specific one without having to find and right-click on a packet each time.
By mastering these advanced TCP stream analysis techniques, you've enhanced your network traffic analysis capabilities significantly. You can now efficiently isolate, examine, and document TCP conversations in complex network captures, a skill that's invaluable for cybersecurity professionals.
Summary
In this lab, you have learned how to use Wireshark's "Follow TCP Stream" feature for in - depth network traffic analysis. You've gained hands - on experience in capturing network traffic, filtering TCP conversations, interpreting data in various formats, saving stream data for offline use, and applying advanced analysis techniques.
These skills are essential for network administrators, security analysts, and IT professionals. They enable you to troubleshoot network problems, investigate security incidents, and understand application behavior. As you progress, remember that Wireshark has many more features, and TCP Stream analysis is just one valuable tool in your cybersecurity arsenal.

