Introduction
In this project, you will learn how to create a real-time sales dashboard using the Echarts library. The dashboard will display the sales and volume data in a visually appealing and easy-to-understand format.
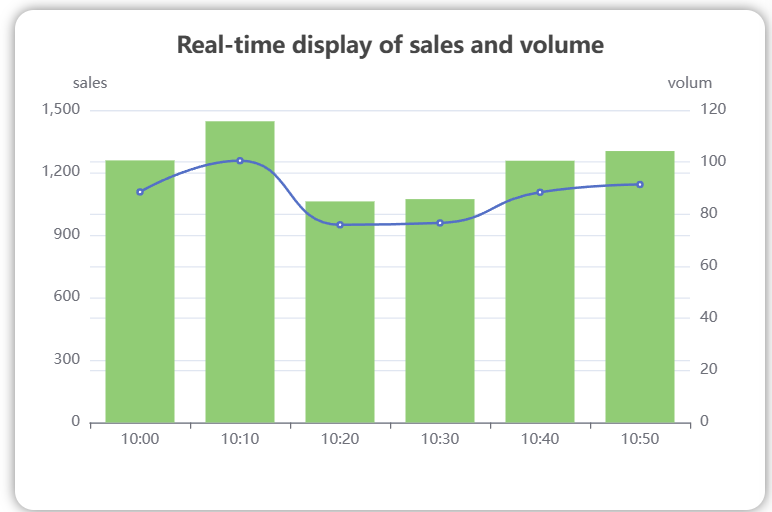
👀 Preview
🎯 Tasks
In this project, you will learn:
- How to set up the project and get the necessary files
- How to complete the "yAxis" setting in the
index.jsfile - How to correctly assign the values from the backend data to the appropriate chart options in the
renderChartfunction
🏆 Achievements
After completing this project, you will be able to:
- Render data into charts using the Echarts library
- Structure and organize your code for a data visualization project
- Work with asynchronous data retrieval and update the chart in real-time
Set Up the Project Structure
In this step, you will set up the project files and structure. Follow the steps below to complete this step:
Open the project folder. The directory structure is as follows:
├── echarts.js
├── index.css
├── index.html
└── index.js
Click on Go Live button in the bottom right corner of WebIDE, to run the project.
Next, open "Web 8080" on the top of the VM and manually refresh it to see the page.
Completing the yAxis Setting
In this step, you will learn how to complete the "yAxis" setting in the index.js file.
- Open the
index.jsfile. - Find the
yAxisconfiguration in theoptionobject. - Update the
yAxisconfiguration to meet the following requirements:- The first item should have
nameas "sales" andpositionon the left side of the chart. - The second item should have
nameas "volume" andpositionon the right side of the chart.
- The first item should have
Your updated yAxis configuration should look like this:
yAxis: [
  {
    type: "value",
    name: "sales",
    position: "left"
  },
  {
    type: "value",
    name: "volum",
    position: "right"
  }
],
Completing the renderChart Function
In this step, you will learn how to complete the renderChart function in the index.js file.
- Open the
index.jsfile. - Find the
renderChartfunction. - Complete the code in the
renderChartfunction to correctly assign the values fromsaleObjandcountObjto the time for the X-axis, and sales and volume for the Y-axis.
Your updated renderChart function should look like this:
async function renderChart() {
  const result = await Ajax();
  document.querySelector("#result").innerText = JSON.stringify(result);
  const myChart = echarts.init(document.getElementById("main"));

  // Assign the values from `saleObj` and `countObj` to the appropriate options
  option.xAxis.data = Object.keys(result.data.saleObj);
  option.series[0].data = Object.values(result.data.saleObj);
  option.series[1].data = Object.values(result.data.countObj);

  myChart.setOption(option, true);
  document.querySelector("#data").innerText = JSON.stringify(charData);
}
After completing these steps, your sales dashboard project should be fully functional and display the real-time sales and volume data correctly. The final page effect is as follows:
Summary
Congratulations! You have completed this project. You can practice more labs in LabEx to improve your skills.