In this lab, you will learn how to utilize Wireshark capture filters to selectively capture network traffic according to specific criteria. Capture filters are potent tools that enable you to concentrate on relevant data and eliminate irrelevant traffic, thus making your analysis more efficient.
You will explore different capture filter expressions and apply them to real - world scenarios. This hands - on experience will enhance your skills in network troubleshooting and security analysis.
This is a Guided Lab, which provides step-by-step instructions to help you learn and practice. Follow the instructions carefully to complete each step and gain hands-on experience. Historical data shows that this is a beginner level lab with a 80% completion rate. It has received a 95% positive review rate from learners.
Understanding Capture Filter Syntax
In the world of network analysis, dealing with a large amount of data can be overwhelming. That's where capture filters in Wireshark come in handy. Capture filters allow you to collect only specific packets that match your criteria. This significantly reduces the volume of data you need to analyze. It's important to note that capture filters are different from display filters. Display filters are used to filter already captured packets, while capture filters work during the packet - capturing process.
What are Capture Filters
Capture filters use the Berkeley Packet Filter (BPF) syntax. BPF is a specialized language designed for filtering network packets before they are processed by applications like Wireshark. By applying these filters, you can achieve several important goals:
Reduce the amount of data captured: Instead of capturing all the network traffic, you can focus on the relevant parts, which saves storage space and processing power.
Focus on specific types of traffic: You can target particular types of network activity, such as HTTP requests or SSH connections.
Improve performance during packet capture: With less data to handle, the packet - capturing process becomes faster and more efficient.
Simplify subsequent analysis: When you have a smaller and more relevant dataset, it's much easier to analyze and draw conclusions.
Basic Capture Filter Syntax
Capture filters in Wireshark use a specific syntax based on the libpcap filter language. Let's take a look at some common elements:
host: This element filters traffic based on the IP address or hostname. For example, if you use the filter host 192.168.0.2, Wireshark will capture all the traffic to or from the specified IP address.
net: It filters traffic based on a network address and subnet mask. For instance, the filter net 10.0.0.0/24 will capture traffic from the 10.0.0.0/24 network.
port: This filters traffic based on the port number. For example, port 80 is used to capture HTTP traffic because HTTP typically uses port 80.
protocol: It filters traffic based on the protocol. For example, tcp will capture all TCP traffic, and udp will capture all UDP traffic.
You can combine these elements using logical operators:
and or &&: When you use this operator, both conditions must be true for a packet to be captured.
or or ||: With this operator, either of the conditions can be true for a packet to be captured.
not or !: This operator negates a condition. So, if you use not tcp, it will capture all non - TCP traffic.
Let's Practice with a Simple Filter
Now, let's put what we've learned into practice. Follow these steps to open Wireshark and apply a basic capture filter:
First, you need to open a terminal. You can do this by clicking on the terminal icon in the desktop taskbar or by pressing Ctrl+Alt+T.
Once the terminal is open, type the following command to launch Wireshark:
wireshark
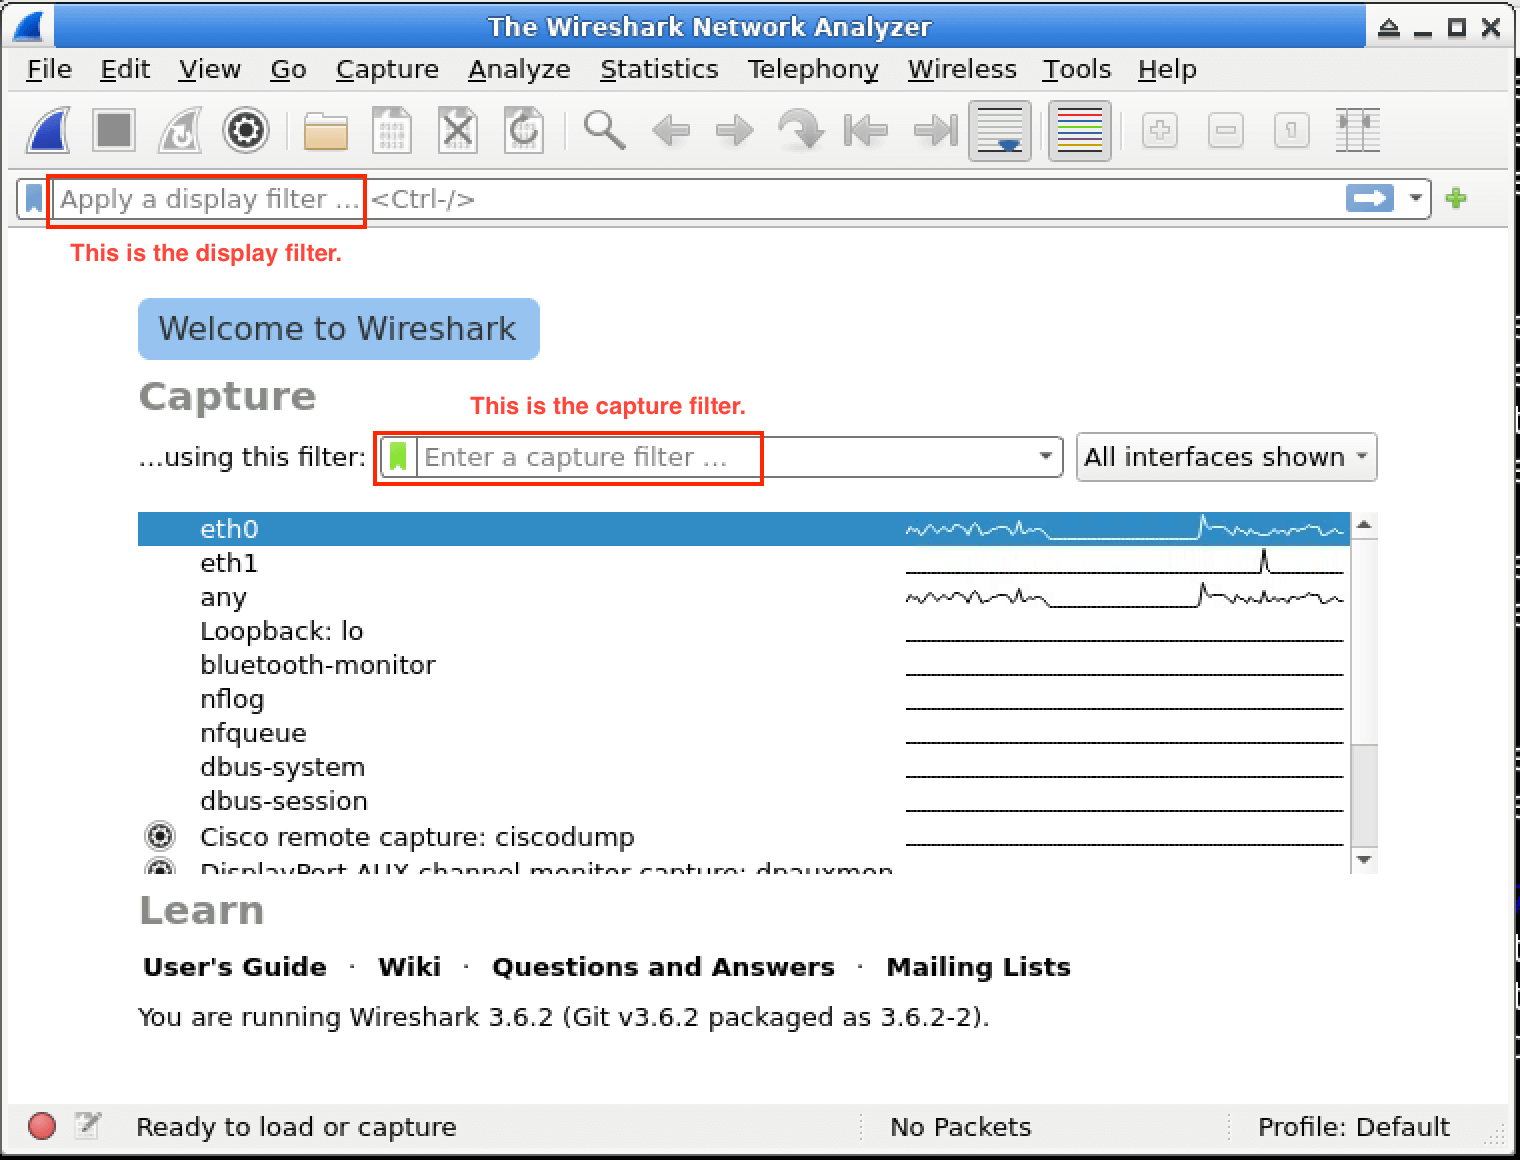
When Wireshark opens, you'll see the main startup screen. This screen shows all the available network interfaces on your system.
Look for the "Capture Filter:" input field at the top of the Wireshark window. This is where you'll enter your capture filter.
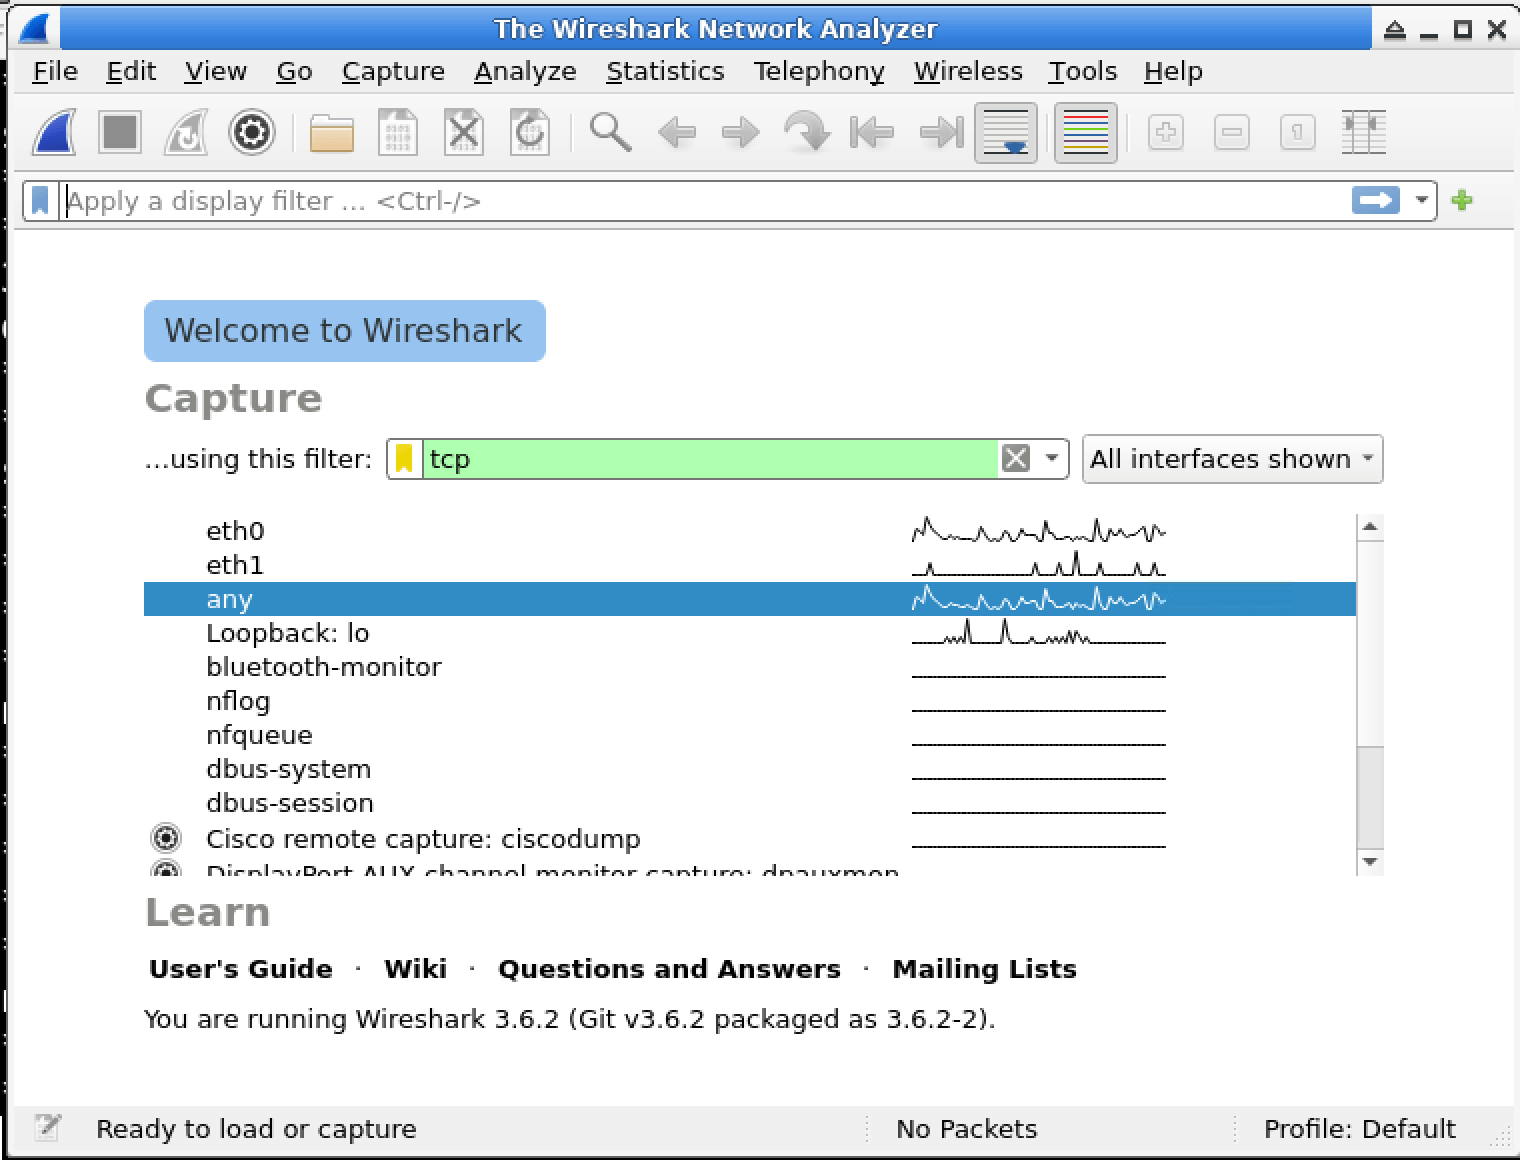
Type tcp in the filter box. By doing this, you're telling Wireshark to capture only TCP packets.
From the list of interfaces, choose the one labeled any. Selecting any means that Wireshark will capture packets on all network interfaces.
Click the blue shark fin Start button. This will start the packet - capturing process with the filter you've applied.
Let Wireshark run for about 10 - 15 seconds. During this time, it will capture some TCP packets. You should start to see packets appearing in the main window.
To stop the capture, click the red square Stop button in the toolbar.
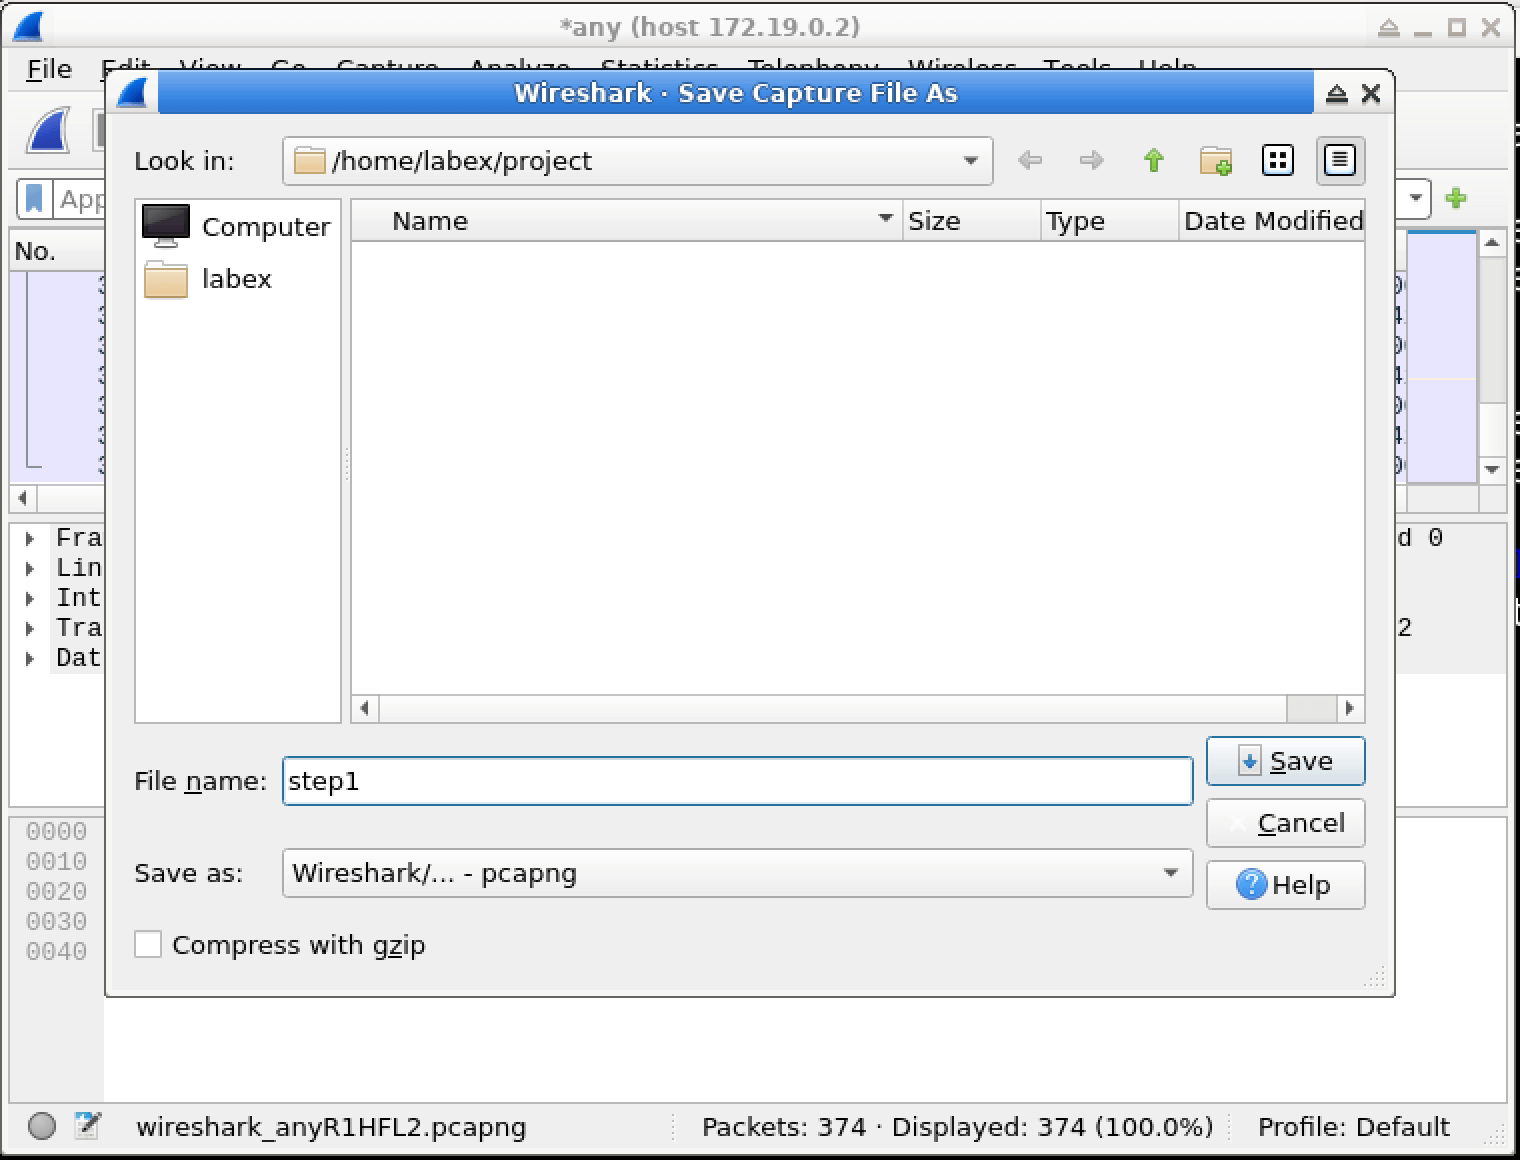
Now, you want to save the captured packets for later analysis. Click on File > Save As in the menu bar.
In the file save dialog, navigate to the directory /home/labex/project.
Enter step1.pcapng as the filename and click Save.
You have now successfully applied a basic capture filter to collect only TCP packets and saved the results for later analysis.
Applying Capture Filters for Specific Traffic
In this step, we're going to focus on capturing specific network traffic. Specifically, you'll learn how to apply a more specific capture filter to capture HTTP traffic on port 80. HTTP traffic on port 80 is very common on the internet, as it's used for unencrypted web communication. After setting up the filter, you'll use a script to generate some test traffic. This will help you see how the filter works in a real - world scenario.
Creating a New Capture with a Specific Filter
First, let's set up a new capture with a filter for port 80. Before we start a new capture, we need to make sure there are no previous captures open.
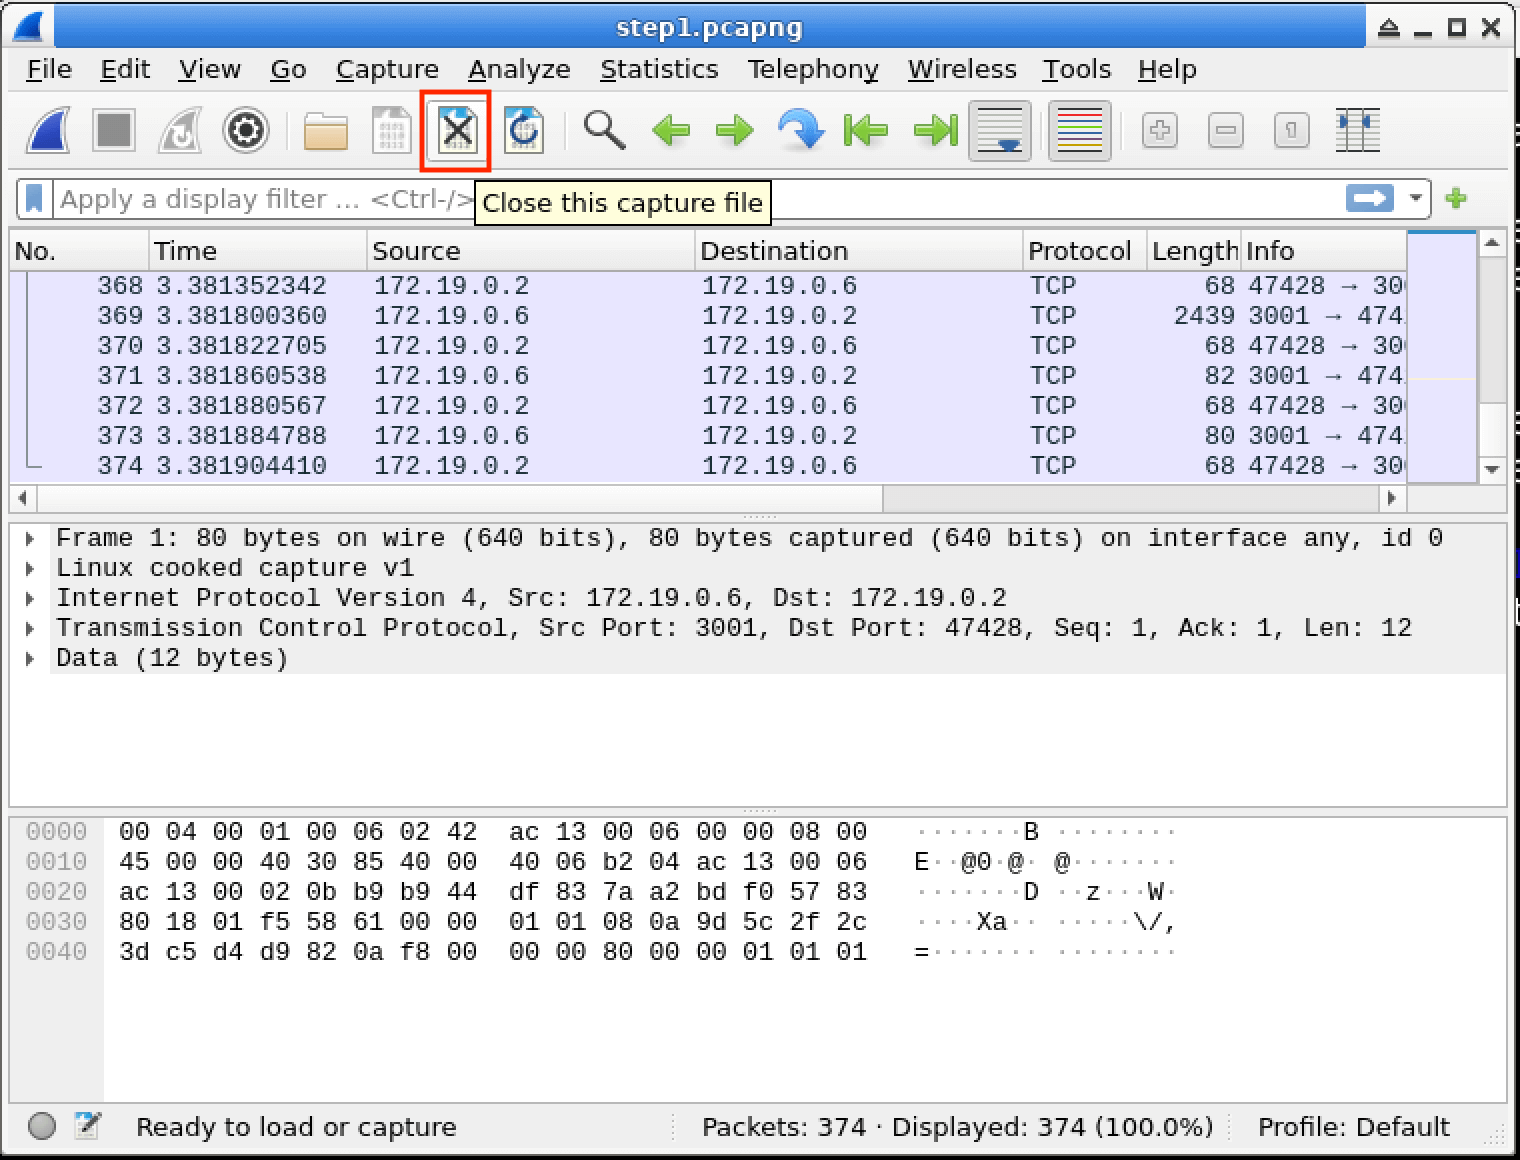
If you still have the previous capture open, close it by clicking on File > Close or by clicking the Close this capture file button (X) in the top - right corner of the packet list. This step is important because having multiple captures open can cause confusion and might affect the accuracy of your new capture.
Once you've closed the previous capture, you should now see the Wireshark welcome screen showing available interfaces. This screen is where you'll start configuring your new capture.
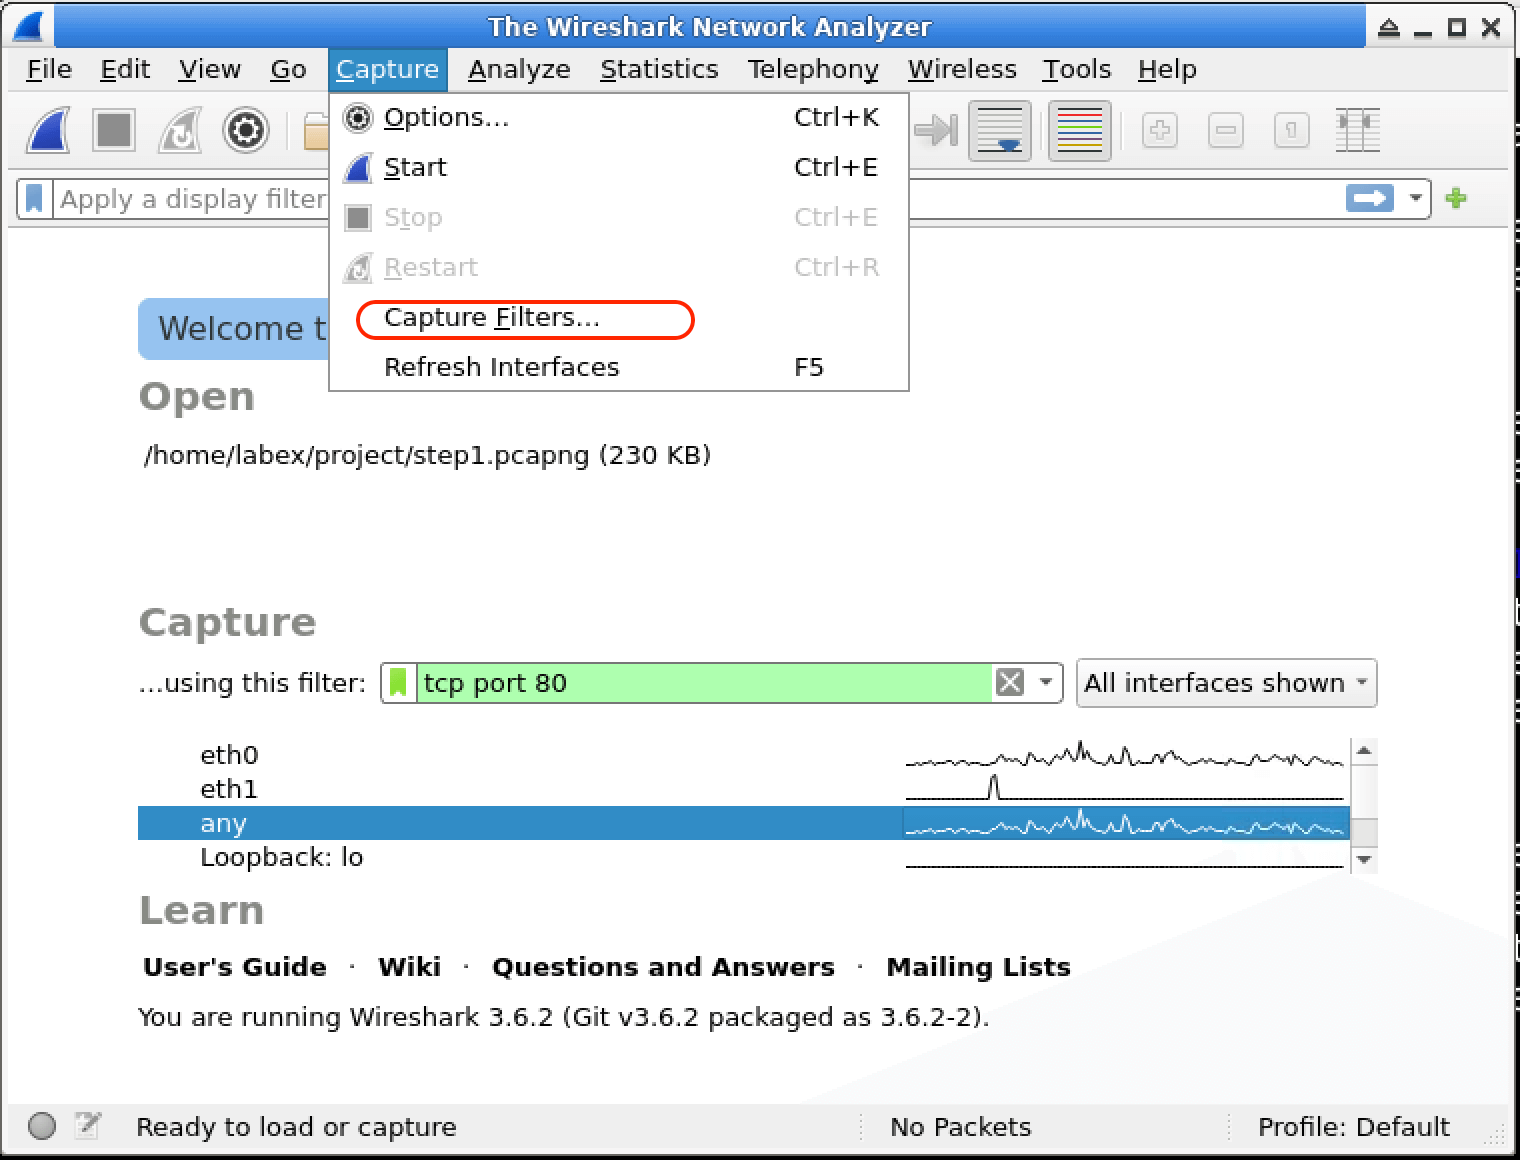
We'll use a more detailed method to set the capture filter this time. Click on the Capture Options button (or go to Capture > Options in the menu). The Capture Options dialog gives you more control over how Wireshark captures packets, including setting the capture filter.
In the Capture Options dialog, you'll see a list of interfaces and a Capture Filter input box at the bottom. The interfaces represent the network connections available on your system, and the Capture Filter box is where you'll specify the conditions for the packets you want to capture.
Click on the Capture Filter box and enter the filter: tcp port 80. This filter will capture only TCP traffic that uses port 80. By specifying tcp port 80, we're being more specific than just using port 80 - we're telling Wireshark to only capture TCP packets related to HTTP traffic on this port, excluding any UDP traffic that might also use port 80. This is more precise for HTTP traffic analysis since HTTP typically uses TCP as its transport protocol.
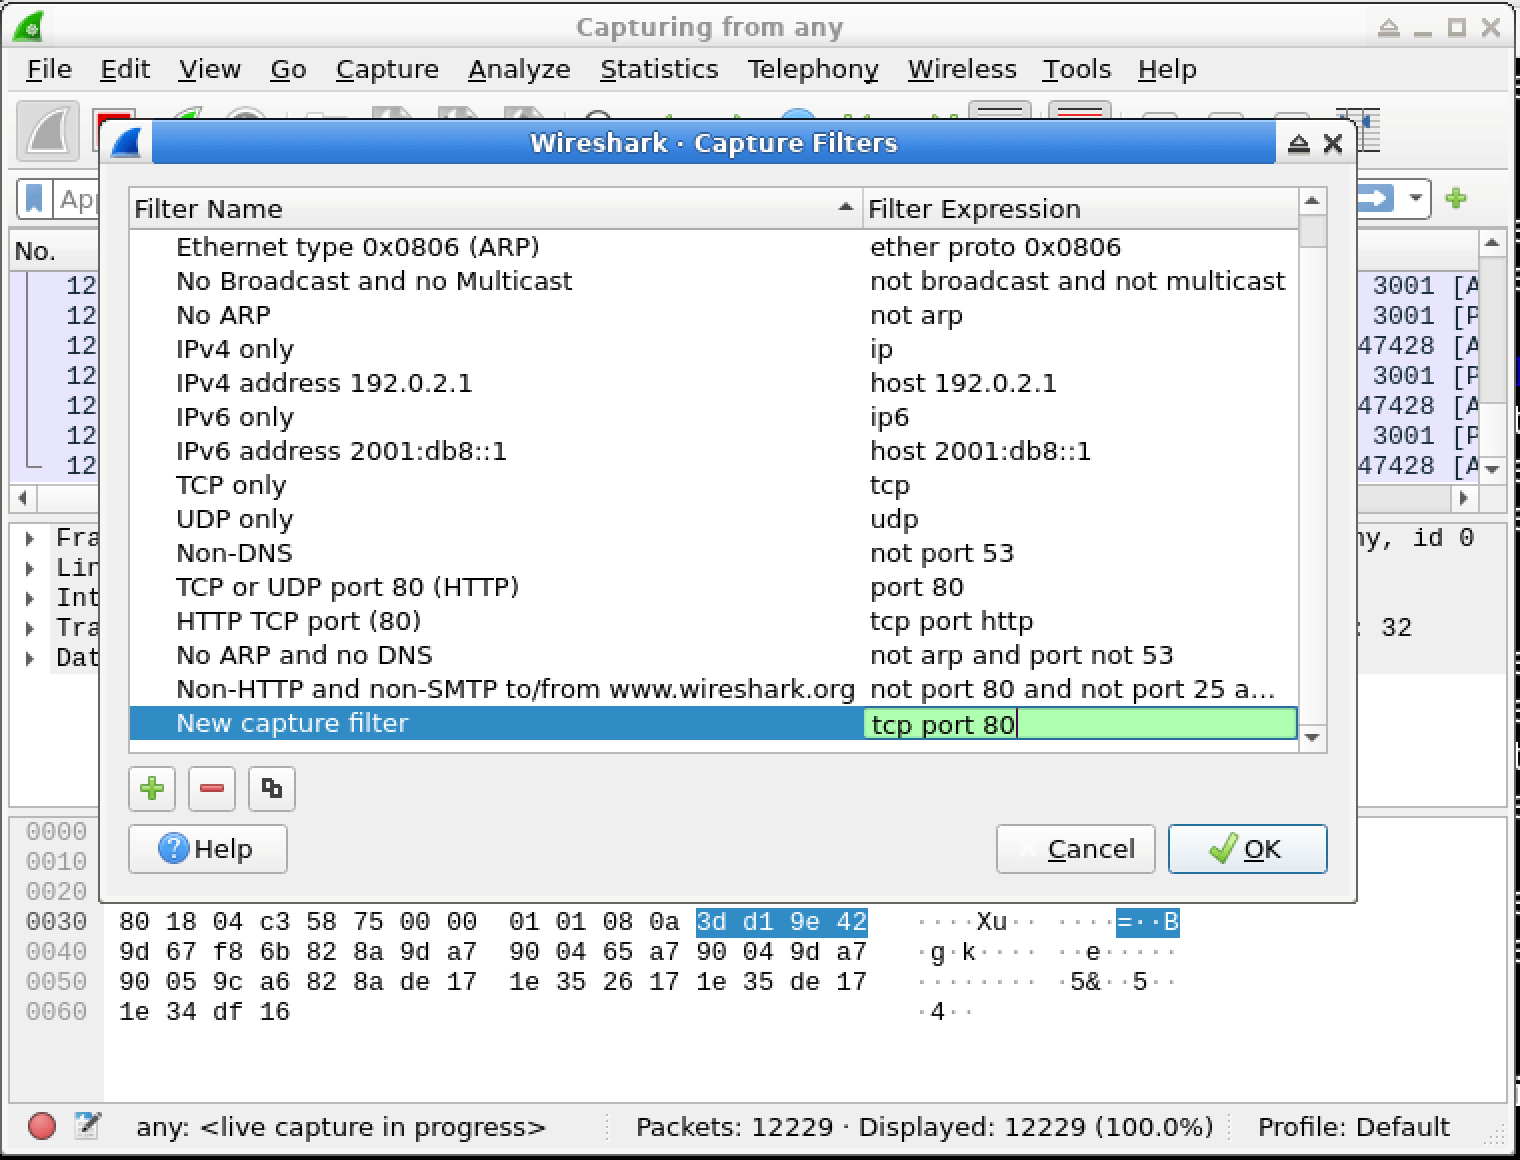
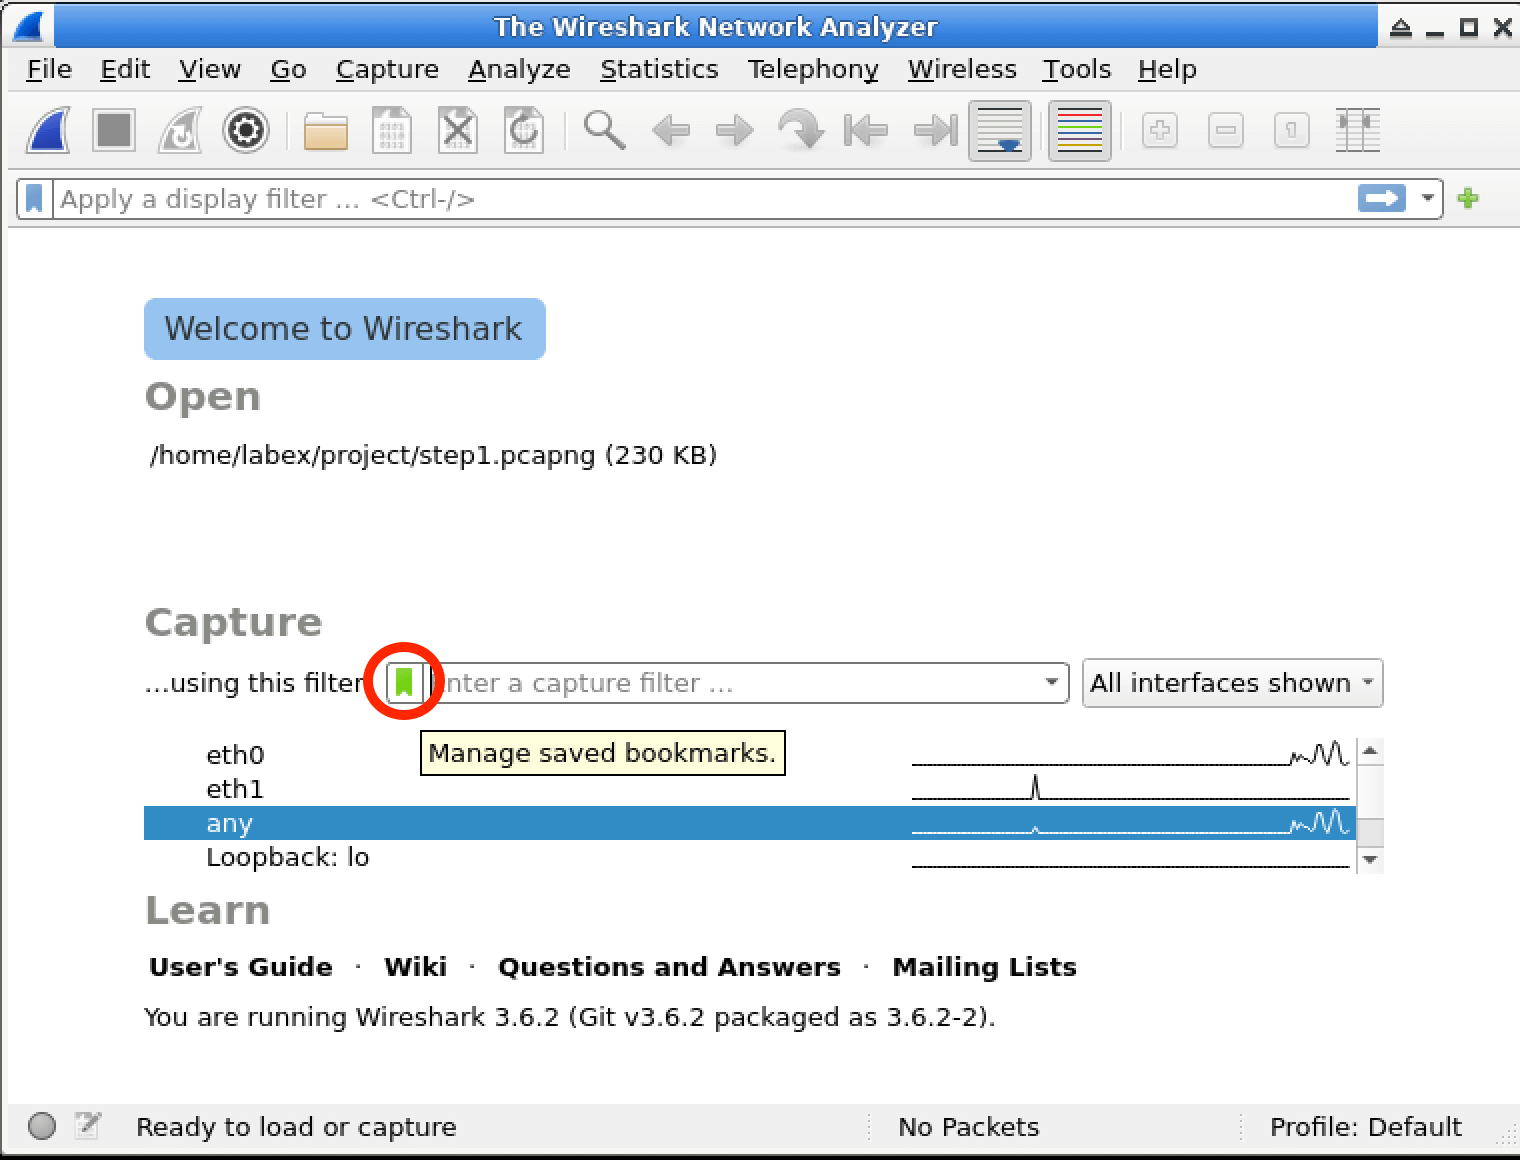
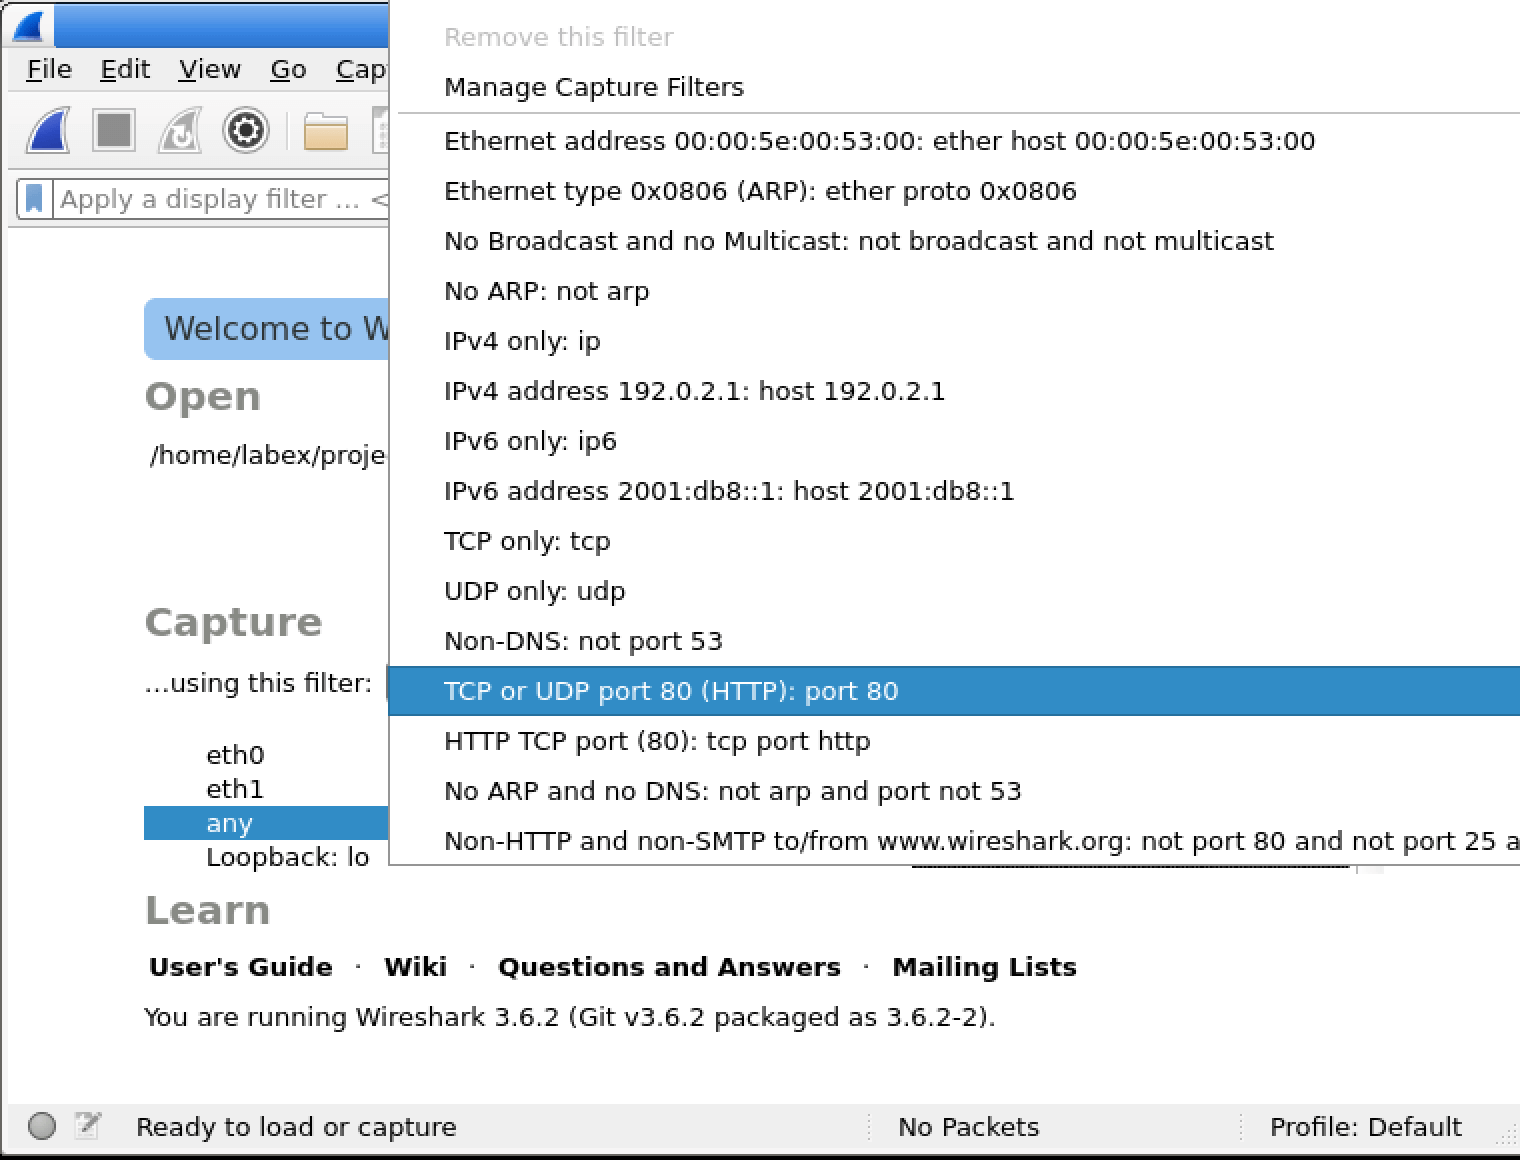
Alternatively, you can click on the Capture Filter: button to select from saved filter bookmarks. This can be useful if you have a set of filters that you use frequently.
In the filter selection dialog, you can choose from predefined filters or create a new one. For now, just enter port 80 directly in the filter box. This ensures that we're capturing the specific traffic we're interested in.
Make sure the interface any is selected and click the Start button to begin capturing packets matching the filter. Selecting any means that Wireshark will capture packets from all available network interfaces.
Generating Test Traffic
Now that Wireshark is capturing traffic on port 80, let's generate some test traffic to see the filter in action. This will help you confirm that the filter is working as expected.
Open a new terminal window by clicking on the terminal icon in the taskbar or pressing Ctrl+Alt+T. The terminal is where you'll run commands to generate the test traffic.
In the new terminal, navigate to the project directory:
cd /home/labex/project
This command changes the current working directory to the project directory where the script for generating traffic is located.
Run the pre - created script to generate simulated HTTP traffic:
./simulate_traffic.sh
This script is designed to create a simple server listening on port 80 and send some data to it, simulating real - world HTTP traffic.
You should see output similar to this:
Netcat server listening on port 80...
Sending data to port 80...
Please check the Wireshark output for the data sent to port 80.
This output indicates that the script is working correctly and that data is being sent to port 80.
This script creates a simple server listening on port 80 and sends a short "Hello, Wireshark!" message to it. This message will be captured by Wireshark if the filter is working correctly.
Analyzing the Captured Traffic
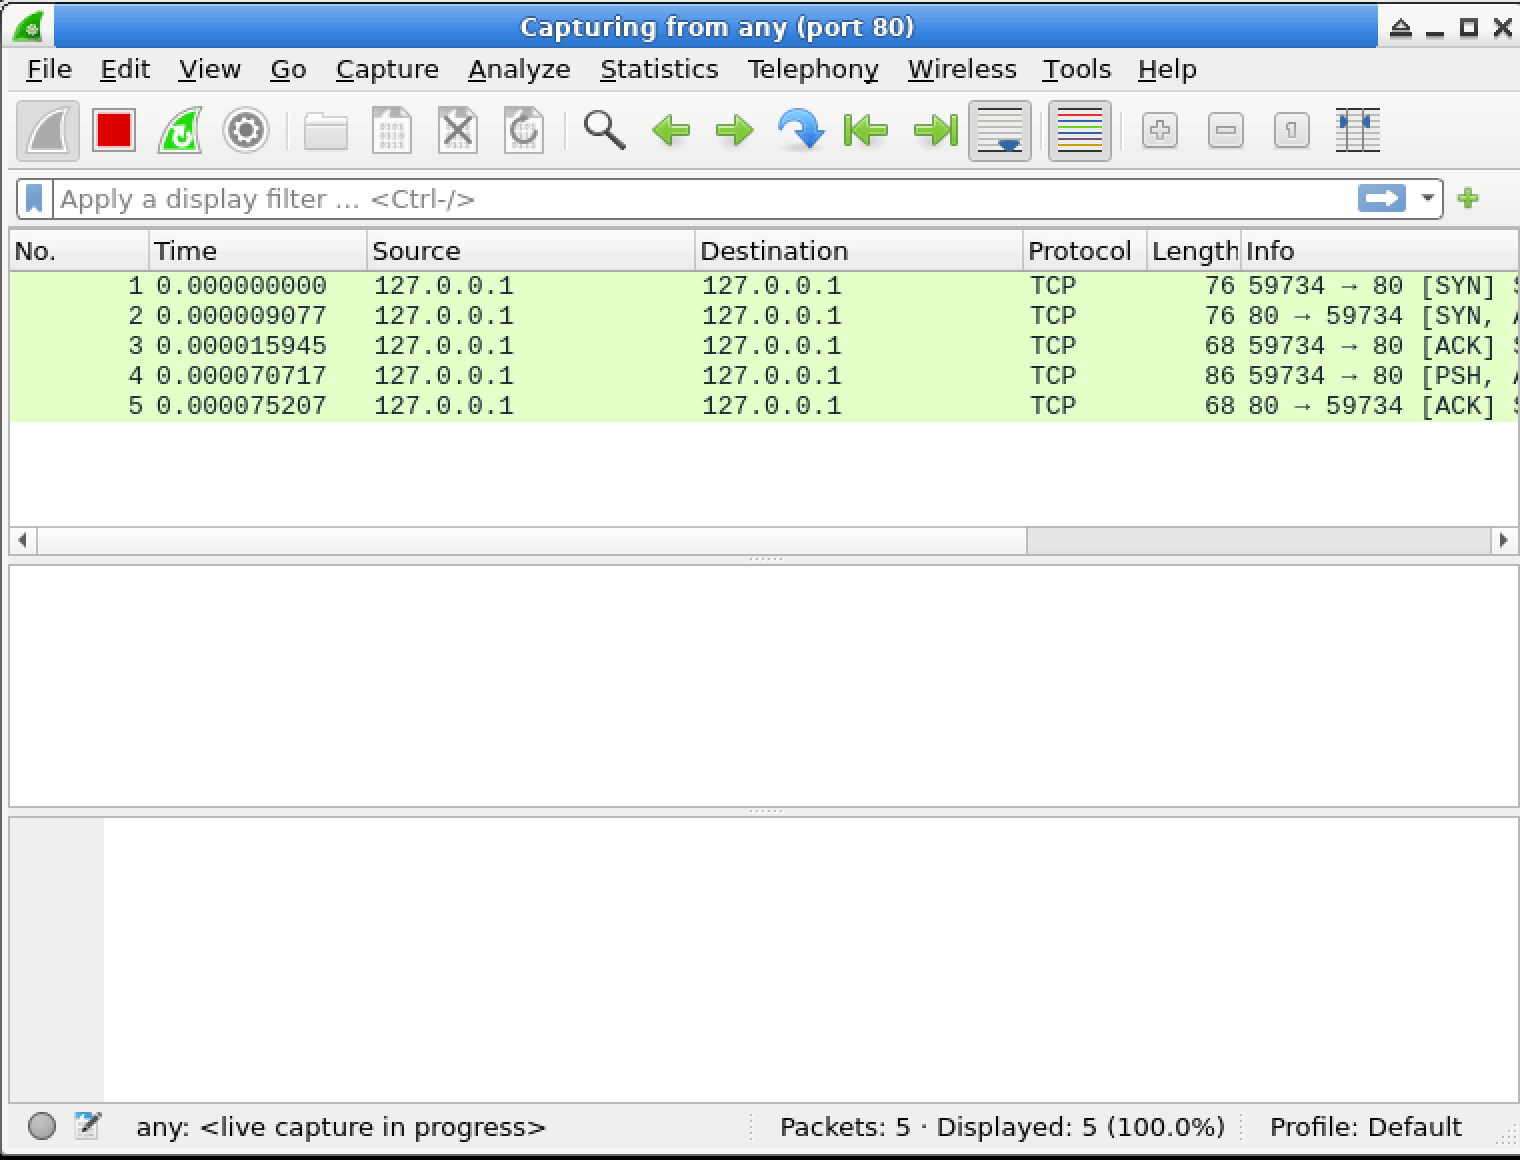
Return to the Wireshark window. You should see the packets that were generated by the script. These packets are the result of the test traffic we just generated.
These packets should show communication on port 80, matching our capture filter. This confirms that the filter is working as expected.
In the packet list, you should see at least 3 packets:
TCP SYN packet to establish the connection: This is the first step in the TCP three - way handshake, where the client requests to establish a connection with the server.
TCP SYN - ACK packet to acknowledge the connection: The server responds to the client's SYN request, indicating that it's ready to establish a connection.
TCP packet containing the "Hello, Wireshark!" data: This is the actual data packet that contains the message sent by the script.
Click on one of the packets to see its details in the middle pane. You can expand sections by clicking on the arrow icons. This allows you to view the different parts of the packet, such as the headers and the data.
Now stop the capture by clicking the red square Stop button in the toolbar. Stopping the capture is important so that you can start analyzing the captured packets without new packets being added.
Save the captured packets by clicking on File > Save As in the menu bar. Saving the packets allows you to refer back to them later for further analysis.
Navigate to the directory /home/labex/project in the file save dialog. This is the directory where we want to store the captured packets.
Enter step2.pcapng as the filename and click Save. The .pcapng file format is a common format for storing network packet captures.
You have successfully applied a specific capture filter to collect only traffic on port 80 and observed real traffic that matches this filter.
Analyzing Captured Traffic with Display Filters
In this step, we're going to learn how to use display filters to analyze the traffic you've already captured. Before we start, it's important to understand the difference between capture filters and display filters. Capture filters are used to decide what traffic gets collected in the first place. Display filters, on the other hand, let you focus on specific parts of the packets that have already been captured. They're like a magnifying glass for your captured data, helping you zero in on the details you're interested in.
Understanding the Difference Between Capture and Display Filters
Let's take a closer look at the difference between capture and display filters.
Capture filters are applied before packets are recorded. They use Berkeley Packet Filter (BPF) syntax. Think of capture filters as a gatekeeper at the entrance. They decide which packets are allowed to enter and be captured.
Display filters are applied to packets that have already been captured. They use Wireshark's own syntax. Display filters are like a spotlight that highlights specific packets among the ones that have already been captured.
Display filters are more powerful and flexible than capture filters. They allow you to perform more complex searches and analysis on the captured data.
Display filters do not reduce the amount of data captured. They only control what is shown in the interface. So, the original captured data remains intact, and you can change the display filter as many times as you want to view different aspects of the data.
Opening Your Captured File
Now, let's open the file that contains the packets you captured earlier.
If you still have Wireshark open from the previous step, you can proceed directly. Otherwise, open Wireshark and then open the file you saved in Step 2.
To open a previously saved file in Wireshark:
Click on File > Open in the menu bar. This is a common way to access files in many software applications.
Navigate to /home/labex/project directory. This is where the captured file is stored.
Select the step2.pcapng file and click Open. The .pcapng file format is commonly used to store network packet data.
After opening the file, you should now see the packets you captured in Step 2 displayed in Wireshark. This is the data that we'll be analyzing using display filters.
Applying Display Filters
Next, we'll apply display filters to the captured packets.
Locate the display filter toolbar at the top of the Wireshark window. This is different from the capture filter you used earlier. It has a light green background when active. The display filter toolbar is where you'll enter the filter expressions to show specific packets.
In the display filter field, type tcp and press Enter or click the right arrow button. By typing tcp, we're telling Wireshark to only show the packets that use the TCP protocol. This will show only TCP packets in the display, filtering out any other protocol packets if they exist.
Notice how the packets are immediately filtered in the display without requiring a new capture. This is one of the advantages of using display filters. You can quickly analyze different aspects of the captured data without having to capture the traffic again.
Now, let's try a more specific display filter. Clear the current filter by clicking the X button on the right side of the filter bar. This will remove the previous filter and show all the captured packets again.
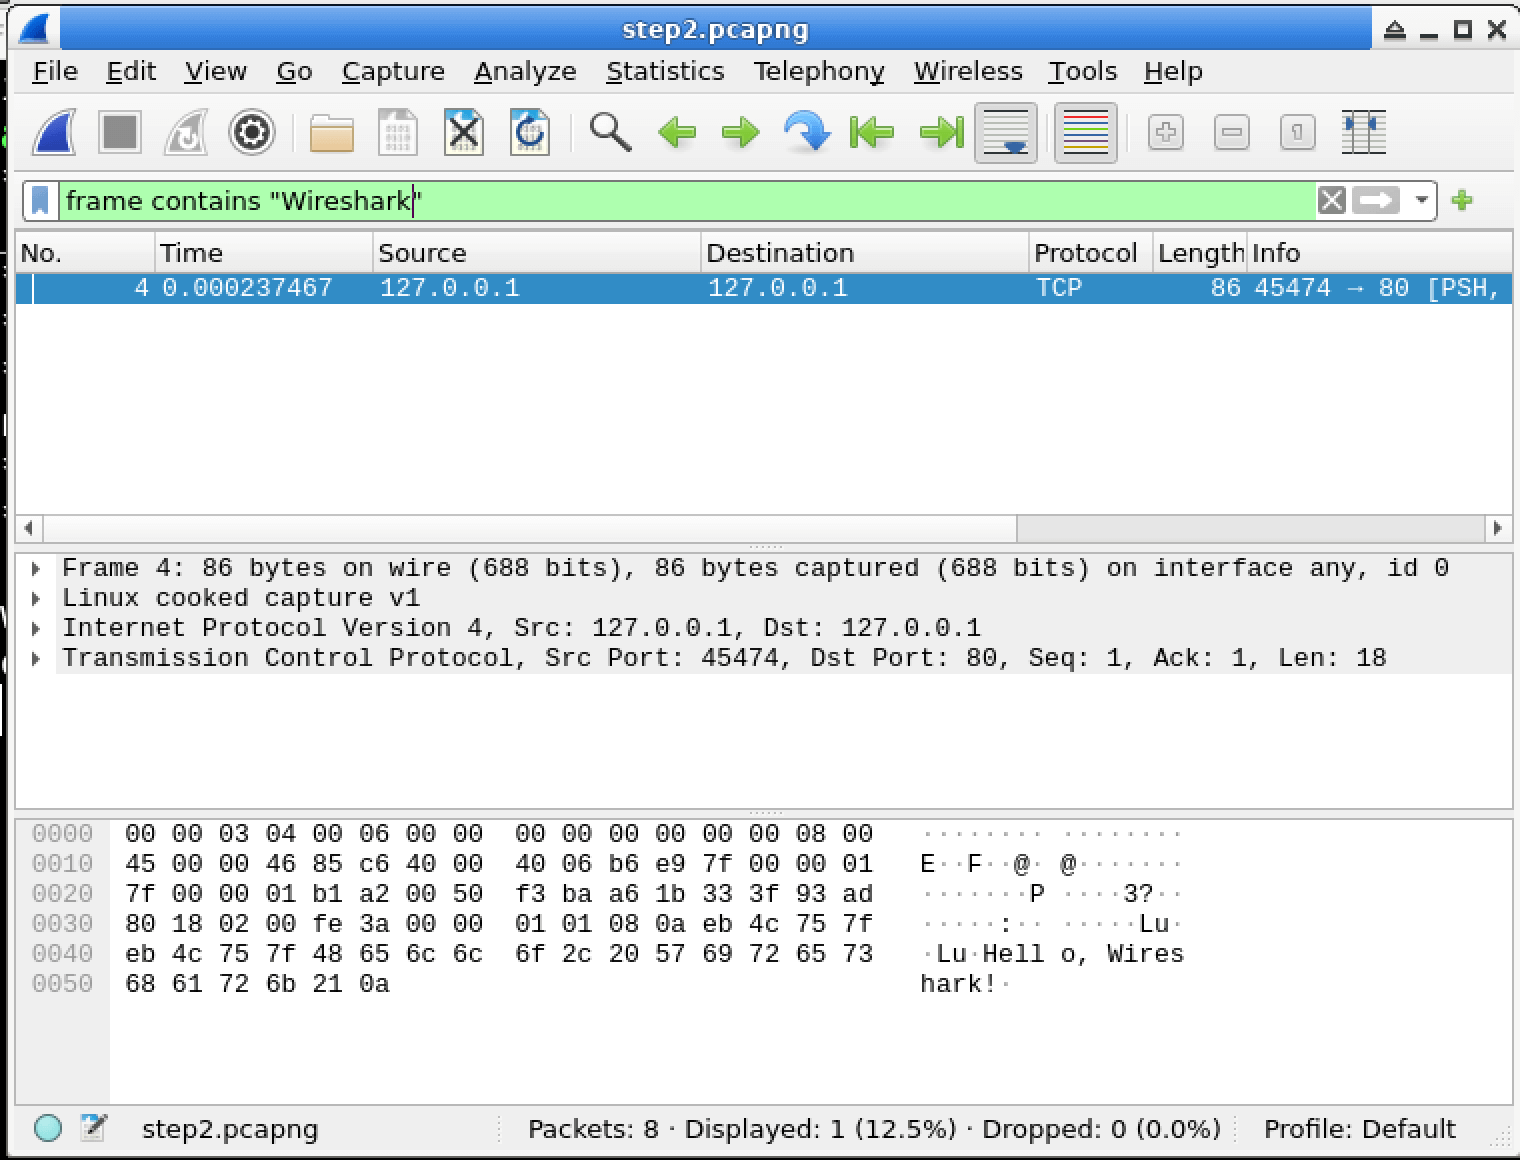
Enter the following filter to display packets containing the word "Wireshark":
frame contains "Wireshark"
This filter searches for the word "Wireshark" in the frame data of the packets.
Press Enter or click the right arrow to apply the filter.
You should now see only the packets that contain the text "Wireshark" - likely just one or two packets that contain our "Hello, Wireshark!" message. This shows how display filters can be used to find specific information within the captured packets.
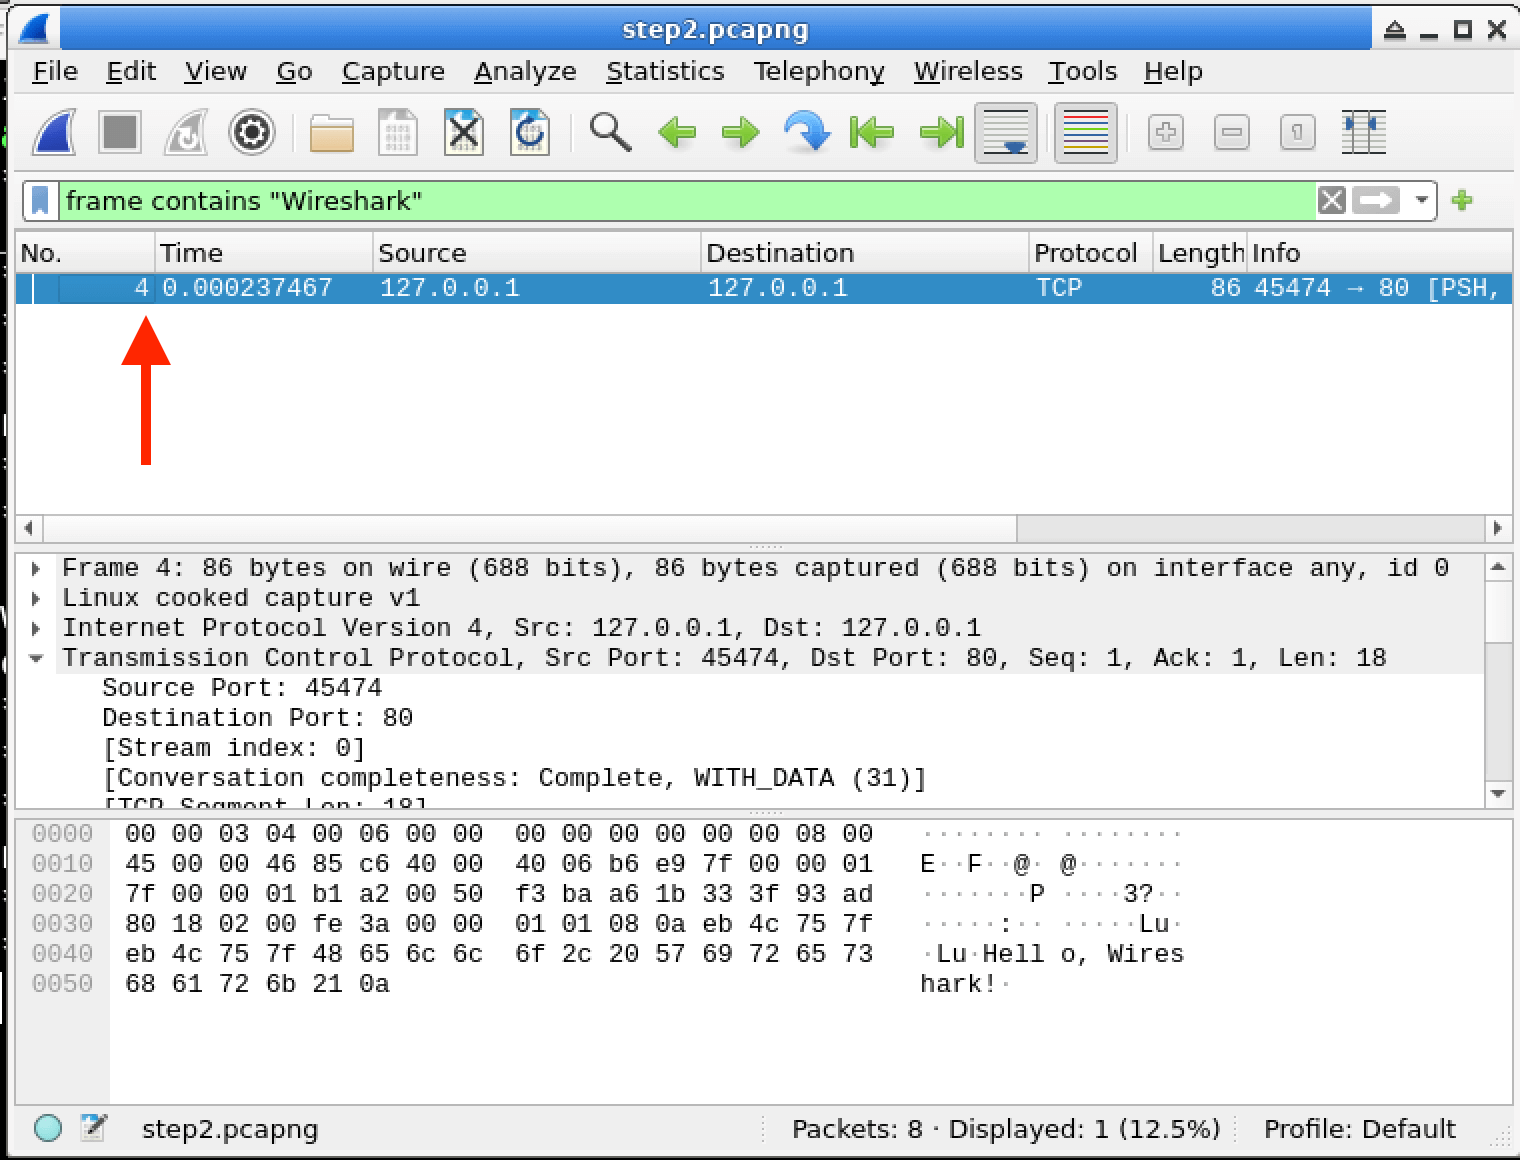
If you click on one of these packets in the packet list, you can see its details in the middle pane. Look for the "Data" section which should show the "Hello, Wireshark!" text. This allows you to examine the content of the packets in more detail.
Creating a Report
Now that you've analyzed the traffic using display filters, let's create a simple report documenting what you found.
Count the number of packets that match the frame contains "Wireshark" filter. The number should be displayed in the status bar at the bottom of the Wireshark window, showing something like "Displayed: X of Y packets". This number represents the number of packets that contain the word "Wireshark".
Open a terminal window by clicking on the terminal icon in the taskbar or pressing Ctrl+Alt+T. The terminal is a powerful tool that allows you to run commands on your computer.
In the terminal, create a report file with the packet count information:
echo "Number of packets matching the filter expression: 1" > /home/labex/project/report.txt
Note: Replace 1 in the command above with the actual number of packets you observed matching the filter. This number may vary depending on how the script ran.
You have now successfully applied display filters to analyze captured network traffic and documented your findings in a report file.
Summary
In this lab, you have learned how to use Wireshark capture filters to selectively capture and analyze network traffic according to specific criteria. You practiced key skills such as understanding the basic syntax of capture filters based on the Berkeley Packet Filter language, applying them during live captures, and distinguishing between capture and display filters.
These skills are crucial for network administrators, security analysts, and IT professionals dealing with network issues or security incidents. Mastering capture filters enables more efficient network analysis by focusing on relevant traffic. As you progress in network analysis, you can build on these skills to create complex filters for sophisticated traffic selection in complex environments.