
はじめに
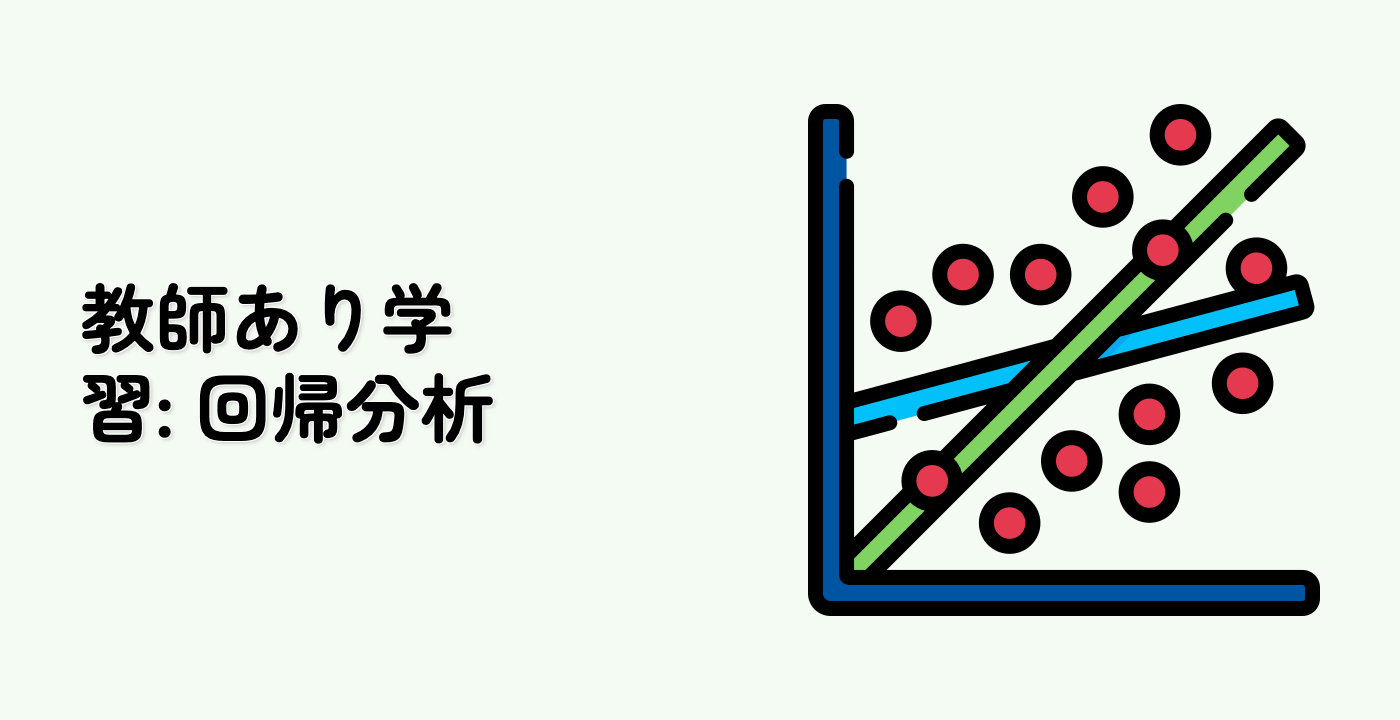
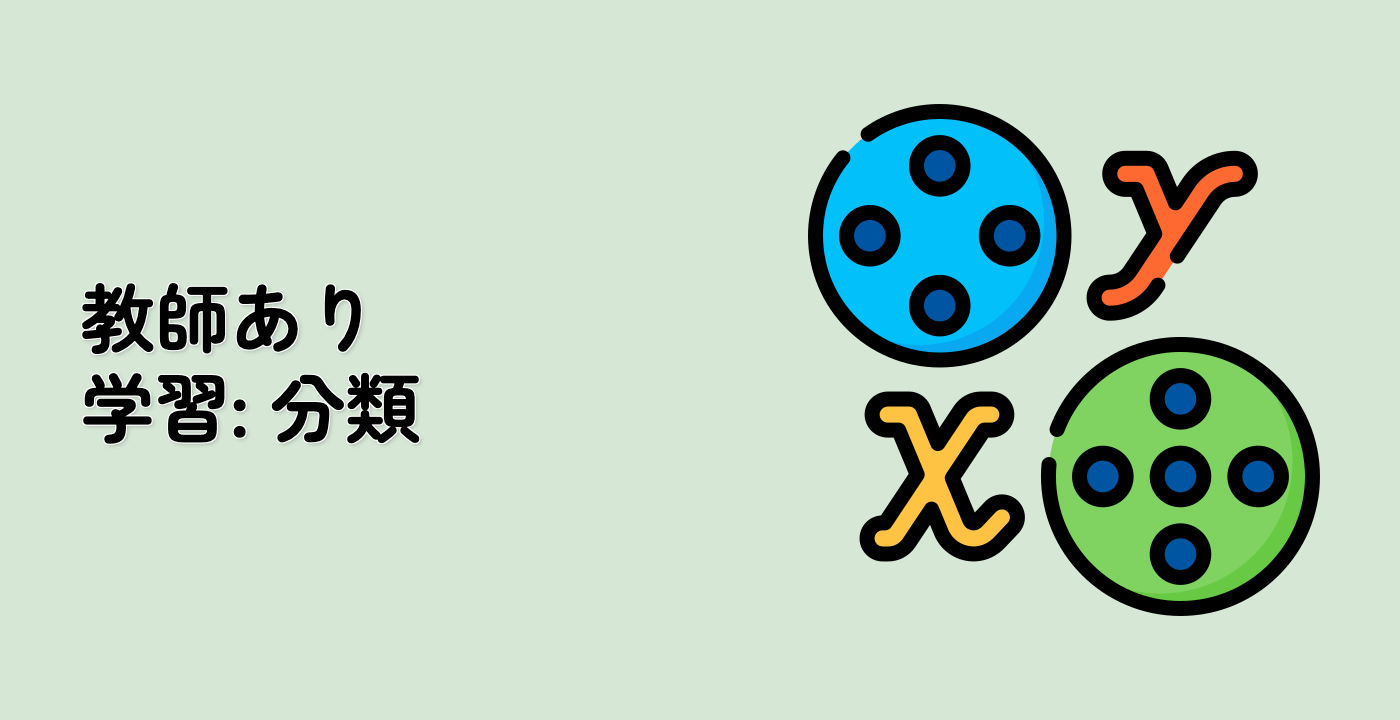
この実験では、Pythonのscikit - learnライブラリを使ってロジスティック回帰モデルを作成する方法について、手順を追って案内します。
VMのヒント
VMの起動が完了したら、左上隅をクリックしてノートブックタブに切り替え、Jupyter Notebookを使って練習しましょう。
時々、Jupyter Notebookが読み込み終わるまで数秒待つ必要があります。Jupyter Notebookの制限により、操作の検証を自動化することはできません。
学習中に問題に遭遇した場合は、Labbyにお尋ねください。セッション後にフィードバックを提供してください。そうすれば、迅速に問題を解決いたします。
Skills Graph
%%%%{init: {'theme':'neutral'}}%%%%
flowchart RL
sklearn(("Sklearn")) -.-> sklearn/CoreModelsandAlgorithmsGroup(["Core Models and Algorithms"])
ml(("Machine Learning")) -.-> ml/FrameworkandSoftwareGroup(["Framework and Software"])
sklearn/CoreModelsandAlgorithmsGroup -.-> sklearn/linear_model("Linear Models")
ml/FrameworkandSoftwareGroup -.-> ml/sklearn("scikit-learn")
subgraph Lab Skills
sklearn/linear_model -.-> lab-49205{{"ロジスティック回帰モデル"}}
ml/sklearn -.-> lab-49205{{"ロジスティック回帰モデル"}}
end