Einführung
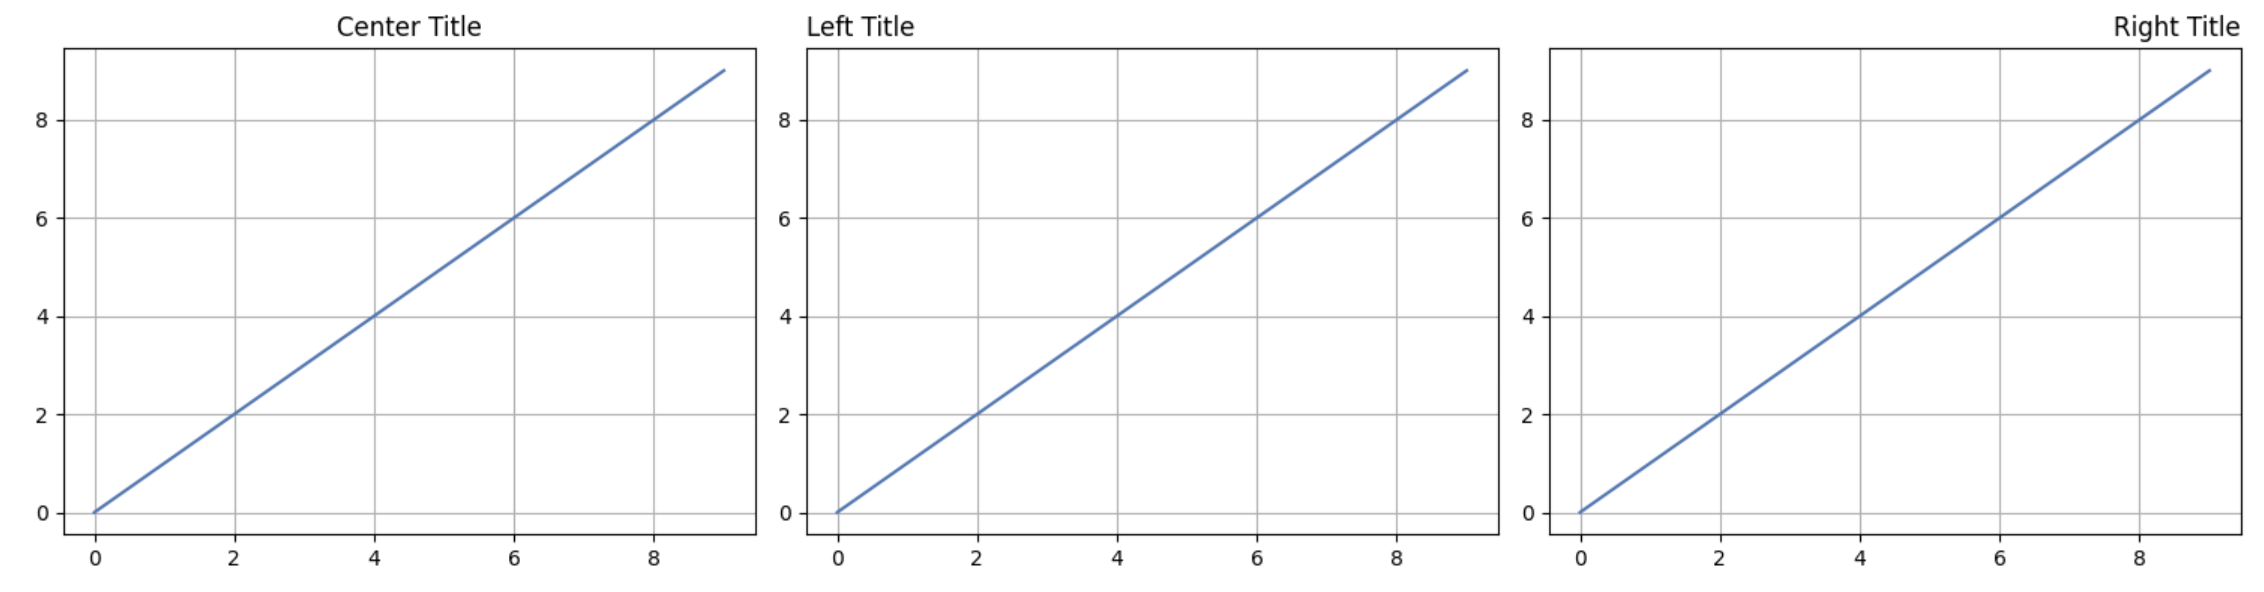
In diesem Lab lernen Sie, wie Sie Titel auf mit Matplotlib erstellten Diagrammen positionieren können. Diagrammtitel helfen den Betrachtern zu verstehen, welche Informationen eine Visualisierung vermittelt. Matplotlib bietet mehrere Optionen für die Positionierung dieser Titel - zentriert (die Standardeinstellung), linksbündig, rechtsbündig oder mit benutzerdefinierter vertikaler Positionierung.
Am Ende dieses Labs können Sie:
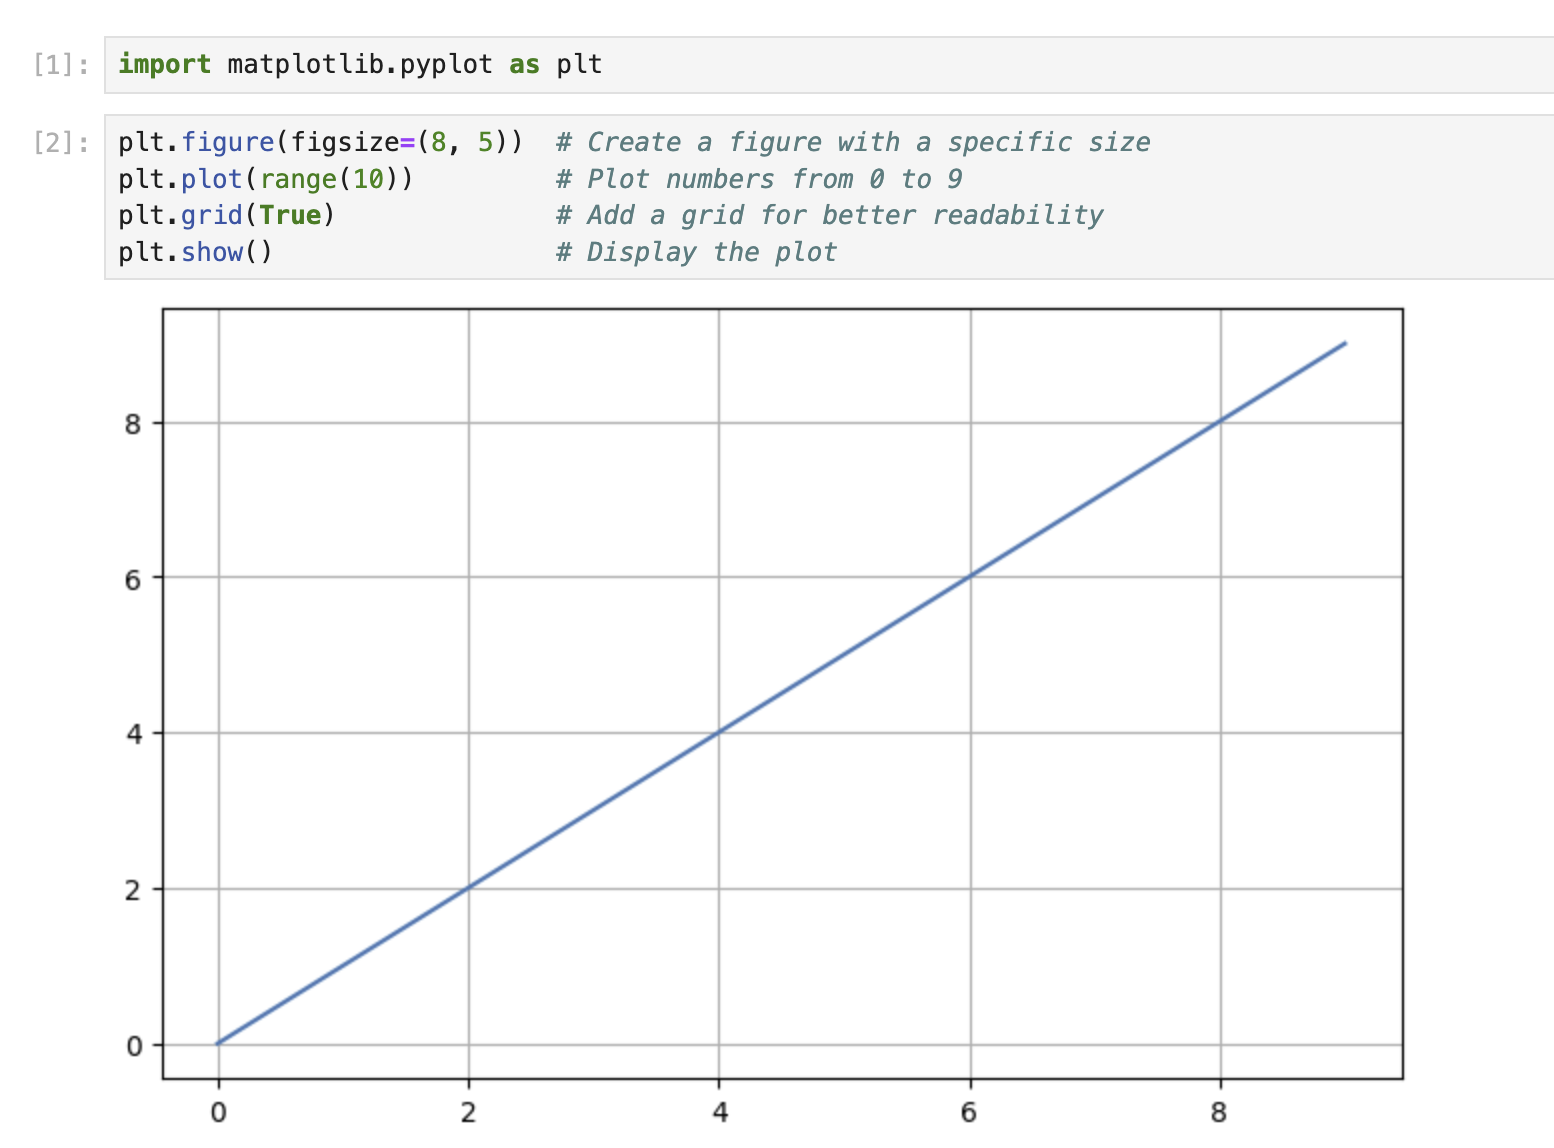
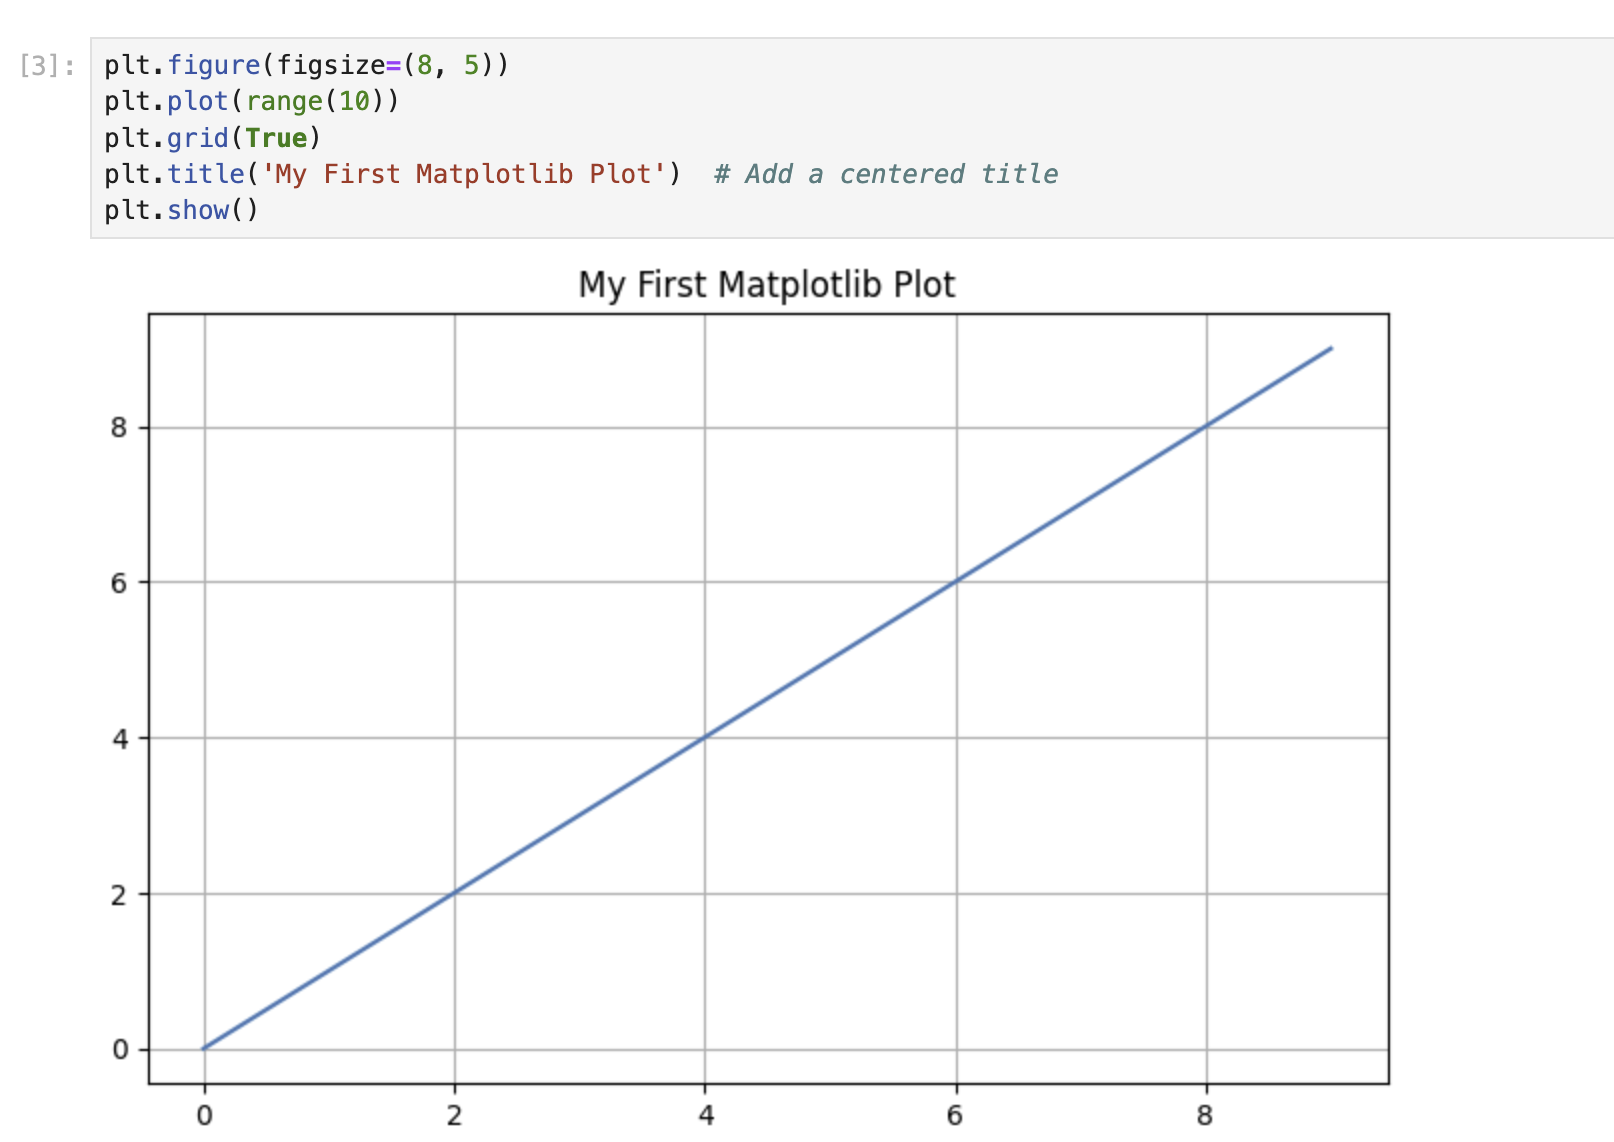
- Ein einfaches Diagramm mit einem zentrierten Titel erstellen
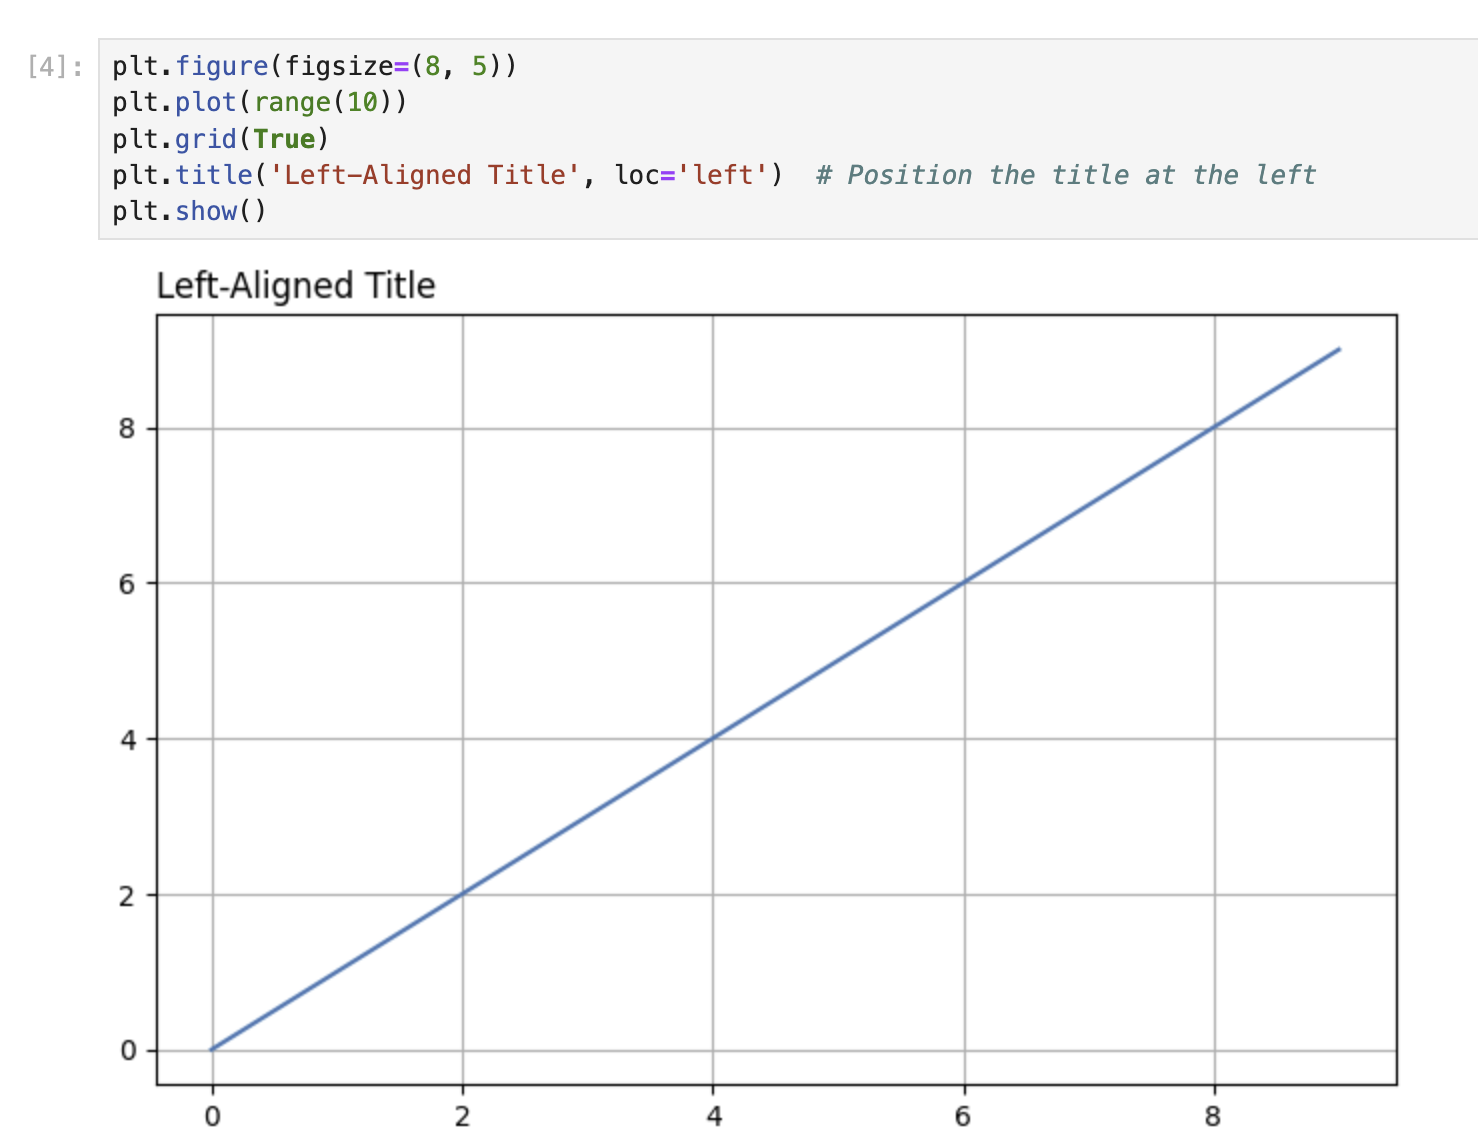
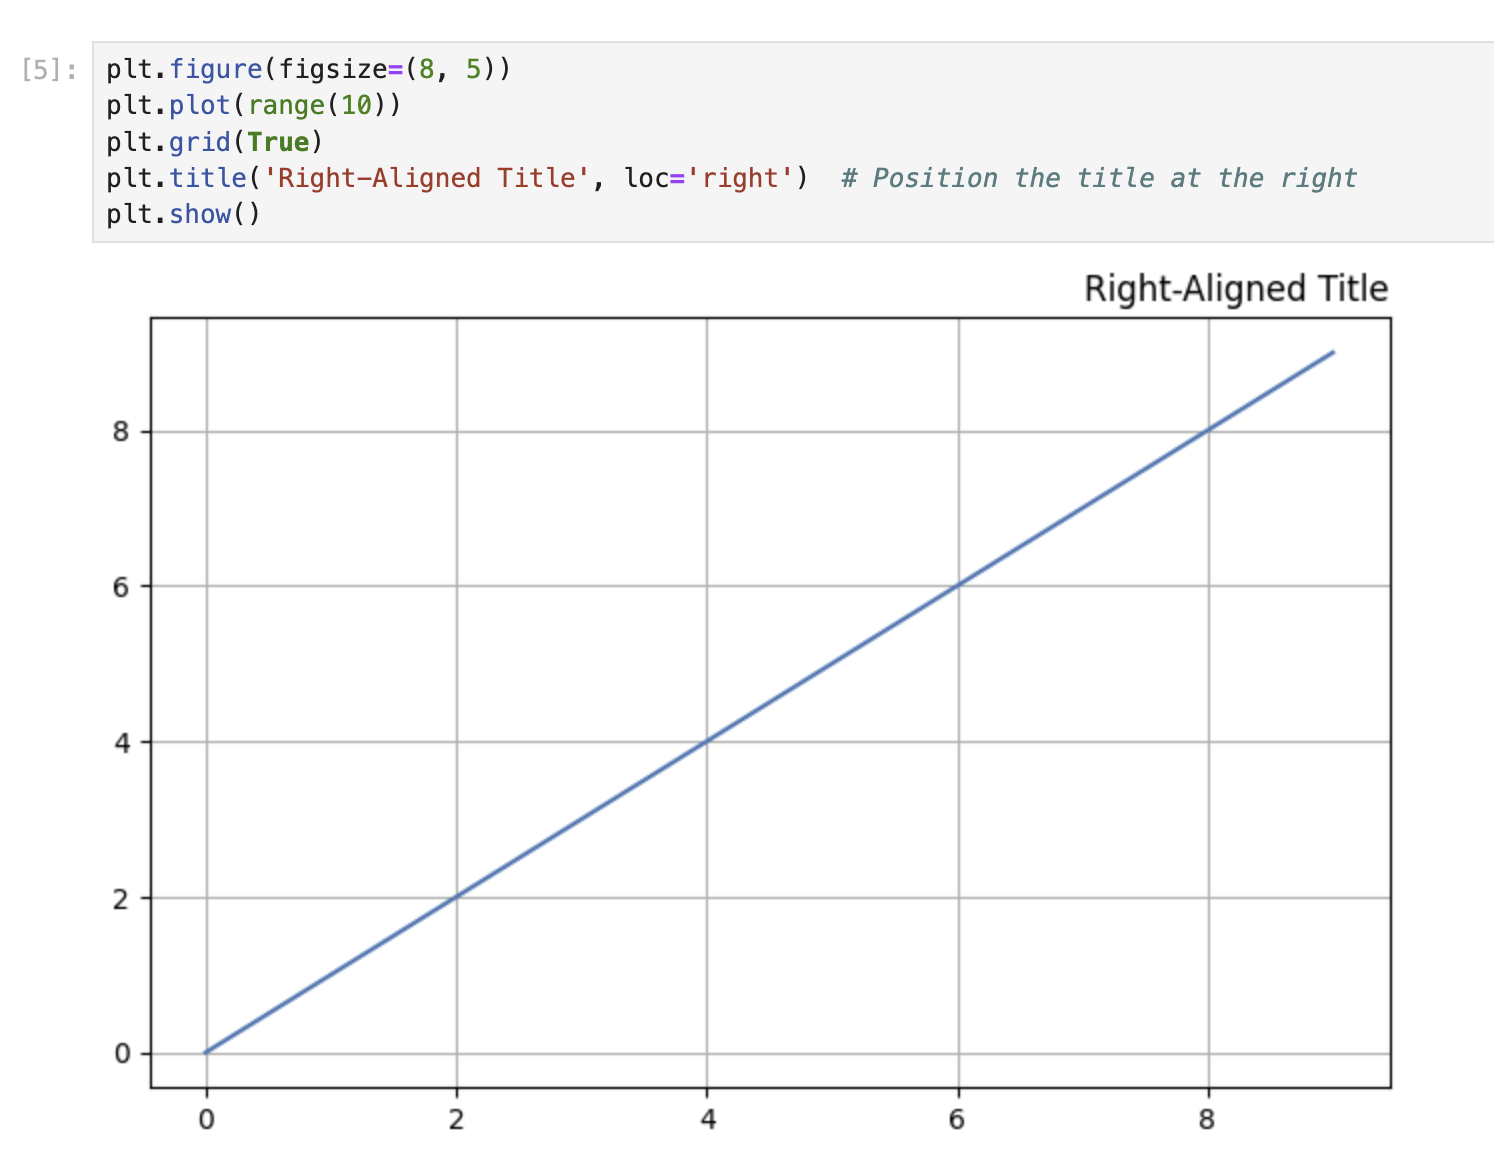
- Titel links oder rechts eines Diagramms positionieren
- Ein Diagramm mit einem Titel an einer benutzerdefinierten Position erstellen
- Verschiedene Methoden verwenden, um die Titelpositionierung anzupassen
Skills Graph
%%%%{init: {'theme':'neutral'}}%%%%
flowchart RL
matplotlib(("Matplotlib")) -.-> matplotlib/AdvancedPlottingGroup(["Advanced Plotting"])
matplotlib(("Matplotlib")) -.-> matplotlib/PlotCustomizationGroup(["Plot Customization"])
matplotlib(("Matplotlib")) -.-> matplotlib/AdvancedTopicsGroup(["Advanced Topics"])
matplotlib(("Matplotlib")) -.-> matplotlib/PlottingDataGroup(["Plotting Data"])
matplotlib/PlottingDataGroup -.-> matplotlib/line_plots("Line Plots")
matplotlib/AdvancedPlottingGroup -.-> matplotlib/subplots("Subplots")
matplotlib/PlotCustomizationGroup -.-> matplotlib/titles_labels("Adding Titles and Labels")
matplotlib/AdvancedTopicsGroup -.-> matplotlib/matplotlib_config("Customizing Matplotlib Configurations")
subgraph Lab Skills
matplotlib/line_plots -.-> lab-48998{{"Matplotlib Diagrammtitelpositionierung"}}
matplotlib/subplots -.-> lab-48998{{"Matplotlib Diagrammtitelpositionierung"}}
matplotlib/titles_labels -.-> lab-48998{{"Matplotlib Diagrammtitelpositionierung"}}
matplotlib/matplotlib_config -.-> lab-48998{{"Matplotlib Diagrammtitelpositionierung"}}
end