Creating Interactive Bar Charts with ECharts

JavaScriptJavaScriptBeginner
Practice Now

Introduction

In this project, you will learn how to create a bar chart using the ECharts JavaScript library to display student achievement statistics. ECharts is a powerful data visualization tool that can help you create interactive and visually appealing charts to present your data.
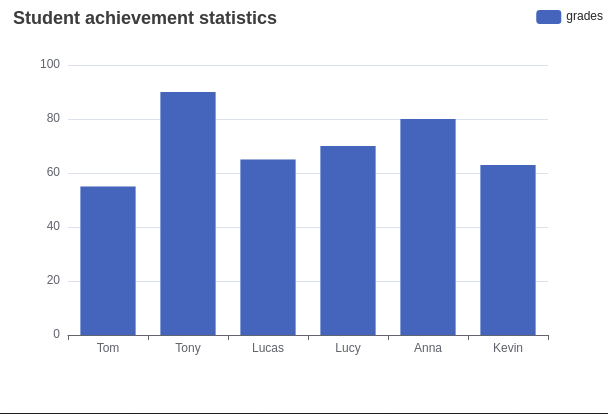
👀 Preview

Image Description

🎯 Tasks

In this project, you will learn:

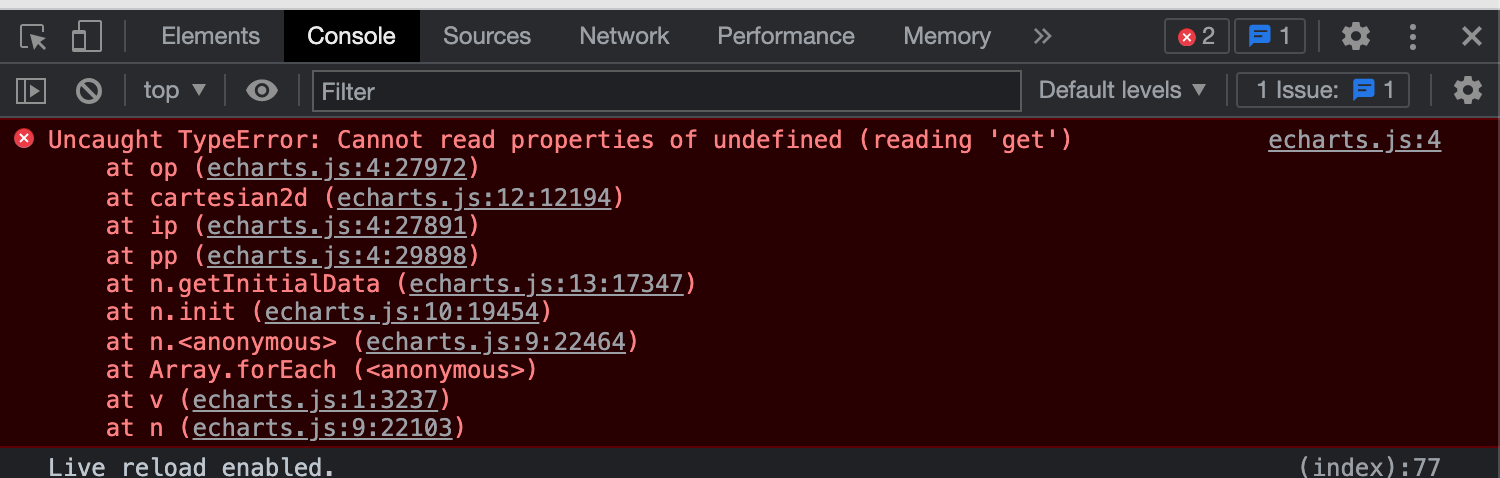
  • How to fix an error in the initial code to display the chart correctly
  • How to modify the x-axis and y-axis settings to ensure the chart is displayed in the correct direction
  • How to adjust the data in the series to match the order of the x-axis labels

🏆 Achievements

After completing this project, you will be able to:

  • Initialize an ECharts instance and configure the chart options
  • Define the x-axis and y-axis properties to control the chart's appearance
  • Update the data in the series to match the desired visualization

Skills Graph

%%%%{init: {'theme':'neutral'}}%%%% flowchart RL javascript(("`JavaScript`")) -.-> javascript/BasicConceptsGroup(["`Basic Concepts`"]) javascript/BasicConceptsGroup -.-> javascript/variables("`Variables`") subgraph Lab Skills javascript/variables -.-> lab-300333{{"`Creating Interactive Bar Charts with ECharts`"}} end

Set Up the Project Structure

In this step, you will set up the project structure and prepare the necessary files and folders.

Open the project folder in your code editor. The directory structure is as follows:

├── echarts.js
└── index.html

Where:

  • index.html is the main page.
  • js/echarts.js is the ECharts file.

Click on Go Live button in the bottom right corner of WebIDE, to run the project.

Next, open the "Web 8080" on the top of the VM, manually refresh the page you will find the page is blank, at this time please open the console, you will see the following error message:

Image Description

Fix the Error

In this step, you will learn how to fix the error in the project so that the chart can be displayed.

  1. Open the index.html file in the provided project.
  2. The code in the script tag was found to have an undefined x-axis. In the echars chart, both the x-axis and y-axis must be defined regardless of whether there is data. Therefore, we made the following change to the code under var option = {...}; inside TODO as follows:
// TODO
// xAxis
xAxis: {
  data: ["Tom", "Tony", "Lucas", "Lucy", "Anna", "Kevin"]
},
// yAxis
yAxis: {},
series: [
  {
    name: "grades",
    type: "bar",
    data: [55, 90, 65, 70, 80, 63]
  }
]

This will fix the error and allow the chart to be displayed.

  1. Save the changes and reload the page to see the chart.
Image Description

Summary

Congratulations! You have completed this project. You can practice more labs in LabEx to improve your skills.

Other JavaScript Tutorials you may like