Introduction
In this project, you will learn how to create a weather trend chart that displays the temperature data for a city throughout the year. The chart will allow users to switch between the current month's data and the next 7 days' data, providing a comprehensive view of the weather trends.
👀 Preview
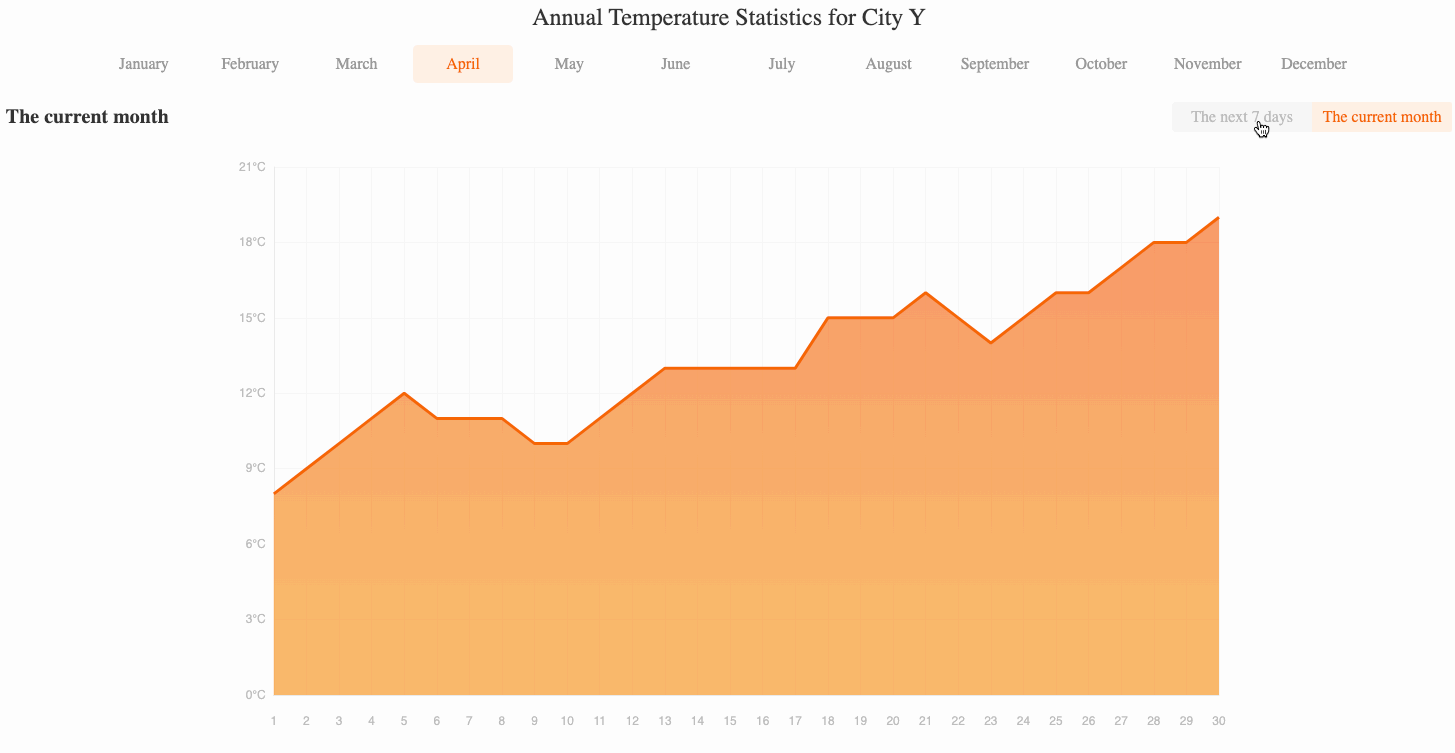
"The current month" and "The next 7 days" switching effect is shown in the figure below:
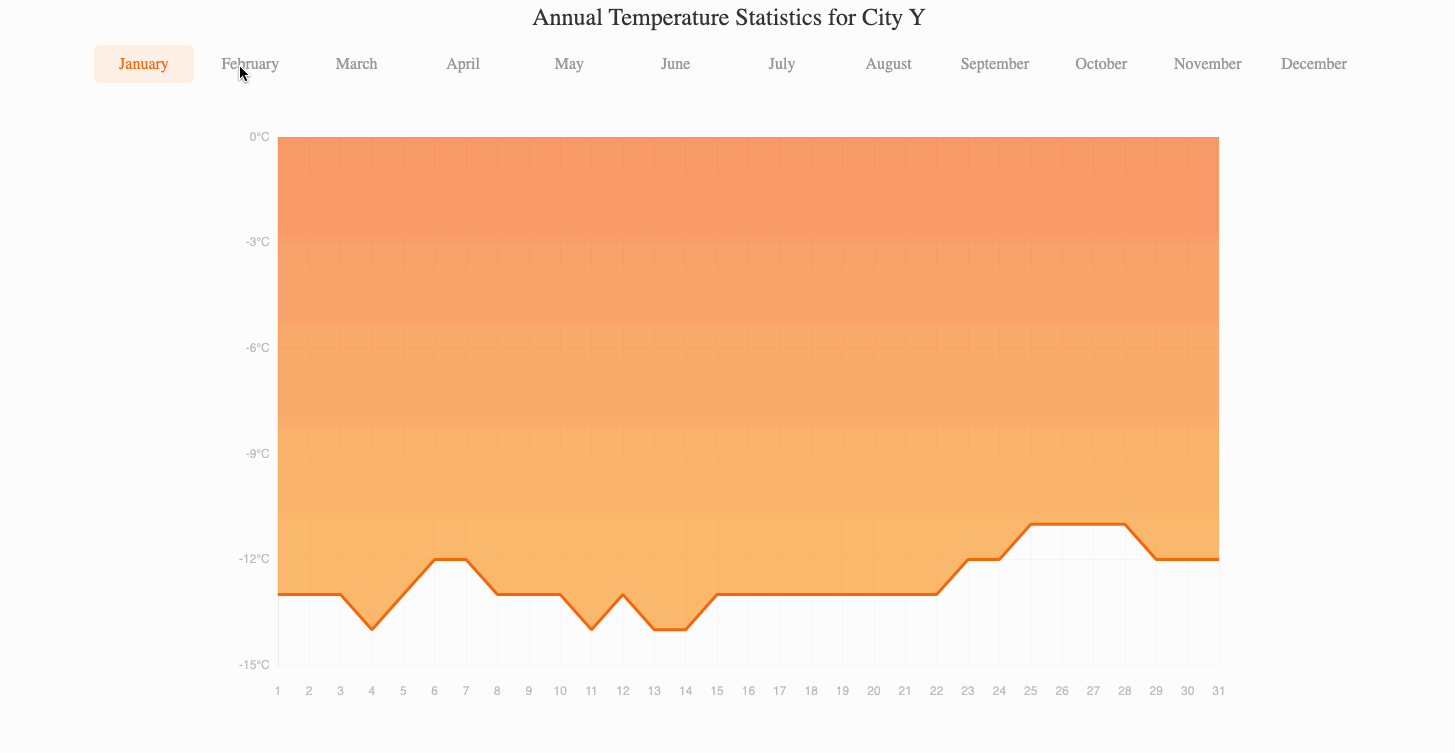
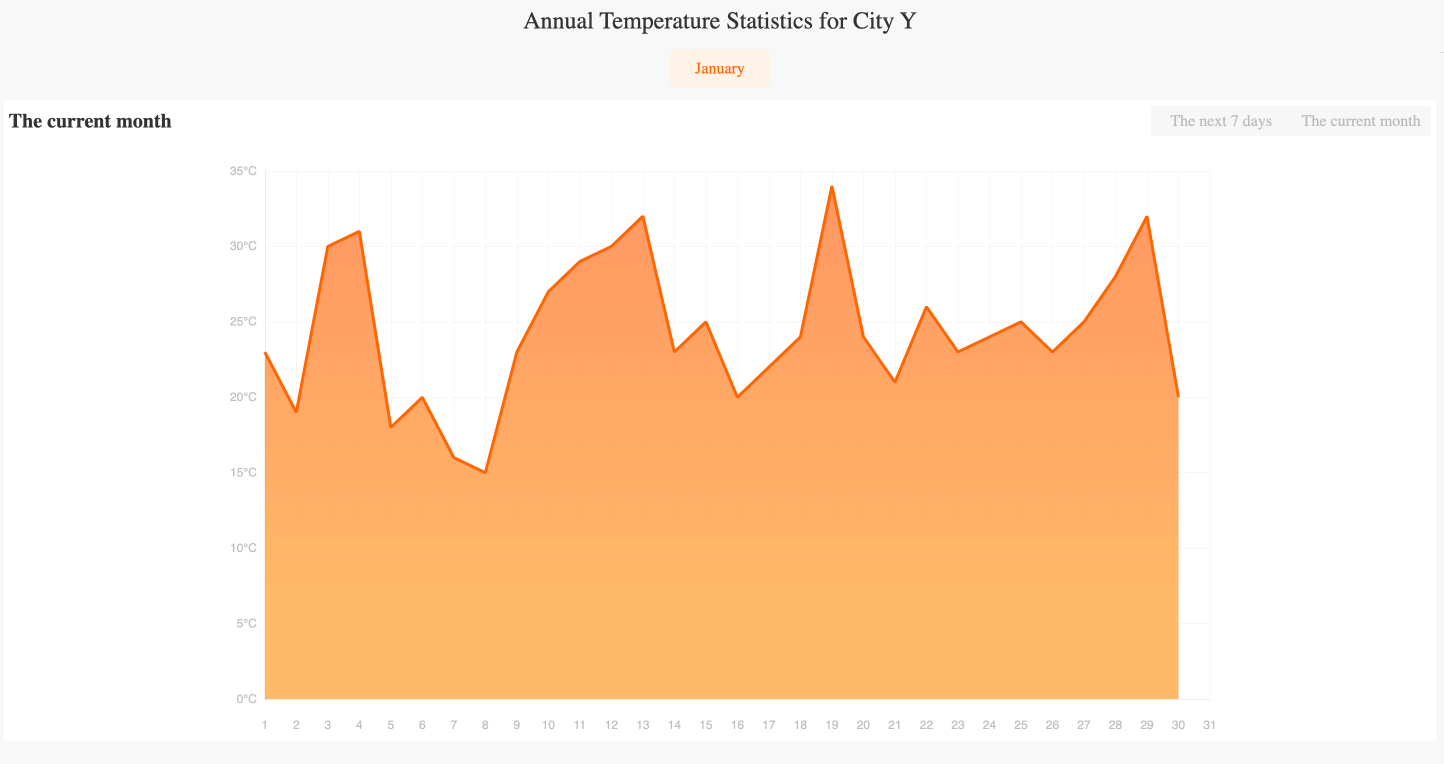
The month switching effect is as follows:
🎯 Tasks
In this project, you will learn:
- How to fetch weather data from a JSON file using Axios
- How to render a list of months and handle the click event to change the displayed data
- How to implement tabs to switch between the current month's data and the next 7 days' data
- How to initialize and customize an Echarts chart to display the weather data
🏆 Achievements
After completing this project, you will be able to:
- Fetch data from a JSON file using Axios
- Create a responsive and interactive user interface with Vue.js
- Use Echarts to create a customized chart with advanced features
- Handle user interactions and update the chart accordingly
- Apply your knowledge of front-end development, data visualization, and user experience design
Set Up the Project Structure
In this step, you will set up the project files and structure. Follow the steps below to complete this step:
Open the project folder. The directory structure is as follows:
├── css
│   └── style.css
├── js
│   ├── axios.js
│   ├── echarts.min.js
│   ├── vue.min.js
│   └── weather.json
└── index.html
Where:
css/style.cssis the style file.js/axios.jsis the axios file.js/vue.min.jsis the vue2.x file.js/echarts.min.jsis the echarts file.js/weather.jsonis the weather data needed for the request.index.htmlis the main page.
Click on Go Live button in the bottom right corner of WebIDE, to run the project.
Next, open "Web 8080" on the top of the VM and refresh it manually and you will see the page.
Fetch Weather Data
In this step, you will learn how to fetch the weather data from the provided JSON file.
- In the
index.htmlfile, locate the<script>tag at the bottom of the file. - Inside the
<script>tag, create a new Vue instance usingnew Vue(). - In the
dataoption of the Vue instance, add the following attributes and assign initial values.
data: {
  // ...
  data: [],
  yData: [],
  xData: [],
},
- In the
methodshook of the Vue instance, locate thethis.chartOptionsin theinitChartfunction and change thedatain xAxis and series to the corresponding variables as follows:
this.chartOptions = {
  // ...
  xAxis: [
    {
      // ...
      data: this.xData
    }
  ],
  // ...
  series: [
    {
      // ...
      data: this.yData
    }
  ]
};
- In the
mountedhook of the Vue instance, use theaxios.get()method to fetch the weather data from the./js/weather.jsonfile. The modified code is as follows:
mounted: async function () {
  const res = await axios.get("./js/weather.json");
  this.data = res.data;
  this.yData = res.data[0]["January"];
  this.xData = [...this.yData.map((e, i) => i + 1)];
  this.$nextTick(() => {
    this.initChart();
  });
},
This code fetches the weather data from the JSON file, stores it in the data property, and then sets the initial yData and xData properties for the chart. Finally, it calls the initChart() method to render the chart.
Render the Month List
In this step, you will learn how to render the list of months and handle the click event to change the displayed data.
- In the
index.htmlfile, in thedataoption of the Vue instance, add the following attributes and assign initial values.
data: {
  // ...
  monthName: "January",
  monthNumber: 0,
},
- In the
<ul>element with theclass="month", use av-fordirective to render the list of months. Add a click event handler to the<li>elements to call thechangeMonth()method when a month is clicked.
<ul>
  <li
    v-for="(item,key,index) in monthList"
    :class="[monthName===key?'active':'']"
    @click="changeMonth(key,index)"
  >
    {{item}}
  </li>
</ul>
- In the
methodssection of the Vue instance, add thechangeMonth()method, which updates themonthName,monthNumber,yData, andxDataproperties based on the selected month, and then calls theinitChart()method to re-render the chart.
changeMonth(month, index) {
  this.monthName = month;
  this.monthNumber = index;

  this.yData = this.data[index][month];
  this.xData = [...this.yData.map((e, i) => i + 1)];

  if (index === this.nowMonth) {
    this.type = 1;
  }
  this.initChart();
},
Implement the Current Month and the Next 7 Days Tabs
In this step, you will learn how to implement the tabs that allow the user to switch between the current month's data and the next 7 days' data.
- In the
index.htmlfile, in thedatasection of the Vue instance, add the following properties:
data: {
  type: 1, // Status of data for the next 7 days and the current month
  nowMonth: new Date().getMonth(),
},
- In the
<div>with theid="currentMonth", add a conditional rendering based on themonthNumberandnowMonthproperties. This will only display the tab for the current month.
<div id="currentMonth" v-if="monthNumber===nowMonth">
  <div class="title">
    <h3>{{typeTitle}}</h3>
    <div class="type" @click="clickType($event)">
      <span id="seven" :class="{'active':!type}">The next 7 days</span>
      <span id="current" :class="{'active':type}">The current month</span>
    </div>
  </div>
</div>
- In the
methodssection of the Vue instance, add theclickType()method, which updates thetype,typeTitle,yData, andxDataproperties based on the clicked tab, and then calls theinitChart()method to re-render the chart.
clickType(e) {
  switch (e.target.id) {
    case "seven":
      this.type = 0;
      this.typeTitle = "The next 7 days";
      [this.xData, this.yData] = this.getSevenData();
      break;
    case "current":
      this.type = 1;
      this.typeTitle = "The current month";
      this.yData = this.data[this.monthNumber][this.monthName];
      this.xData = [...this.yData.map((e, i) => i + 1)];
      break;
  }
  this.initChart();
},
- Add the
getSevenData()method, which calculates the x-axis labels and y-axis data for the next 7 days.
getSevenData() {
  let newXdata = [],
    newYdata = [];
  for (let i = 0; i < 7; i++) {
    let now = new Date();
    let time = now.getTime() + 1000 * 60 * 60 * 24 * i;
    now.setTime(time);
    newXdata.push(`${now.getMonth() + 1}/${now.getDate()}`);

    if (this.monthNumber === now.getMonth()) {
      newYdata.push(this.yData[now.getDate() - 1]);
    } else {
      let nextMonth = this.data[now.getMonth()];
      for (const key in nextMonth) {
        newYdata.push(nextMonth[key][now.getDate() - 1]);
      }
    }
  }
  return [newXdata, newYdata];
},
This method calculates the x-axis labels and y-axis data for the next 7 days, taking into account the transition between months.
- Save the file and reload the page to see the updated chart. The following figure shows the effect of switching between "the current month" and "the next 7 days" (obtained via the time function, here assuming April):
The month switching effect is as follows:
Summary
Congratulations! You have completed this project. You can practice more labs in LabEx to improve your skills.