Introduction
Prometheus is a powerful open-source monitoring and alerting toolkit. Its behavior is controlled by a configuration file, typically named prometheus.yml. This file defines everything from how often to scrape metrics, which targets to scrape, and how to handle alerting rules.
This lab is a continuation of the "Prometheus Installation" lab, where you learned how to install and run Prometheus using Docker. Now that you know how to get Prometheus up and running, this lab will teach you the fundamentals of Prometheus configuration. You will start by inspecting a Prometheus container running with a default configuration. Then, you will create your own custom prometheus.yml file, launch a new container using this file, and learn how to reload the configuration without restarting the service.
Check the Prometheus Container is Running
In this step, we will verify that the initial Prometheus container, which was started by the setup script, is running. This container uses the default, built-in configuration.
Let's list all the running Docker containers to see our prometheus-default container.
docker ps
You should see an output similar to this, showing that a container with the name prometheus-default is up and running. The PORTS column indicates that port 9090 on the host is mapped to port 9090 in the container.
CONTAINER ID   IMAGE                       COMMAND                  CREATED          STATUS          PORTS                                       NAMES
a1b2c3d4e5f6   prom/prometheus     "/bin/prometheus --c…"   15 seconds ago   Up 14 seconds   0.0.0.0:9090->9090/tcp, :::9090->9090/tcp   prometheus-default
This confirms that our initial Prometheus instance is active. In the next step, you will access the Prometheus web UI to see the default configuration in action.
Access Prometheus Web UI at localhost:9090
In this step, you will access the Prometheus web interface, which is now running and exposed on port 9090. The LabEx environment provides a convenient way to access web services running inside the virtual machine.
Click the +(New Tab) button located at the top of the lab interface.
Select the Web Service option, and enter 9090 as the port.
This will open a new browser tab connected to the services running in your lab environment.
Since we mapped port 9090, the Prometheus UI will be available. You should see the Prometheus Expression Browser, which is the main landing page. This interface allows you to write and execute PromQL queries to explore metrics.
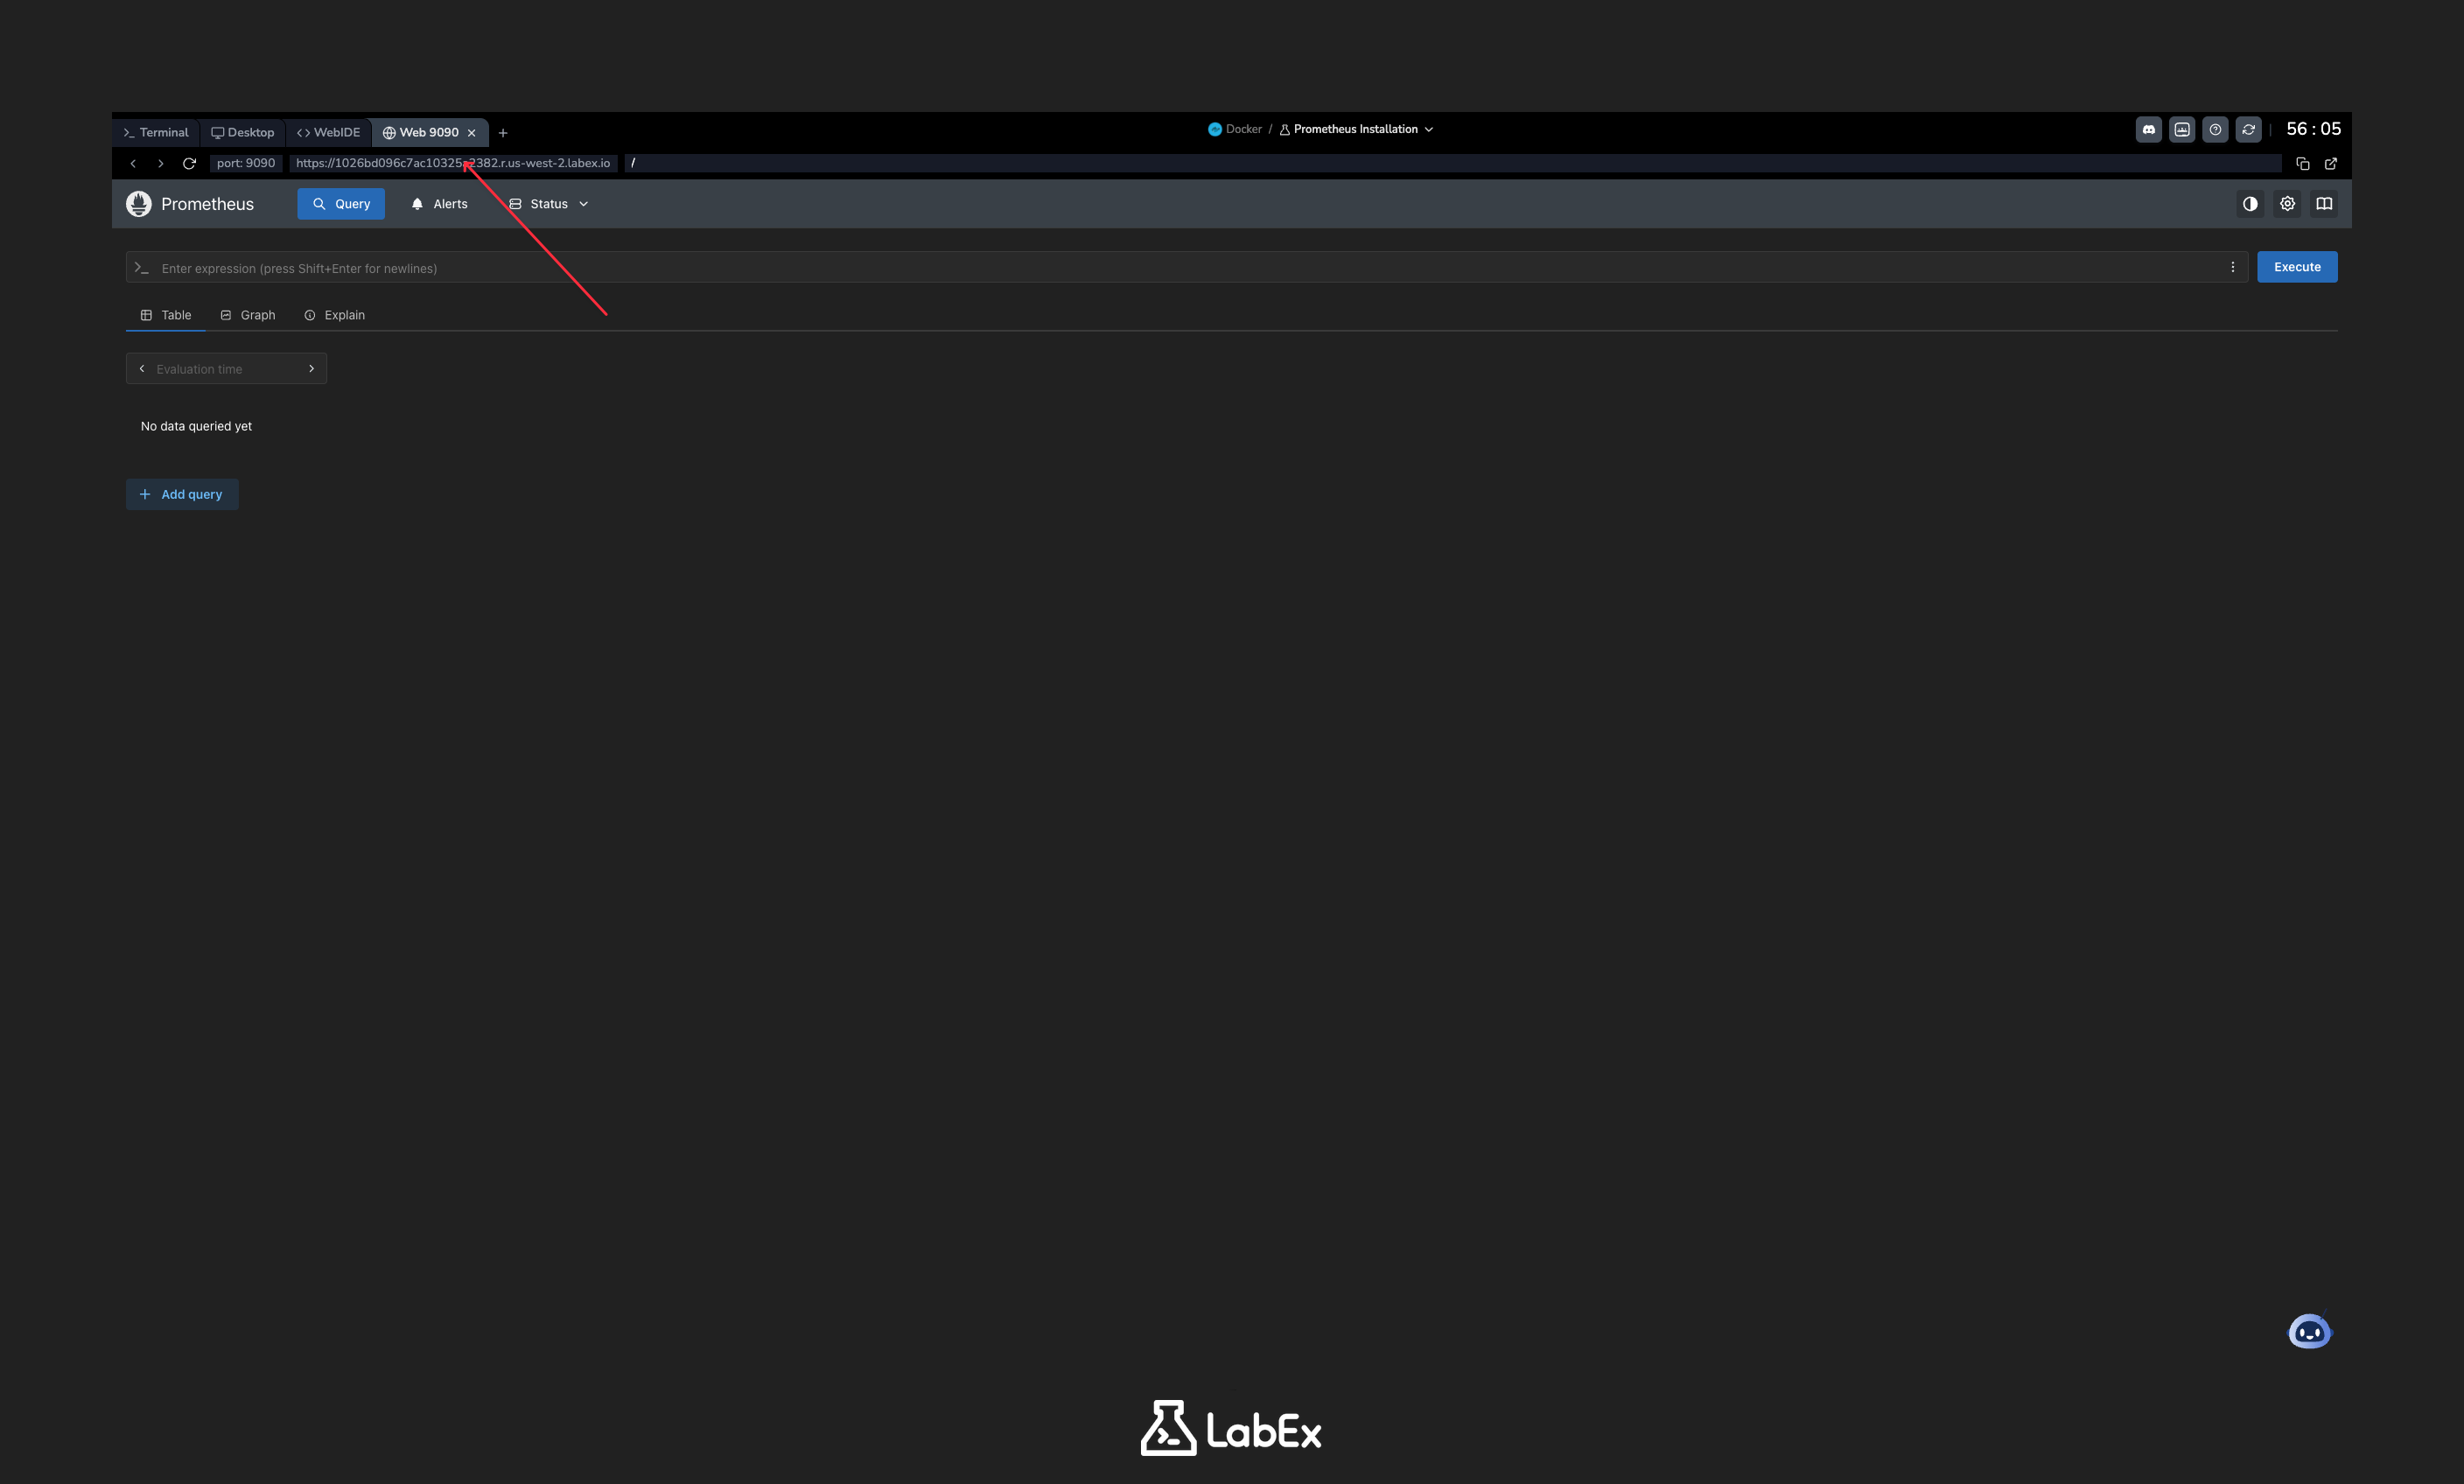
The presence of this page confirms that your Prometheus container is running correctly and is accessible.
Create prometheus.yml File with Basic Scrape Config
In this step, you will create a custom Prometheus configuration file named prometheus.yml. This file will instruct Prometheus on what to monitor.
Now that you have accessed the Prometheus web UI and confirmed it's working, let's create a custom configuration file that you can use to configure Prometheus according to your needs.
We will use the nano text editor to create the file in the ~/project directory.
nano prometheus.yml
Now, copy and paste the following YAML configuration into the nano editor. This configuration tells Prometheus to scrape metrics from itself every 5 seconds.
global:
  scrape_interval: 5s

scrape_configs:
  - job_name: "prometheus"
    static_configs:
      - targets: ["localhost:9090"]
Let's break down this configuration:
global: This section defines parameters that are valid for all other configuration sections.scrape_interval: This sets the default time between scrapes to 5 seconds.scrape_configs: This section defines the set of targets and parameters for scraping.job_name: This is the name assigned to the job, which will be attached as a label to any time series scraped from this target.static_configs: This specifies a list of targets to be monitored.targets: This lists the endpoints to scrape. In this case, it's the Prometheus server itself.
After pasting the content, save the file and exit nano by pressing Ctrl+X, then Y, and finally Enter.
Run Prometheus Container with Mounted Config
Now that we have our custom prometheus.yml file, we need to run a new Prometheus container that uses it. First, let's stop and remove the old container.
docker stop prometheus-default
docker rm prometheus-default
Next, we will launch a new container named prometheus-custom. We will use the -v flag to mount our local prometheus.yml file into the container at the expected location /etc/prometheus/prometheus.yml. We also add the --web.enable-lifecycle flag to enable the hot-reloading API, which we'll use in the next step.
docker run -d \
  --name prometheus-custom \
  -p 9090:9090 \
  -v ~/project/prometheus.yml:/etc/prometheus/prometheus.yml \
  prom/prometheus \
  --config.file=/etc/prometheus/prometheus.yml \
  --web.enable-lifecycle
Let's review the new flags:
-v ~/project/prometheus.yml:/etc/prometheus/prometheus.yml: This is the volume mount. It maps theprometheus.ymlfile from your host machine's~/projectdirectory to the/etc/prometheus/prometheus.ymlpath inside the container. Prometheus will read this file on startup.--web.enable-lifecycle: This command-line flag enables the HTTP API for reloading the configuration, which can be accessed via the/-/reloadendpoint.
You can verify the new container is running:
docker ps
You should see the prometheus-custom container in the list.
Reload Prometheus Configuration via API
One of the powerful features of Prometheus is the ability to reload its configuration without a full restart, which prevents any gaps in metric collection. This is possible because we enabled the lifecycle API with the --web.enable-lifecycle flag.
First, let's modify our configuration file. We will change the scrape_interval from 5s to 15s.
Open the file with nano:
nano prometheus.yml
Change the scrape_interval line to 15s:
global:
  scrape_interval: 15s ## Changed from 5s

scrape_configs:
  - job_name: "prometheus"
    static_configs:
      - targets: ["localhost:9090"]
Save the file and exit nano (Ctrl+X, Y, Enter).
Now, instead of restarting the container, we will send a POST request to the /-/reload endpoint using curl. This tells the running Prometheus instance to reload its configuration from the mounted file.
curl -X POST http://localhost:9090/-/reload
If the reload is successful, you will not see any output. This silent success means Prometheus has applied the new configuration.
Check Scraped Metrics in Targets Page
In this final step, we will verify that our custom configuration is active by checking the Prometheus web UI.
The LabEx environment provides a "Web Terminal" tab or a similar mechanism to access web services running inside the VM. Open the Prometheus UI by navigating to http://localhost:9090 in the browser provided by the lab interface.
Once the UI loads, click on the Status menu in the top navigation bar, and then select Targets.
On the Targets page, you will see the scrape targets defined in your prometheus.yml file. You should see one target under the prometheus job.
- Endpoint:
http://localhost:9090/metrics - State: The state should be
UPwith a green background. - Last Scrape / Scrape Duration: These columns show when the last scrape occurred and how long it took. You can observe that the time between scrapes is now approximately 15 seconds, reflecting the change we reloaded in the previous step.
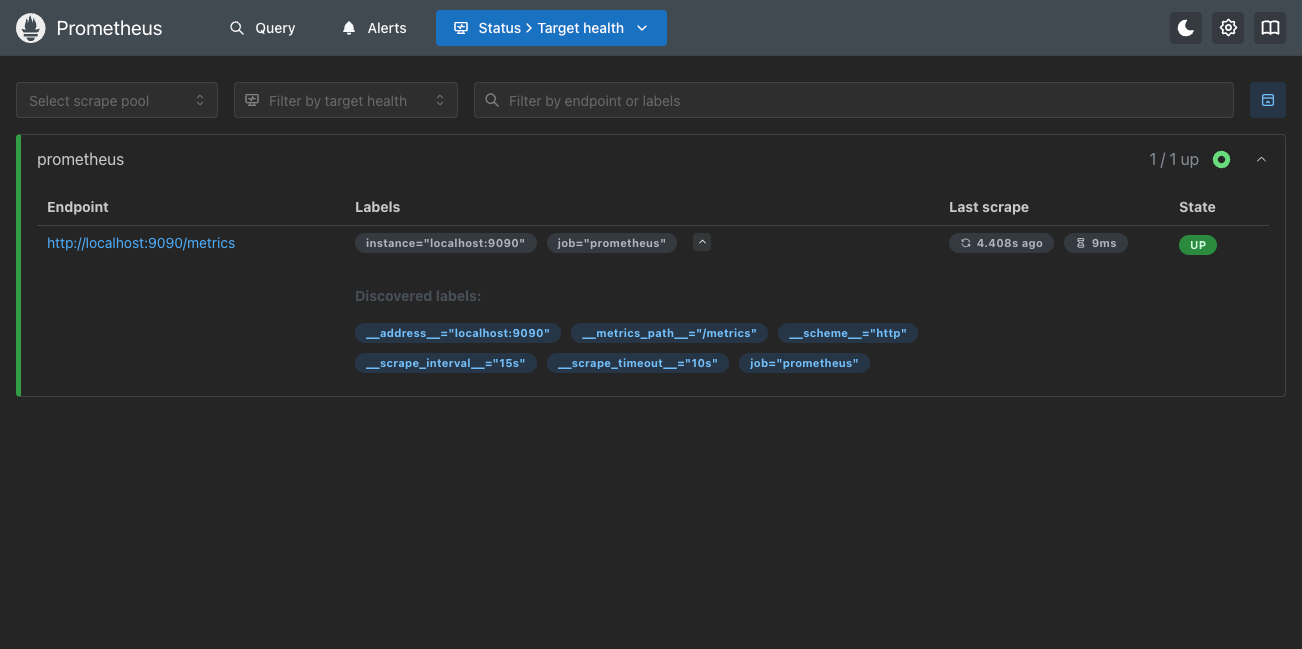
This confirms that Prometheus successfully loaded our custom configuration file, is scraping the specified target, and applied the configuration reload.
Summary
Congratulations! You have successfully completed this lab on Prometheus configuration.
In this lab, you learned how to:
- Create a custom
prometheus.ymlconfiguration file. - Use Docker volume mounts (
-v) to provide a custom configuration to a Prometheus container. - Enable the Prometheus lifecycle API to allow for hot-reloading.
- Reload the Prometheus configuration on-the-fly using a simple
curlcommand. - Verify the active configuration by checking the Targets page in the Prometheus web UI.
These are fundamental skills for managing and operating Prometheus in any environment.