Introduction
Grafana is a leading open-source platform for monitoring and observability. It allows you to query, visualize, alert on, and understand your metrics no matter where they are stored. With Grafana, you can create, explore, and share dashboards with your team and foster a data-driven culture.
In this lab, you will use Docker to quickly and easily set up a Grafana instance. The lab environment has been pre-configured with a running Prometheus container, which will serve as our data source. Your goal is to install Grafana in its own container and connect it to this Prometheus instance, setting the stage for future data visualization tasks.
Pull Grafana Docker Image
In this step, you will download the official Grafana Docker image from Docker Hub. Docker images are the blueprints for containers, containing the application and all its dependencies.
The docker pull command fetches an image from a registry, which by default is Docker Hub. We will pull the grafana/grafana image, which is the official image maintained by the Grafana team.
Execute the following command in your terminal:
docker pull grafana/grafana
You will see output showing the download progress for each layer of the image. Once completed, the image will be stored locally on your machine, ready to be used.
Using default tag: latest
latest: Pulling from grafana/grafana
a48c500ed24e: Pull complete
...
...
Status: Downloaded newer image for grafana/grafana
docker.io/grafana/grafana
Run Grafana Container on Port 3000
In this step, you will run the Grafana image as a container. We will use the docker run command, which creates and starts a new container from a specified image.
We will also use several flags to configure the container:
-d: Runs the container in detached mode (in the background).-p 8080:3000: Maps port 8080 of the host machine to port 3000 of the container. This makes the Grafana web UI accessible from your browser while avoiding conflicts with services already using port 3000.--name grafana: Assigns a custom name to the container for easy reference.--network monitoring: Connects the container to themonitoringnetwork. This is crucial as it allows this Grafana container to communicate with the Prometheus container (which is on the same network) using their container names.
Run the following command to start your Grafana container:
docker run -d -p 8080:3000 --name grafana --network monitoring grafana/grafana
The command will output a long string, which is the unique ID of the newly created container.
a1b2c3d4e5f6a1b2c3d4e5f6a1b2c3d4e5f6a1b2c3d4e5f6a1b2c3d4e5f6
You can verify that the container is running with the docker ps command.
docker ps
You should see the grafana container listed with a status of Up.
Access Grafana Web UI via Desktop Interface
In this step, you will access the Grafana web interface in your browser. Because we mapped port 3000 in the previous step, the Grafana UI is now available on your local machine.
Due to LabEx VM's reverse proxy settings, switch to Desktop Interface, click the Firefox browser in the top left corner, and enter http://localhost:8080 in the address bar. You should see the Grafana login page.
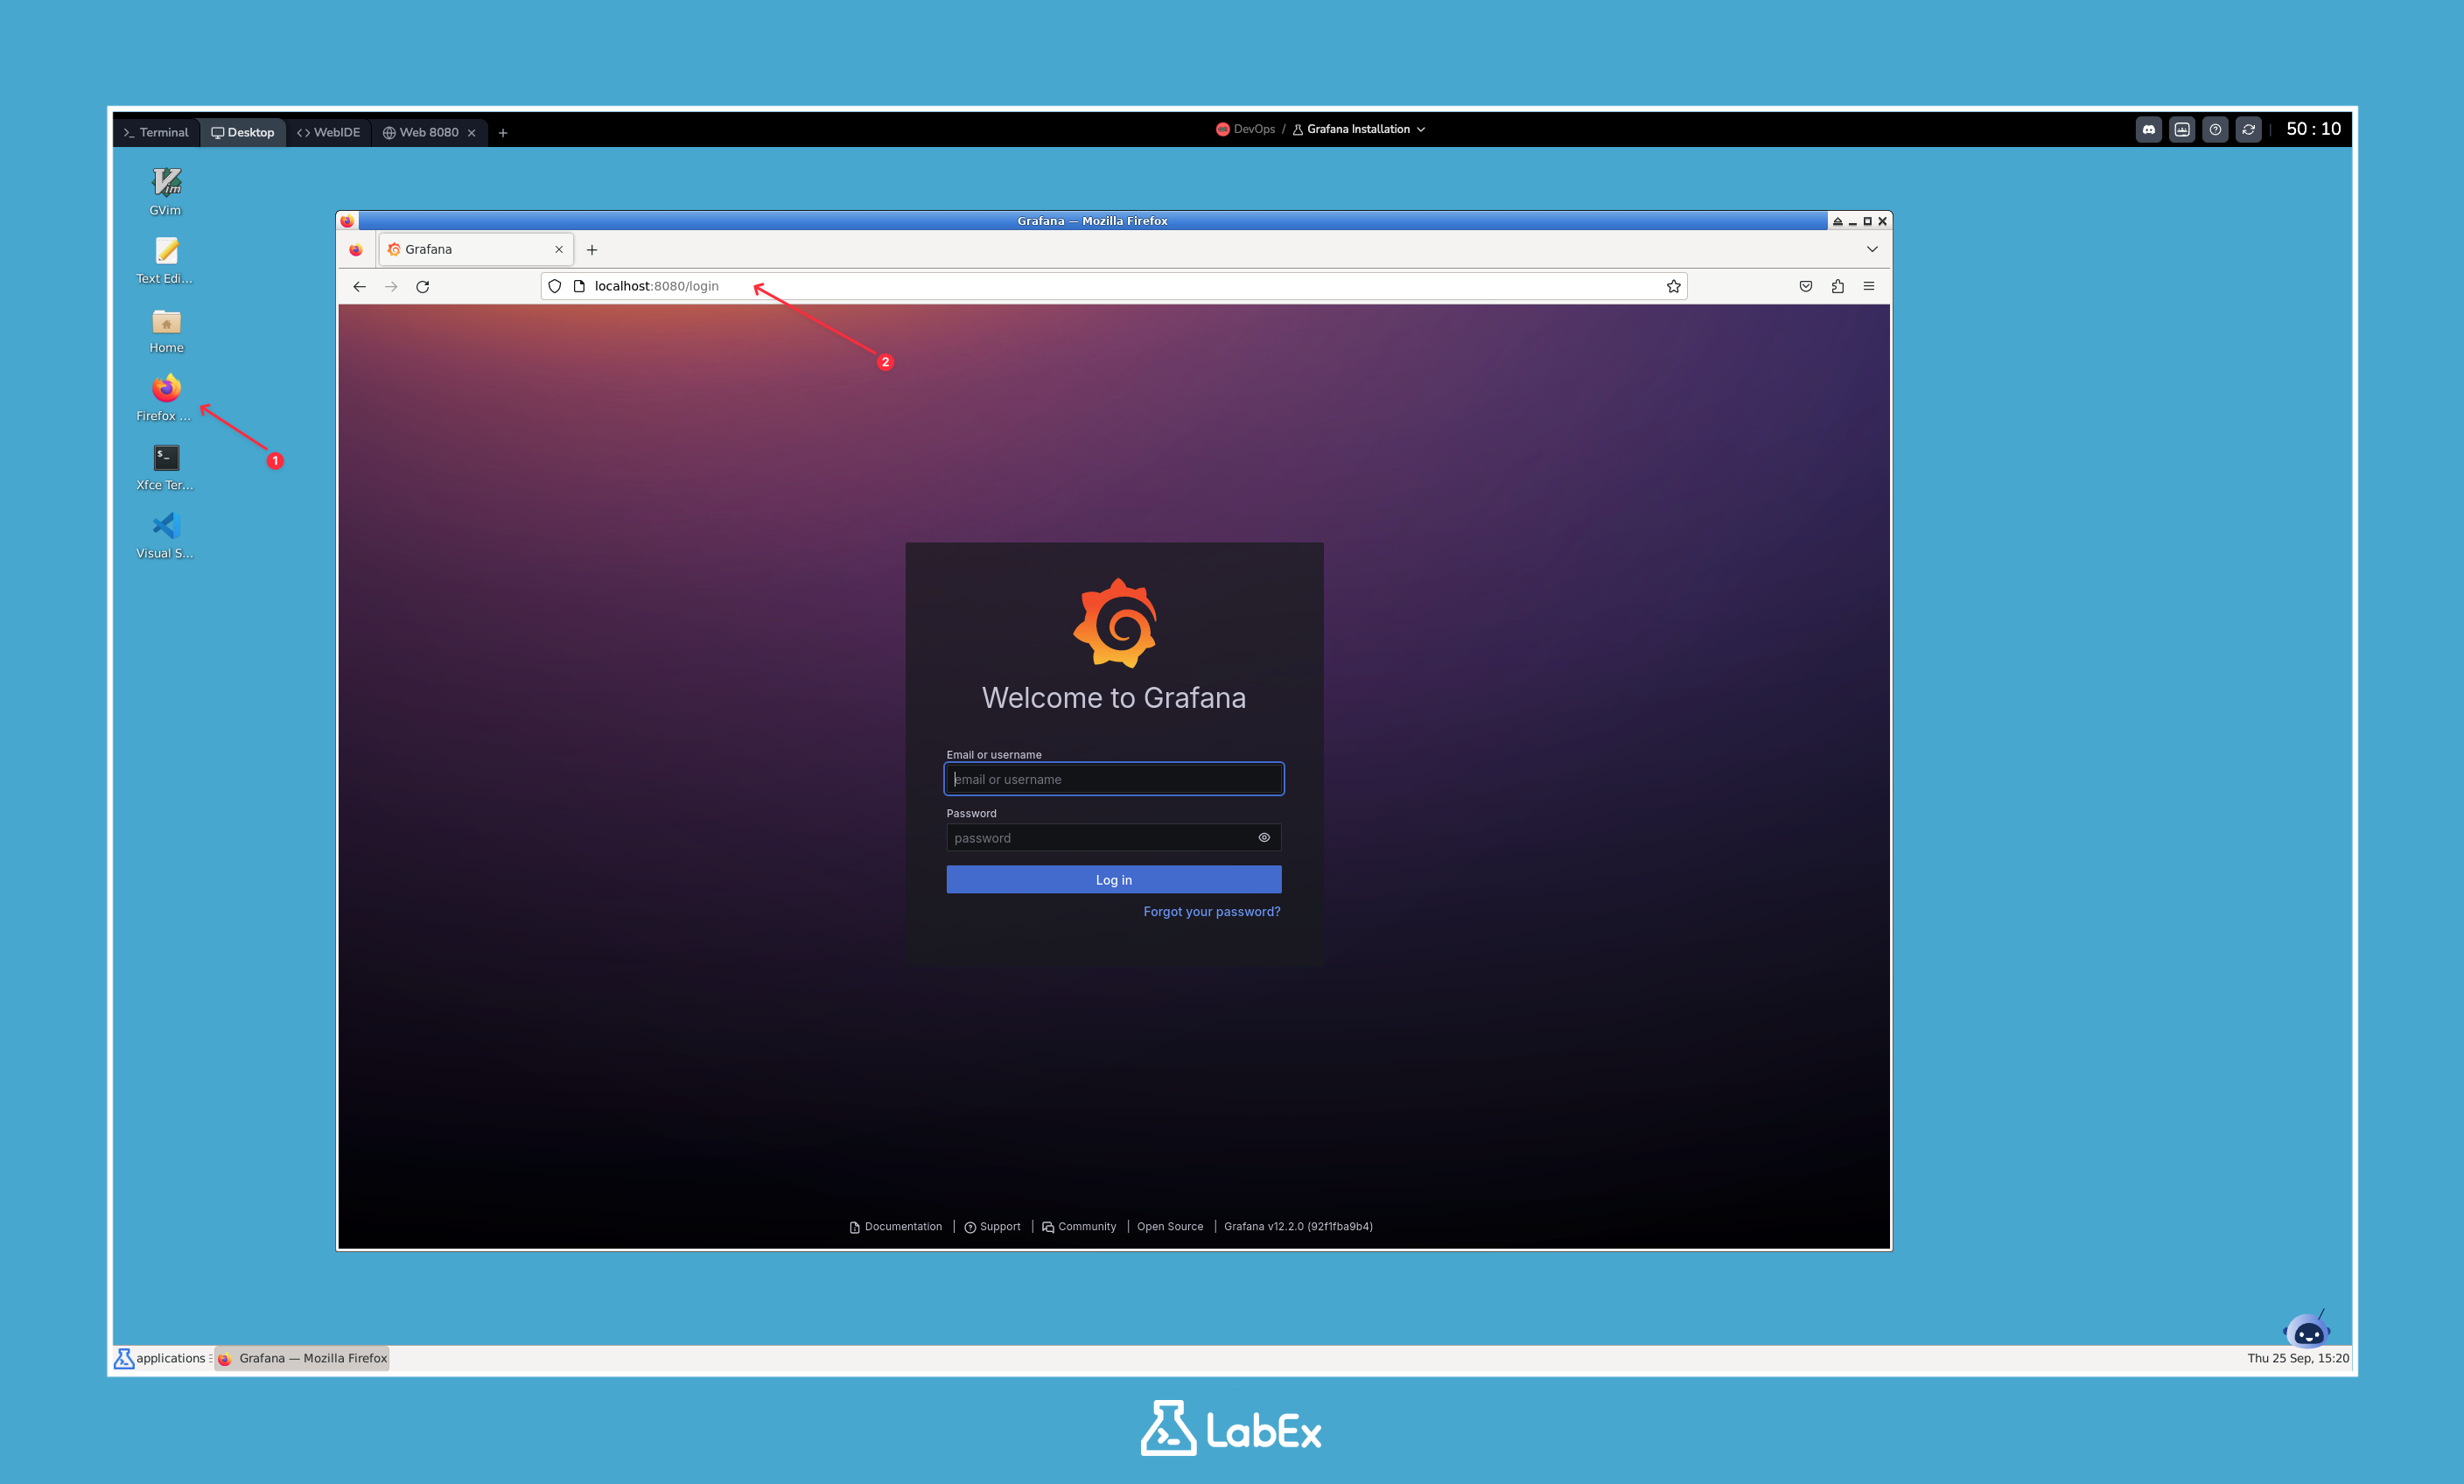
This confirms that your Grafana container is running correctly and is accessible.
First Login and Password Setup
In this step, you will log in to Grafana for the first time. Grafana requires you to change the default password immediately upon your first login for security reasons.
The default credentials for a new Grafana instance are:
- Username:
admin - Password:
admin
On the Grafana login page you opened in the previous step, enter admin for both the username and password fields, then click the Log in button.
You will be prompted to create a new password. We recommend clicking the "Skip" button to keep using the default admin password for this lab environment. If you choose to set a new password, please remember it to avoid being unable to access Grafana later.
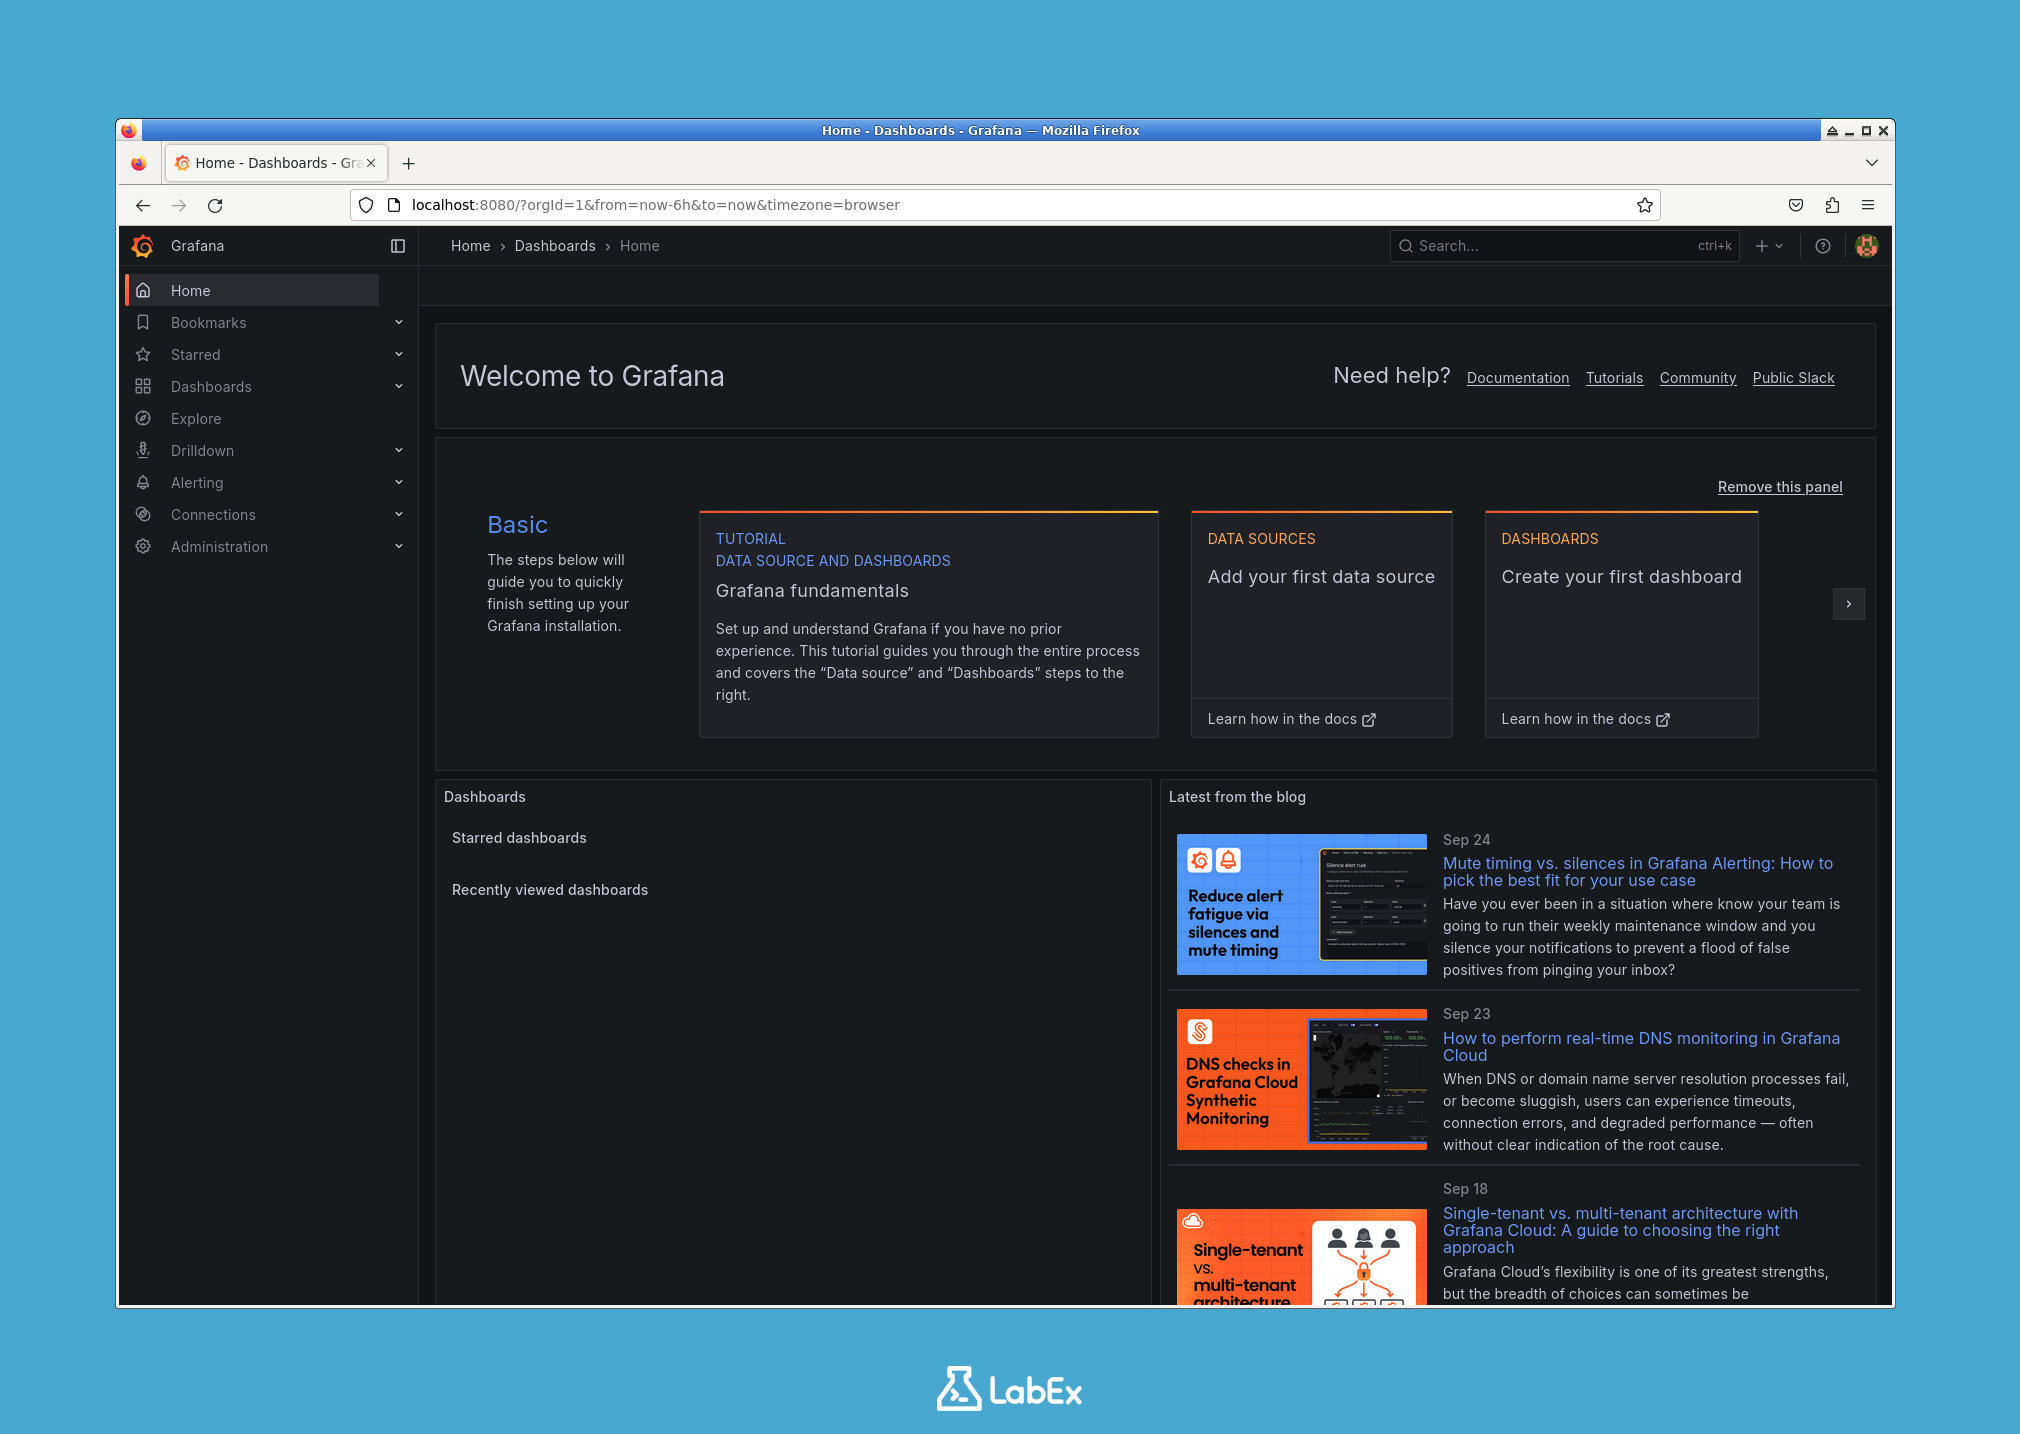
After logging in, you will be redirected to the Grafana home dashboard. You are now logged in and ready to configure Grafana.
Add Prometheus as Data Source in Grafana
In this step, you will connect Grafana to your Prometheus instance, which is already running in the background as part of the lab setup. This will allow Grafana to query metrics from Prometheus.
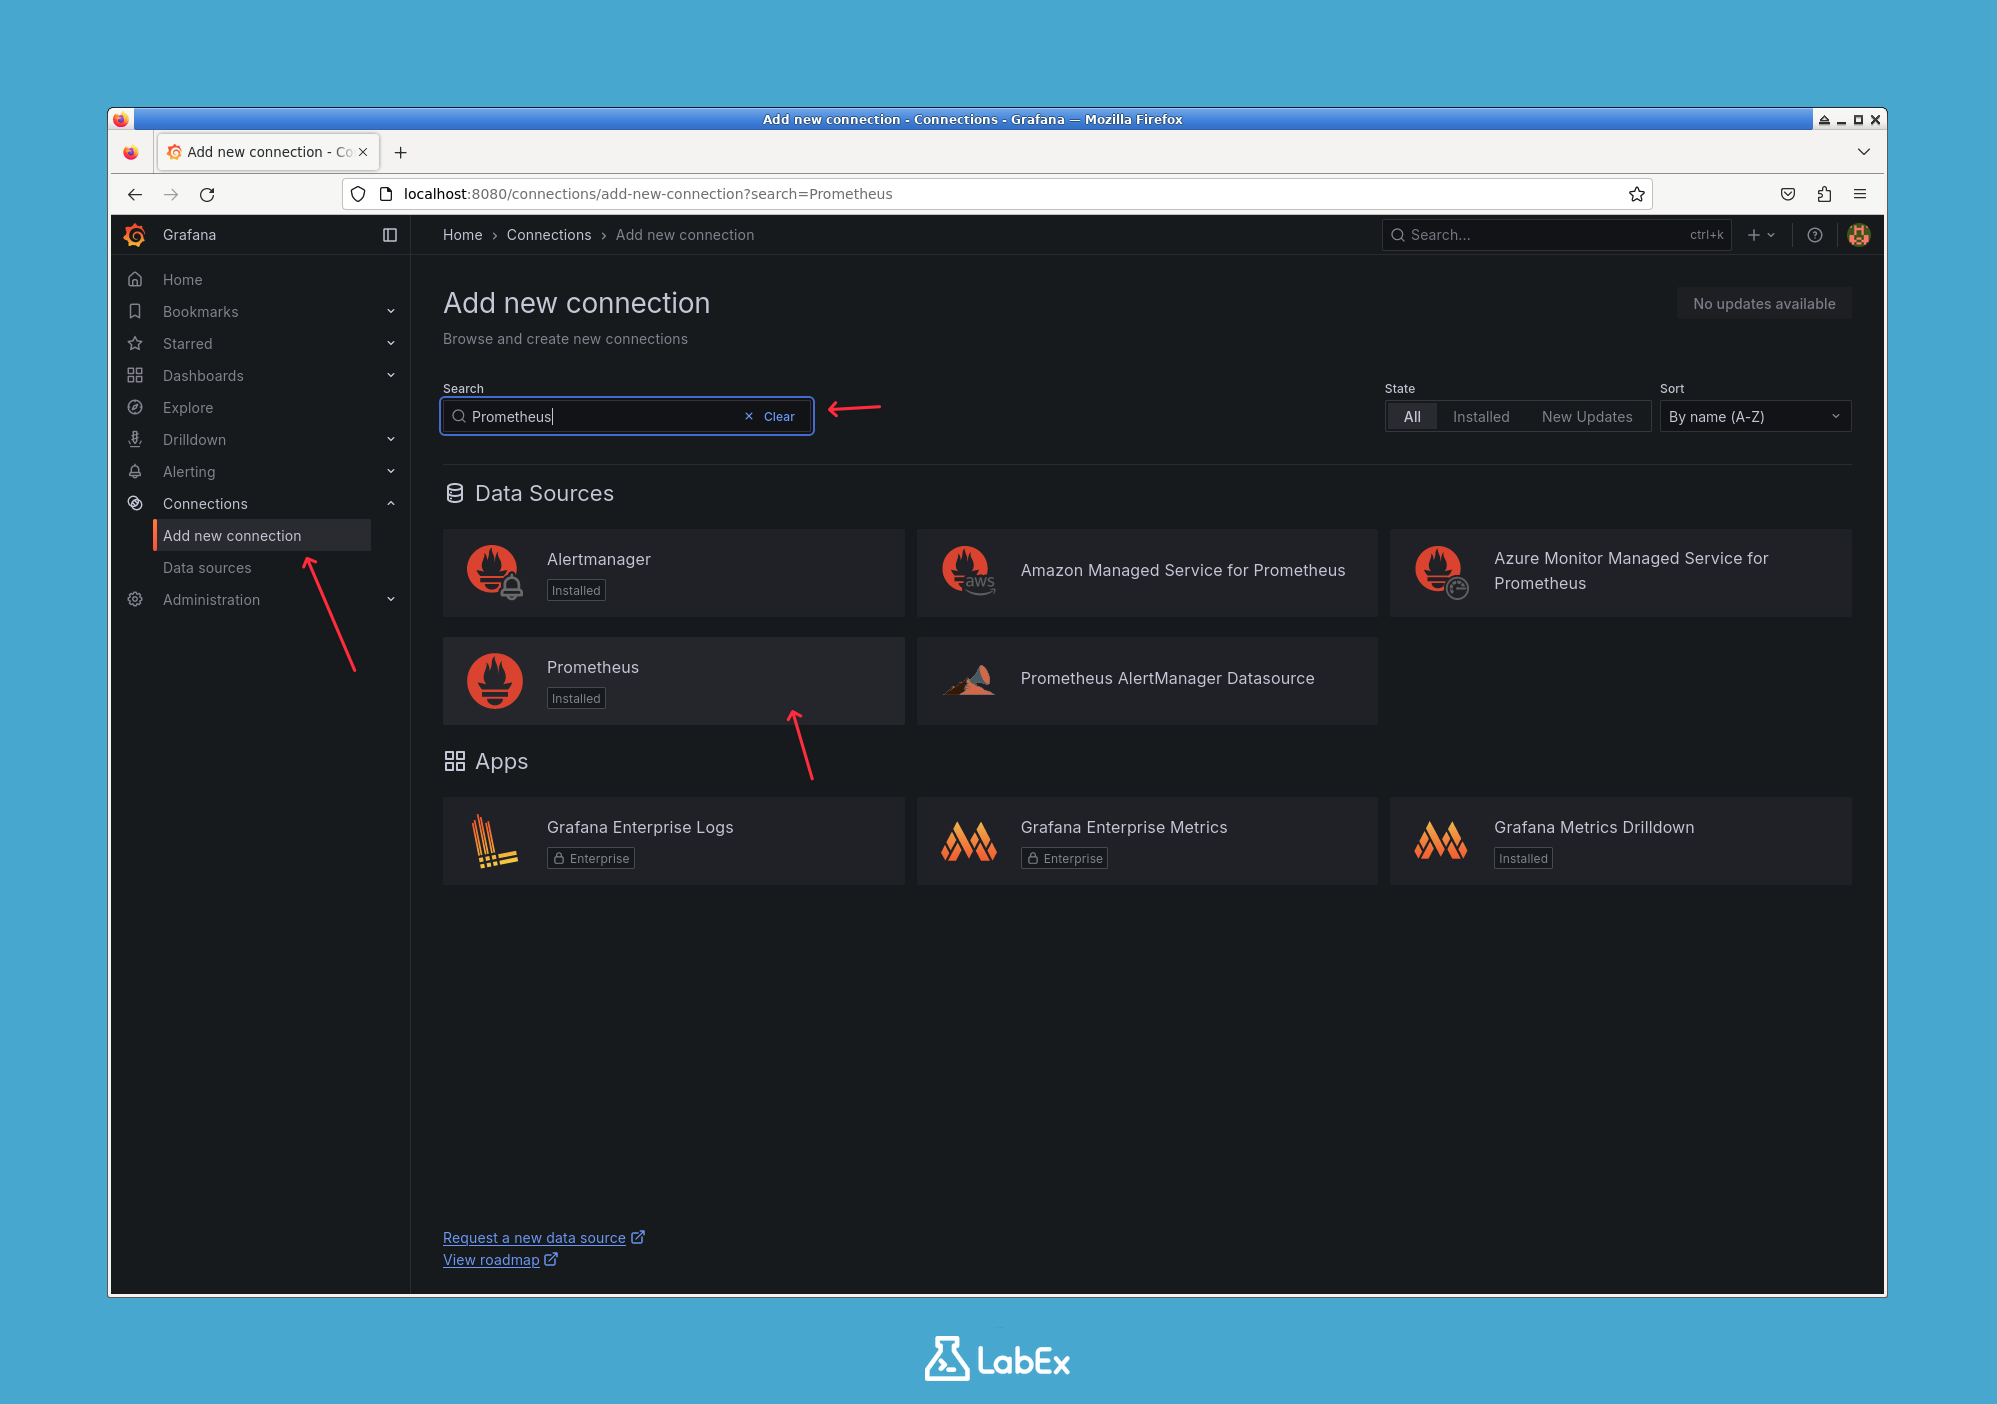
Follow these instructions within the Grafana UI:
- On the left-hand menu, click the Connections icon (looks like a plug or connector).
- In the Connections page, click on Data sources.
- On the Data sources page, click the Add new data source button.
- From the list of available data source types, select Prometheus.
Now you need to configure the connection settings. The most important setting is the URL.
- In the Prometheus server URL field, enter
http://prometheus:9090.
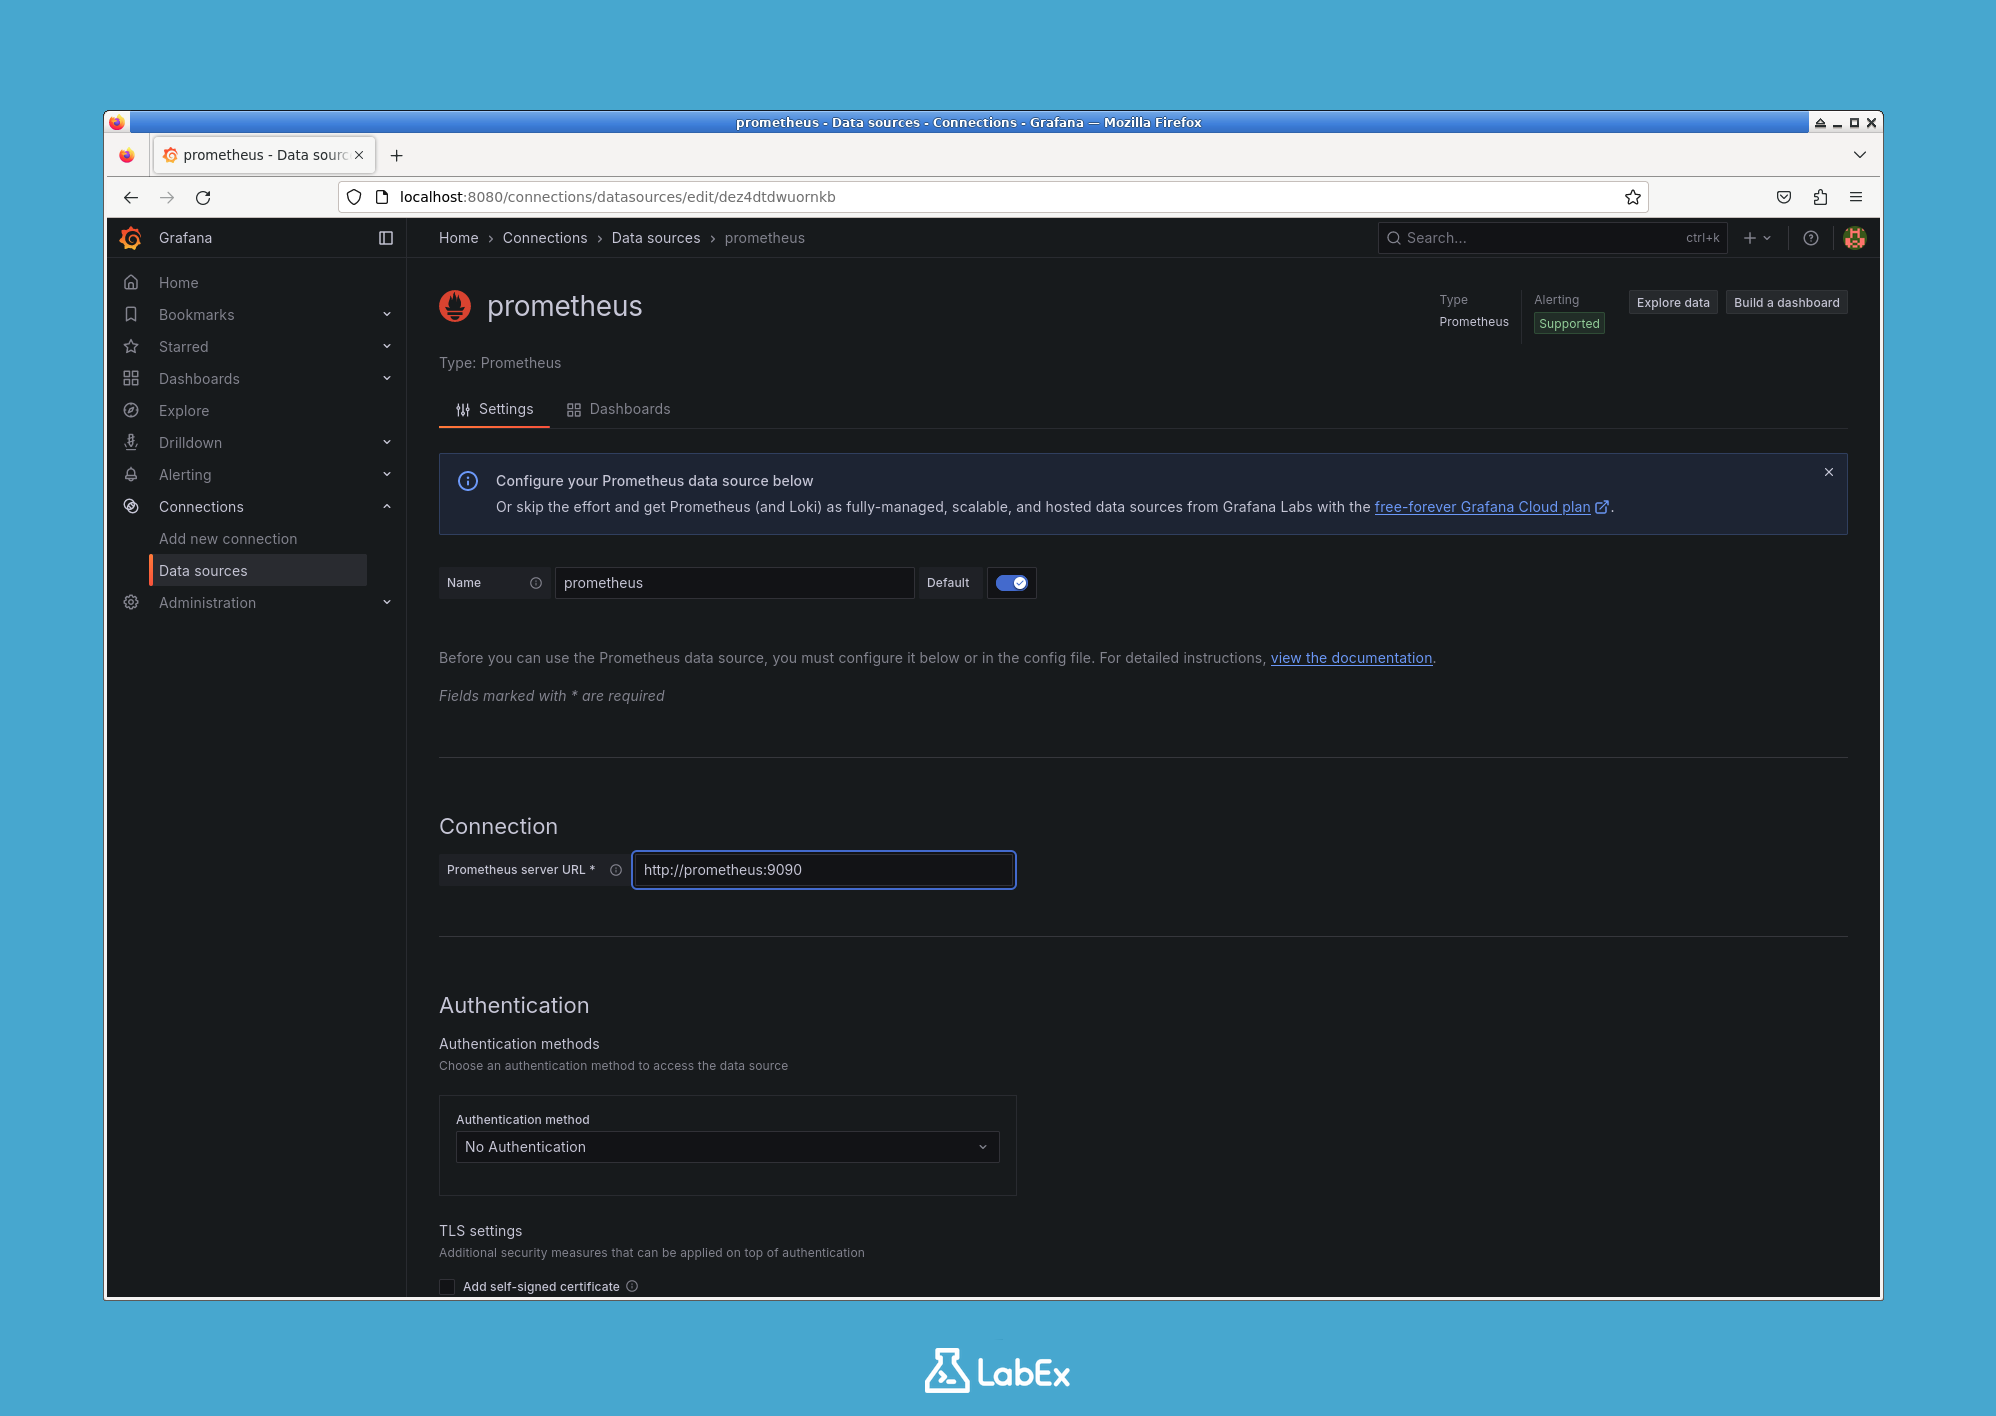
This URL works because both the Grafana and Prometheus containers are connected to the same Docker network (monitoring). Docker's internal DNS allows containers on the same network to resolve each other by their container name (prometheus in this case).
After entering the URL, scroll to the bottom of the page and click the Save & test button.
Grafana will attempt to connect to the Prometheus server. If the connection is successful, you will see a green notification that says "Data source is working".
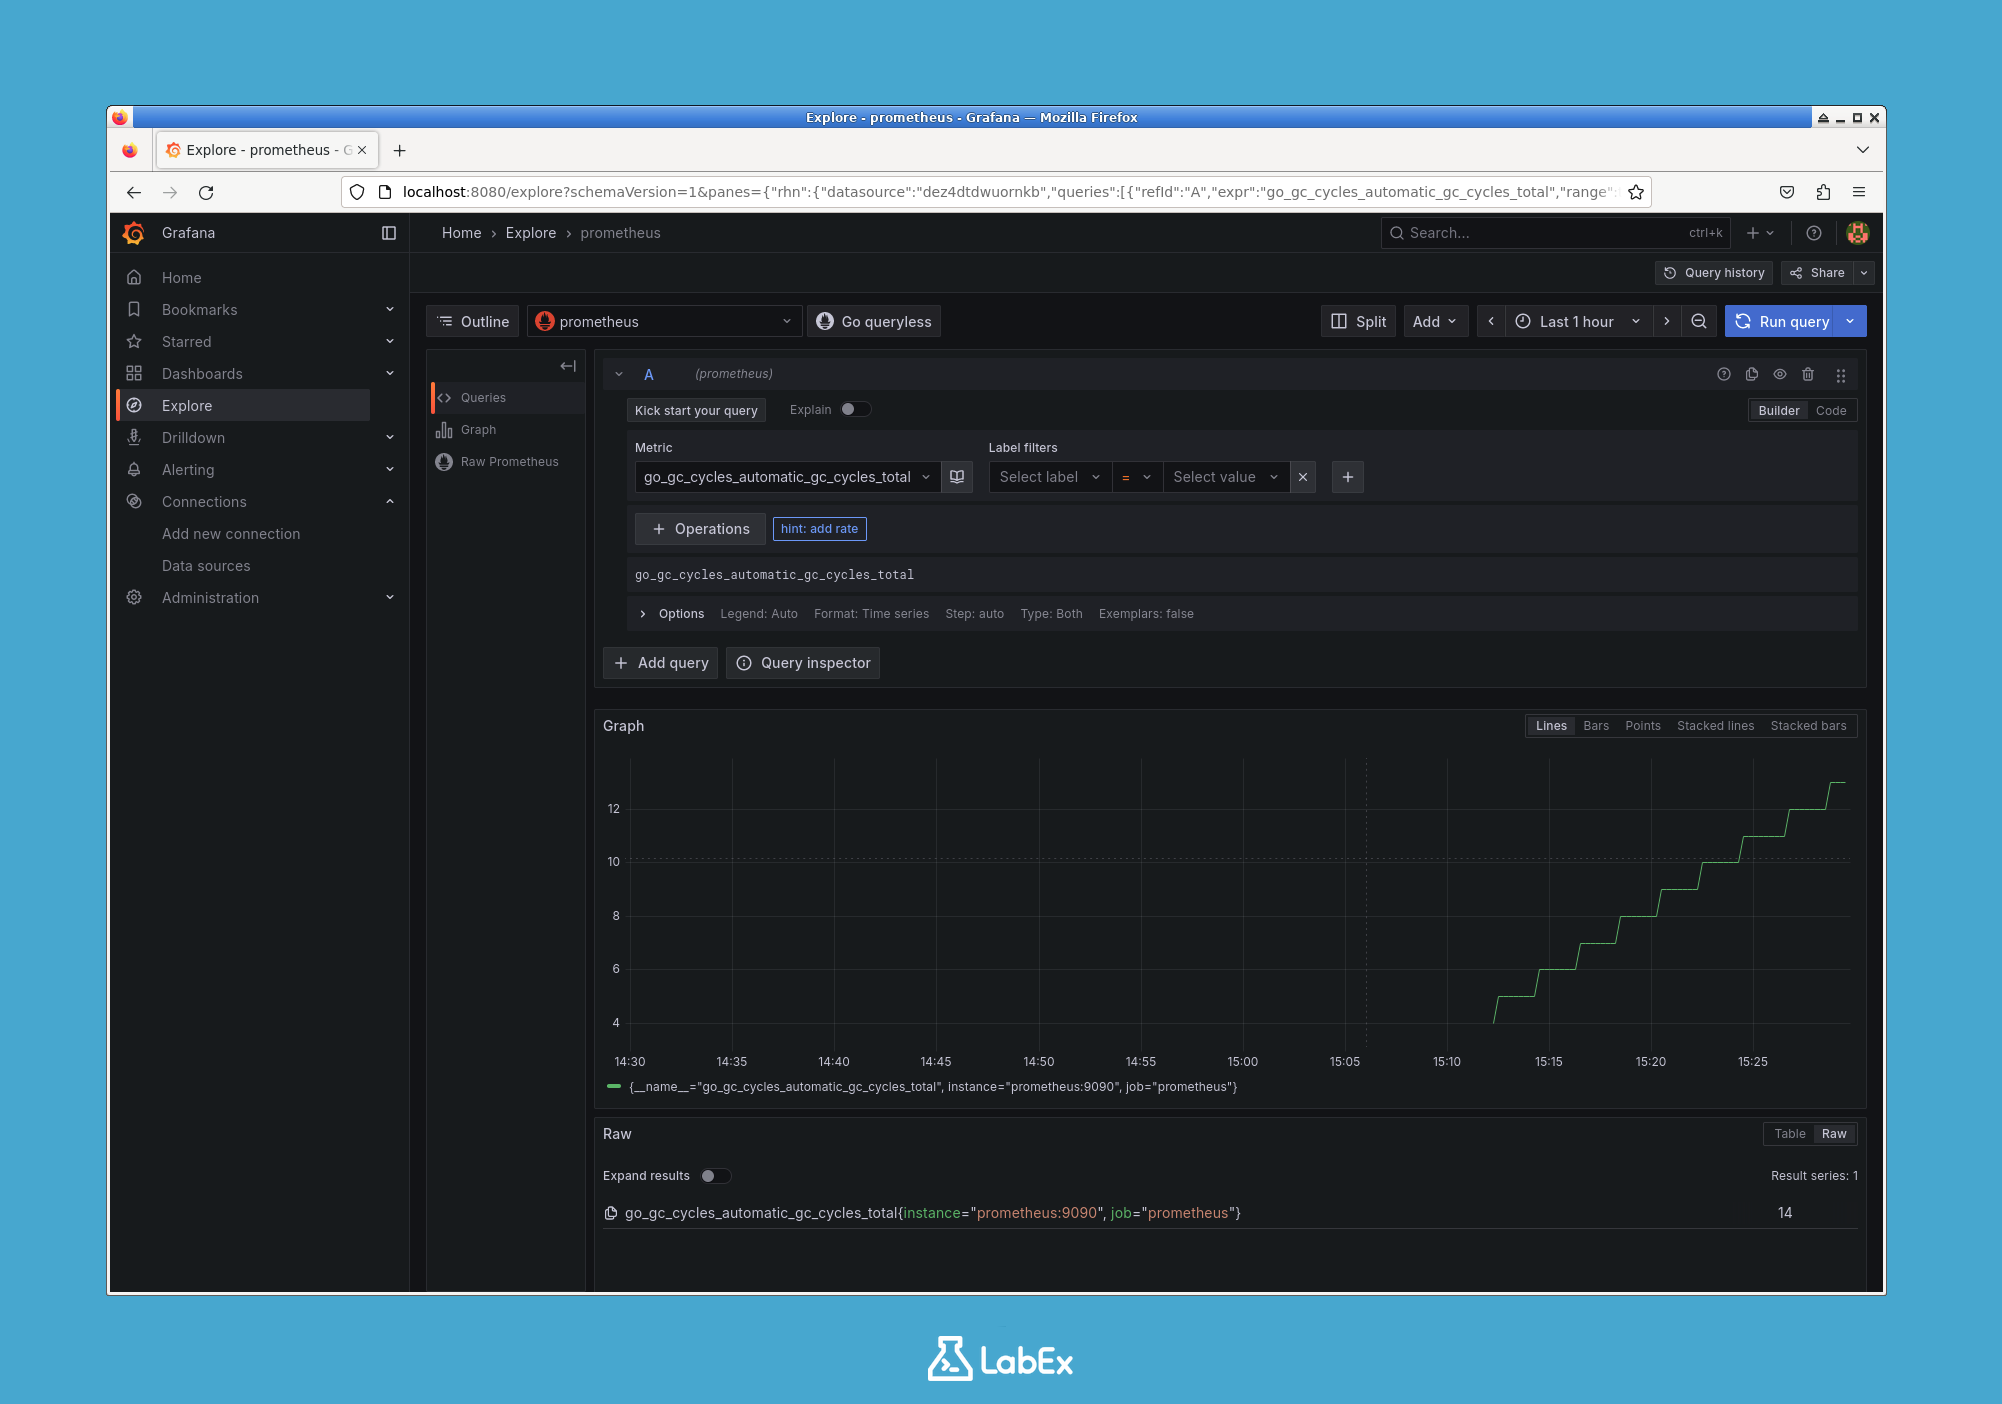
You can now follow the guide to explore Grafana's features. After adding Prometheus as a data source, feel free to click on Explore in the left-hand menu. Here, you can run queries against your Prometheus data and visualize the results in real time. Try out different queries to get familiar with how Grafana interacts with your metrics!
Summary
Congratulations! You have successfully completed this lab.
In this lab, you have learned several fundamental skills for working with Grafana and Docker:
- How to pull an official Docker image from Docker Hub.
- How to run a Docker container with specific network and port configurations.
- How to access a web application running inside a container.
- How to perform the initial security setup for a new Grafana instance.
- How to connect Grafana to a Prometheus data source within a shared Docker network.
You now have a fully functional Grafana instance connected to a data source, ready for you to start building powerful and insightful dashboards to visualize your data.