
Introduction
🧑💻 New to Linux or LabEx? We recommend starting with the Quick Start with Linux course.
Hi there, welcome to LabEx! In this first lab, you'll learn the classic "Hello, World!" program in Matplotlib.
Click the Continue button below to start the lab.
Hello Matplotlib
Let's start by importing the Matplotlib library. Open a new terminal and type:
python3
This will open a Python interpreter. Now, let's import the Matplotlib library:
import matplotlib.pyplot as plt
Now, let's create a NumPy array with 1000 values between 0 and 2π:
import numpy as np
x = np.linspace(0, 2*np.pi, 1000)
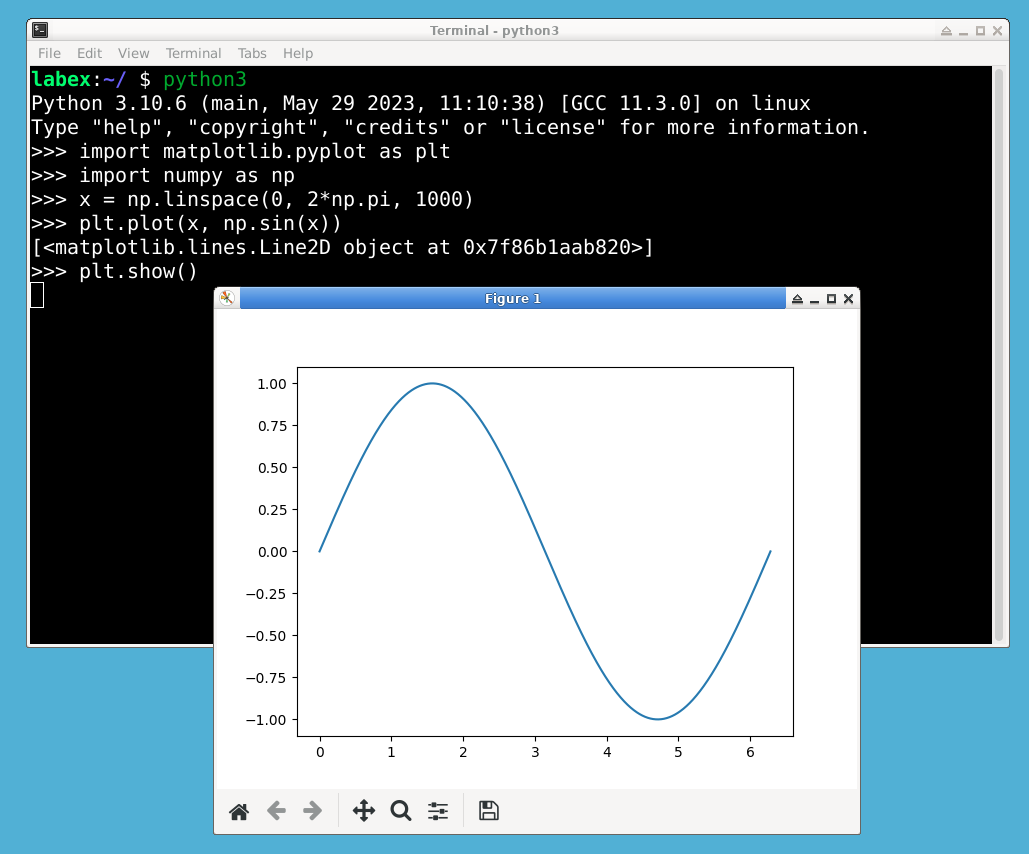
Now, let's create a plot and show it:
plt.plot(x, np.sin(x))
plt.show()
Summary
Congratulations! You have completed your first LabEx Lab.
If you want to learn more about LabEx and how to use it, you can visit our Support Center . Or you can watch the video to learn more about LabEx.
Programming is a long journey, but Next Lab is just one click away. Let's do it!


