
Introduction
In this lab, you will learn how to filter network traffic using Wireshark, an essential tool for network analysis. You will practice analyzing a pre-captured packet file, applying display filters to isolate specific traffic, and exporting the filtered results for further examination. These skills will help you identify network patterns, troubleshoot connectivity issues, and understand network communications.
Getting Started with Tshark
Before diving into the graphical interface, you will start with tshark, the command-line version of Wireshark. It is a powerful tool for quick analysis and scripting. In this step, you will verify the installation and perform a basic inspection of a provided packet capture file.
First, verify that
tsharkis installed correctly by checking its version.tshark --versionYou should see output indicating the Wireshark and
tsharkversion, similar to this:TShark (Wireshark) x.x.x (Git vx.x.x packaged as x.x.x-1) ...A sample packet capture file named
capture.pcaphas been placed in your project directory. Use thelscommand to confirm its presence.ls -lh capture.pcapThe output will show the file details, including its size and name.
-rw-rw-r-- 1 labex labex 9.1M Oct 24 2015 capture.pcapTo get a high-level summary of the capture file, use the
capinfosutility, which comes with Wireshark.capinfos capture.pcapThis command provides metadata about the file, such as the number of packets, capture duration, and average packet size.
File name:           capture.pcap
File type:           Wireshark/tcpdump/... - pcap
File encapsulation:  Ethernet
File timestamp precision:  microseconds (6)
Packet size limit:   file hdr: 65535 bytes
Number of packets:   14 k
File size:           9444 kB
Data size:           9216 kB
Capture duration:    298.505344 seconds
First packet time:   2011-01-26 02:52:22.484409
Last packet time:    2011-01-26 02:57:20.989753
Data byte rate:      30 kBps
Data bit rate:       247 kbps
Average packet size: 646.28 bytes
Average packet rate: 47 packets/s
SHA256:              77d06d3f33f1a95fb9f2610f20ead8ce978449077d6ba22d4945b85bd48f75d1
RIPEMD160:           68e950b2e438c7be011a46646ddfc8105b65b339
SHA1:                06e502dca8dbfe8e6a9cabc61f722d94756f6db9
Strict time order:   True
Number of interfaces in file: 1
Interface #0 info:
                     Encapsulation = Ethernet (1 - ether)
                     Capture length = 65535
                     Time precision = microseconds (6)
                     Time ticks per second = 1000000
                     Number of stat entries = 0
                     Number of packets = 14261
Finally, use
tsharkto read the first five packets from the file. The-rflag specifies the input file, and-climits the packet count.tshark -r capture.pcap -c 5This will display a one-line summary for each of the first five packets, giving you a quick glimpse of the traffic.
    1   0.000000 192.168.3.131 → 72.14.213.138 HTTP 997 GET /complete/search?client=chrome&hl=en-US&q=cr HTTP/1.1
    2   0.029841 72.14.213.138 → 192.168.3.131 HTTP 440 HTTP/1.1 200 OK  (text/javascript)
    3   0.223883 192.168.3.131 → 72.14.213.102 TCP 66 55950 → 80 [SYN] Seq=0 Win=8192 Len=0 MSS=1460 WS=4 SACK_PERM=1
    4   0.229423 192.168.3.131 → 72.14.213.138 TCP 54 57011 → 80 [ACK] Seq=944 Ack=387 Win=16192 Len=0
    5   0.242649 72.14.213.102 → 192.168.3.131 TCP 66 80 → 55950 [SYN, ACK] Seq=0 Ack=1 Win=5720 Len=0 MSS=1430 SACK_PERM=1 WS=64
Basic Filtering with Tshark
Packet captures can contain thousands of packets, making it difficult to find specific information. Display filters are used to narrow down the view to only the packets that match certain criteria. In this step, you will learn to apply basic filters using tshark.
Display filters are applied using the
-Y(uppercase Y) flag. To view only TCP packets, use the filtertcp. Let's view the first five TCP packets in the file.tshark -r capture.pcap -Y "tcp" -c 5The output will now only show packets where the protocol is TCP.
You can also filter based on IP addresses. To see all packets originating from the source IP address
192.168.3.131, use theip.srcfilter.tshark -r capture.pcap -Y "ip.src == 192.168.3.131" -c 5Notice the use of
==for an exact match.Filters can be combined using logical operators like
&&(AND). To find TCP packets from the source IP192.168.3.131, combine the two previous filters.tshark -r capture.pcap -Y "tcp && ip.src == 192.168.3.131"You can save the filtered output to a new capture file for later analysis. The
-wflag specifies the output file. Let's save the filtered TCP packets to a file namedfiltered_tcp.pcap.tshark -r capture.pcap -Y "tcp && ip.src == 192.168.3.131" -w filtered_tcp.pcapVerify that the new file was created.
ls -lh filtered_tcp.pcapYou will see your new, smaller capture file listed in the directory.
Exploring Traffic with the Wireshark GUI
While tshark is excellent for automation, the Wireshark graphical user interface (GUI) provides a rich, interactive environment for deep packet analysis. In this step, you will launch the Wireshark GUI and explore its main components.
Launch the Wireshark application from your terminal. Important: Make sure you are using the Desktop Interface, not a standalone Terminal Interface, as Wireshark is a GUI application that requires a graphical environment to run properly. The ampersand
&at the end runs the application in the background, freeing up your terminal for other commands.wireshark &Note: If you try to run this command in a standalone terminal without a desktop environment, Wireshark will fail to start. Always use the Desktop Interface for GUI applications.
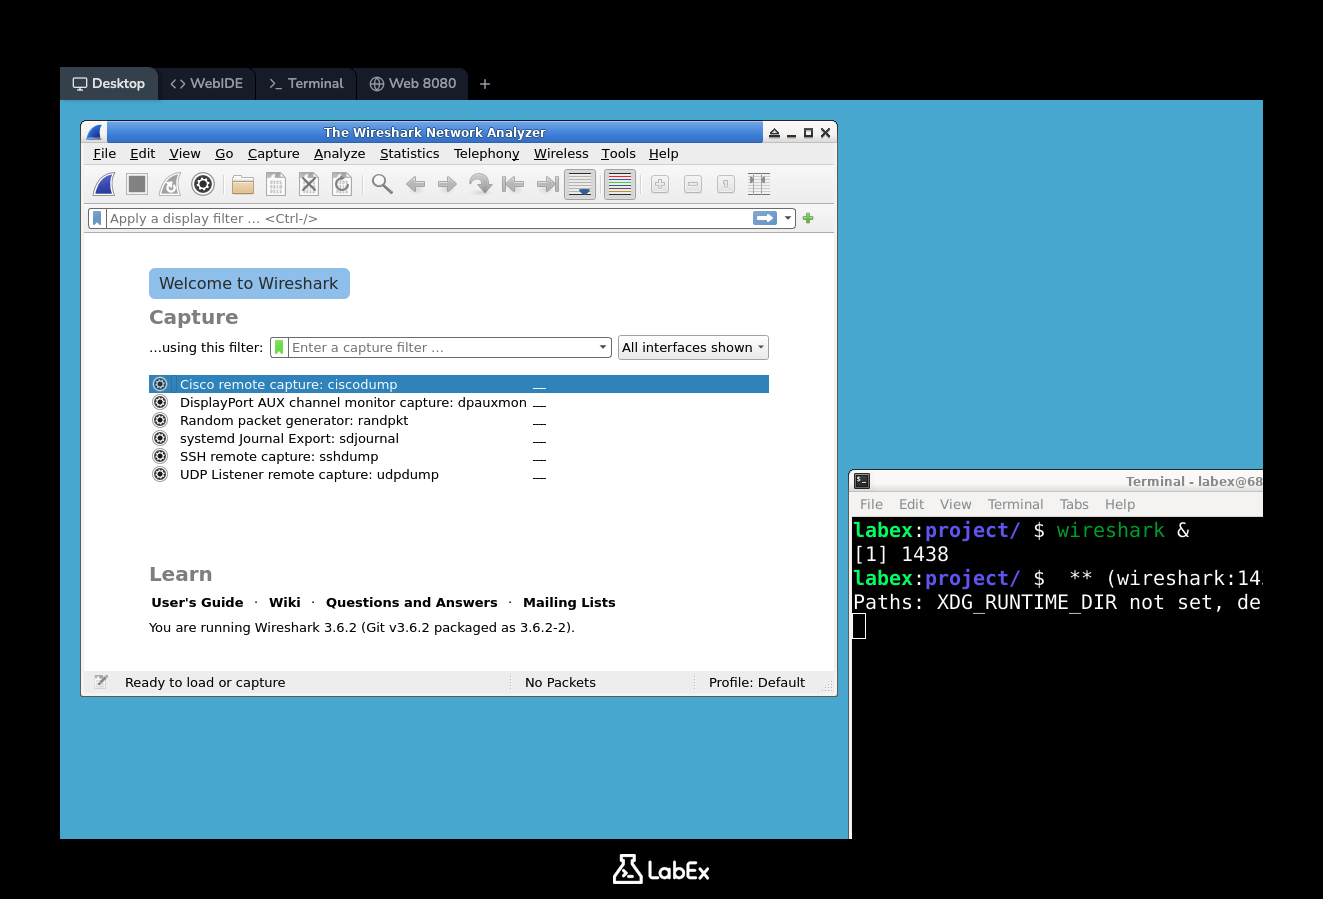
The Wireshark main window will appear. Since we are analyzing an existing file, you do not need to select a network interface. Instead, open the
capture.pcapfile.- Go to the menu bar and click
File->Open.... - In the file dialog, navigate to
/home/labex/projectand selectcapture.pcap. - Click the
Openbutton.
- Go to the menu bar and click
The main window will now be populated with the packets from the file. Take a moment to familiarize yourself with the three main panes:
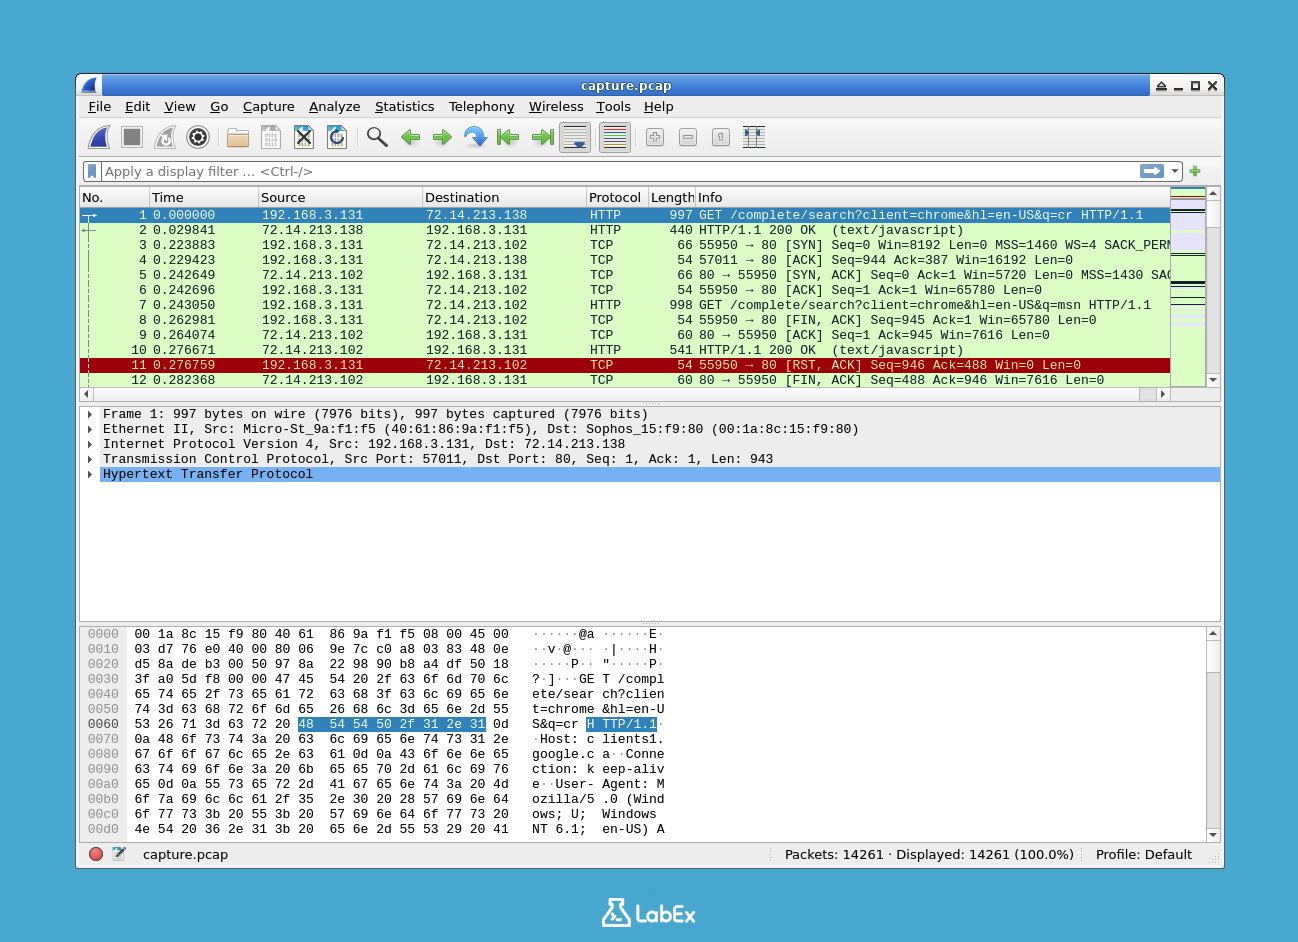
- Packet List Pane (Top): A list of all packets in the capture, with columns for packet number, time, source, destination, protocol, and other summary information.
- Packet Details Pane (Middle): A detailed, expandable view of the protocol layers for the currently selected packet in the list pane. You can expand each layer (e.g., Ethernet, IP, TCP) to see its fields.
- Packet Bytes Pane (Bottom): The raw data of the selected packet, displayed in hexadecimal and ASCII formats.
Click on different packets in the Packet List Pane and observe how the information in the Packet Details and Packet Bytes panes updates accordingly. This interactive exploration is one of Wireshark's most powerful features.
Applying Display Filters in the GUI
The display filter syntax you learned with tshark works identically in the Wireshark GUI. The GUI provides immediate visual feedback, making it easy to build and test complex filters.
Locate the display filter bar at the top of the Wireshark window. It's a long text entry field, often with "Apply a display filter..." as placeholder text.
Let's filter for HTTP traffic. Type
httpinto the filter bar and pressEnteror click theApplybutton (an arrow to the right of the bar).http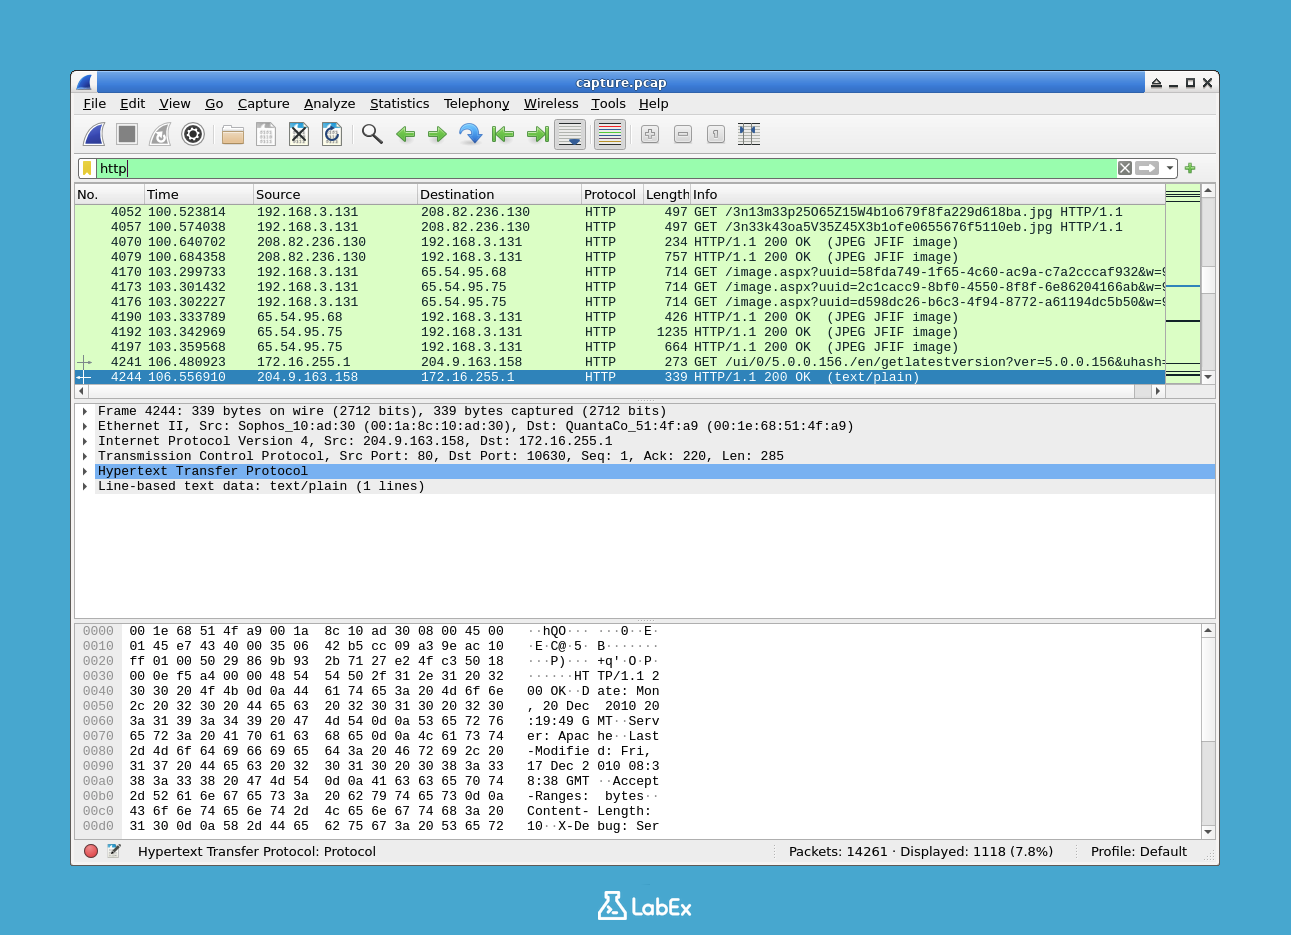
The Packet List pane will instantly update to show only HTTP packets. Notice the filter bar turns green, indicating a valid filter syntax. If you type an invalid filter, it will turn red.
Now, let's find all DNS traffic. Clear the previous filter, type
dnsinto the filter bar, and pressEnter.dnsYou will now see all the Domain Name System queries and responses in the capture.
You can combine filters just as you did with
tshark. To find HTTP traffic involving the IP address192.168.3.131(as either source or destination), use theip.addrfilter combined with thehttpfilter.http && ip.addr == 192.168.3.131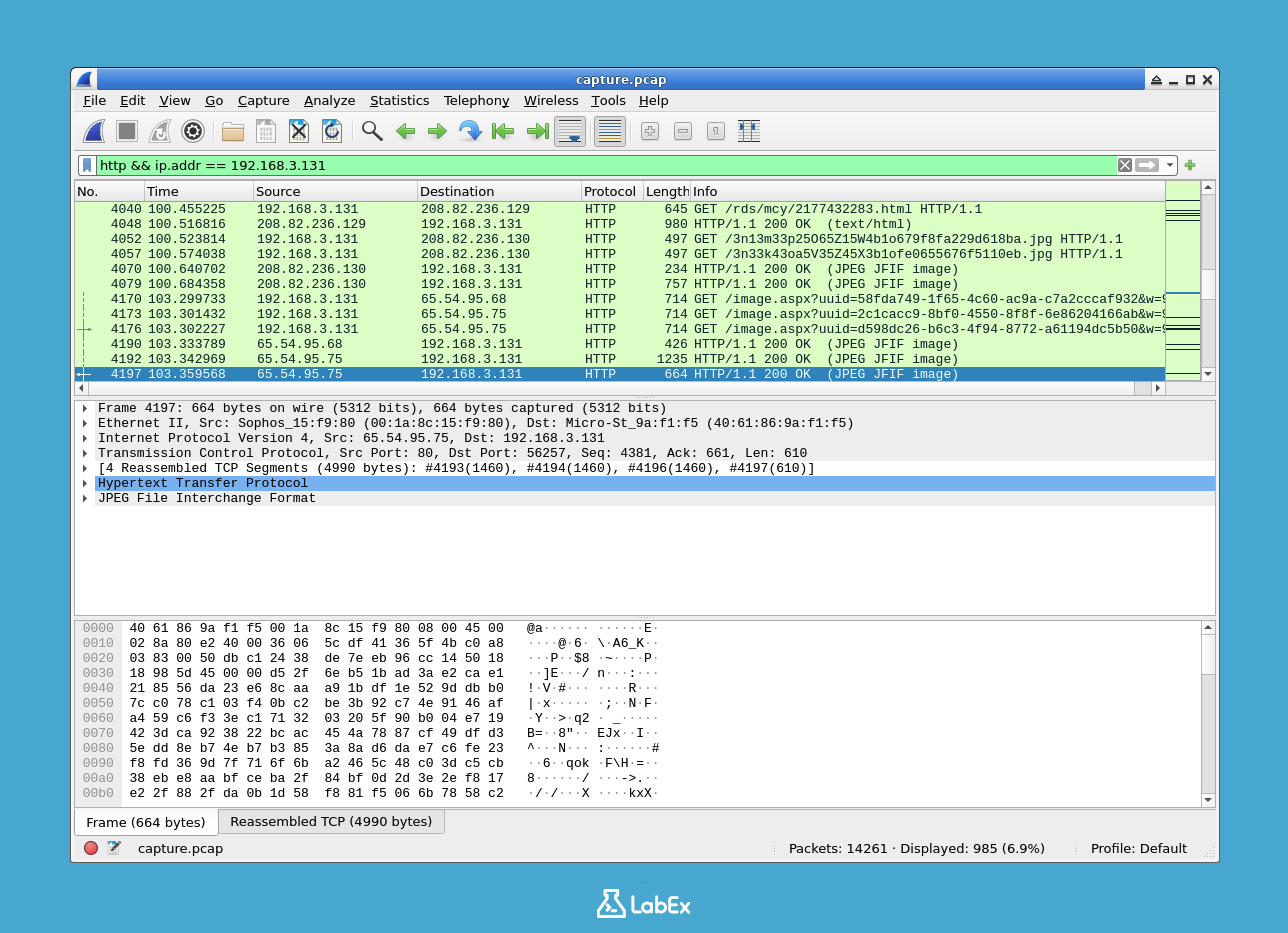
This powerful combination allows you to zero in on specific conversations. Experiment with other filters, such as
tcp.port == 80(for traffic on the standard HTTP port) orudp(for UDP traffic). To clear a filter and see all packets again, click theXbutton in the filter bar.
Exporting Filtered Data
After filtering traffic to isolate an event of interest, you often need to export the results for reporting, sharing, or further analysis in other tools. Wireshark and tshark provide multiple ways to export data.
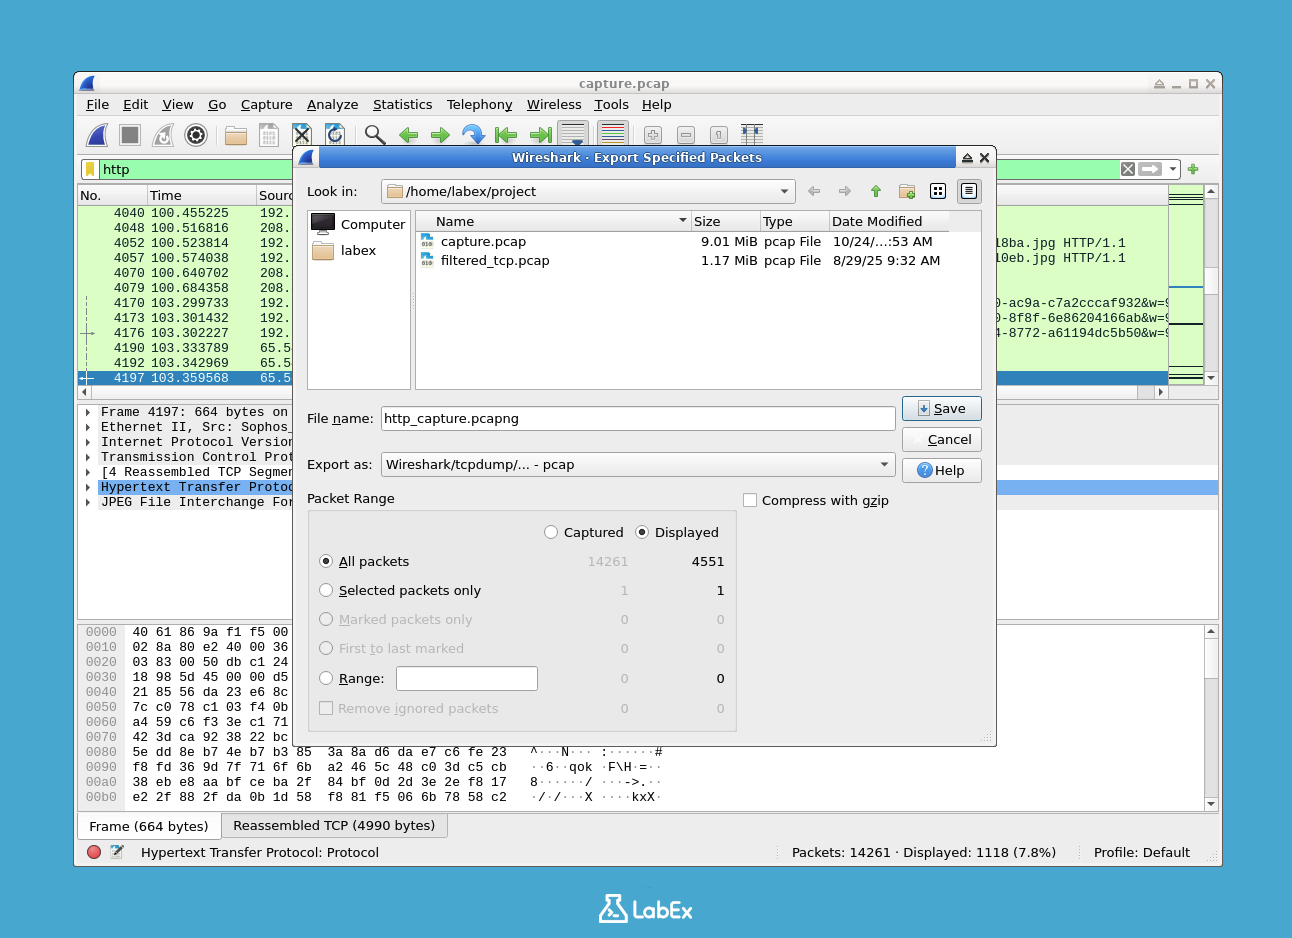
First, in the Wireshark GUI, apply the
httpfilter as you did in the previous step.To save only the displayed (filtered) packets into a new capture file:
- Go to
File->Export Specified Packets.... - In the dialog box, ensure the
Displayedradio button is selected under "All Packets". - Name the file
http_capture.pcapand save it in your/home/labex/projectdirectory.
- Go to
You can also export the packet summary as a text or CSV file. To export as CSV:
- Go to
File->Export Packet Dissections->As CSV.... - Ensure
Displayedis selected for the "All Packets". - Name the file
http_packets.csvand save it in your project directory.
- Go to
You can perform the same export operations using
tsharkon the command line. This is useful for automation. The following command reads the originalcapture.pcap, filters forhttp, and exports specific fields to a CSV file.tshark -r capture.pcap -Y "http" -T fields -e frame.number -e ip.src -e ip.dst -e http.request.method -e http.host -E header=y -E separator=, > http_export_cli.csv-T fields: Specifies the output format.-e ...: Specifies the fields (columns) to export.-E header=y: Adds a header row.-E separator=,: Uses a comma as the separator.
Verify that your exported files have been created.
ls -lh http_*You should see the files
http_capture.pcap,http_packets.csv, andhttp_export_cli.csvin your directory.
Summary
In this lab, you have learned the fundamentals of filtering network traffic with Wireshark and its command-line counterpart, tshark. You started by inspecting a capture file with tshark and capinfos. You then practiced applying display filters to isolate specific protocols and IP addresses, first with tshark and then within the interactive Wireshark GUI. Finally, you learned how to export your filtered results into new capture files and human-readable CSV files for reporting and analysis. These core skills are foundational for any network analysis or troubleshooting task.

