Introduction
Imagine looking for a specific sentence in a library with 10 million books. You can't read every book one by one. You need a Search Engine.
For logs, this search engine is called LogQL (Log Query Language).
LogQL plays a role for logs similar to what PromQL plays for metrics: it gives you a structured way to select, filter, and transform large volumes of operational data into focused answers.
In this lab, you will use LogQL to search and filter centralized logs. Query languages matter in observability because once data volume grows, useful troubleshooting depends on precise selection rather than manual reading.
- Select the "Bookshelf" (Select logs by label).
- Scan for Keywords (Filter for specific words like "ERROR").
- Perform Advanced Search (Use "Regular Expressions" for complex patterns).
Access Grafana Explore
In this step, you will open the Loki data source in Grafana Explore. The lab starts Loki, Promtail, and a generator that writes sample logs.
Check that Loki is ready
From the VM terminal, run:
curl -fsS http://localhost:3100/ready
Wait for ready. If Loki is still starting, wait a few seconds and retry.
Open Explore
Switch to the Desktop tab, open Firefox inside the VM, and go to http://localhost:8080. The lab uses Grafana 9.2.10. Sign in as admin with password admin and select Skip when prompted to change the password.
Open Explore using the compass icon in the left sidebar. At the top of Explore, select Loki if it is not already selected.
Select Log Stream
In this step, you will select the stream whose labels identify the sample logs. A label selector tells Loki which streams to search.
Run the selector
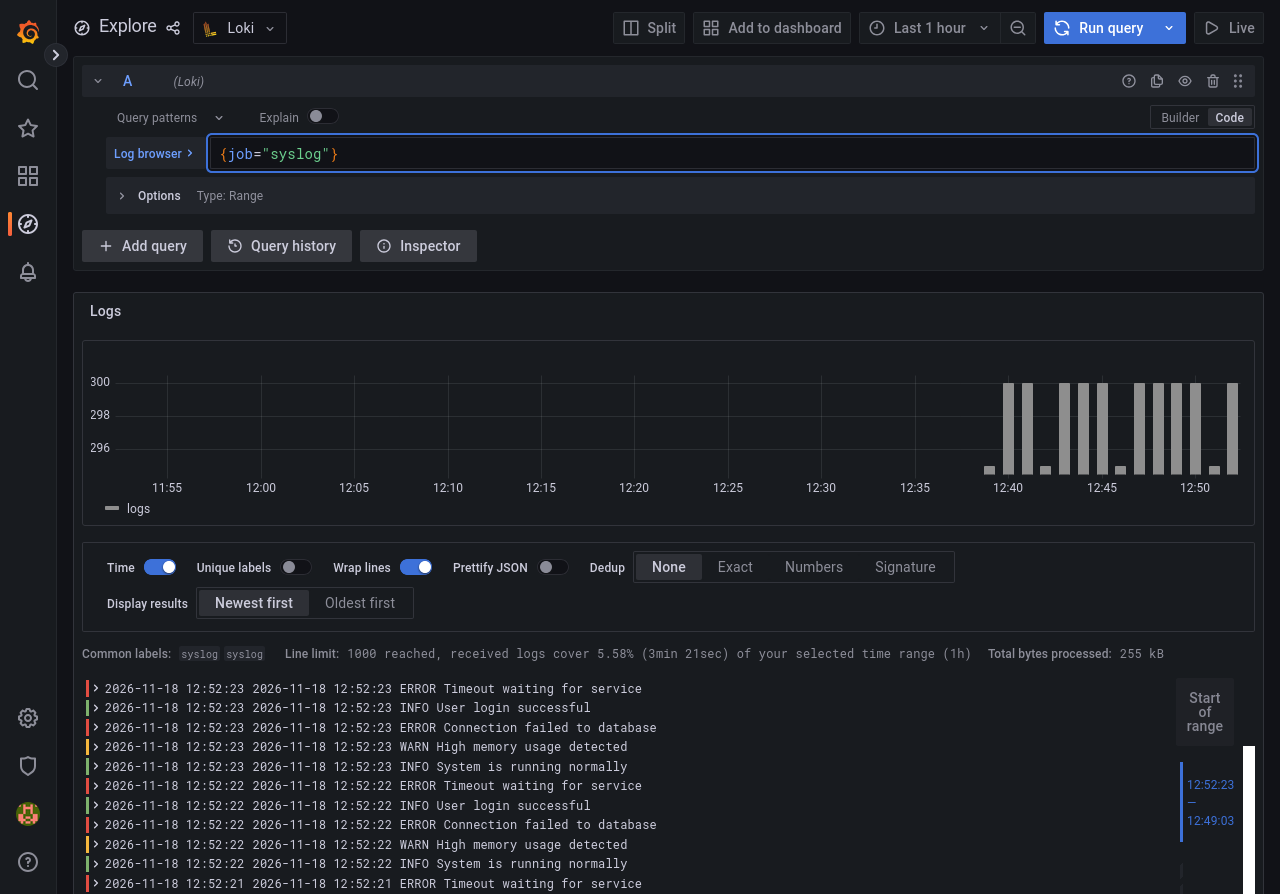
In Explore, switch to Code and enter:
{job="syslog"}
The braces enclose a label selector. This one selects streams whose job label equals syslog. Press Shift + Enter in the editor to run the query. The results should contain timestamped INFO, WARN, and ERROR messages. Wait briefly and run the query again if the generator has just started.
Save the query for the check
In the VM terminal, save the same query. The check reads the file and runs the query against Loki.
echo '{job="syslog"}' > ~/project/q1.txt
Filter Logs
In this step, you will narrow the selected stream to messages containing ERROR.
Replace the query in Code mode with:
{job="syslog"} |= "ERROR"
The |= operator keeps lines that contain the exact text on its right. The != line filter does the opposite. Run the query with Shift + Enter and confirm that the displayed lines contain ERROR.
Save the filter from the VM terminal:
echo '{job="syslog"} |= "ERROR"' > ~/project/q2.txt
Use Regex Search
In this step, you will use a regular expression to keep messages containing either ERROR or WARN.
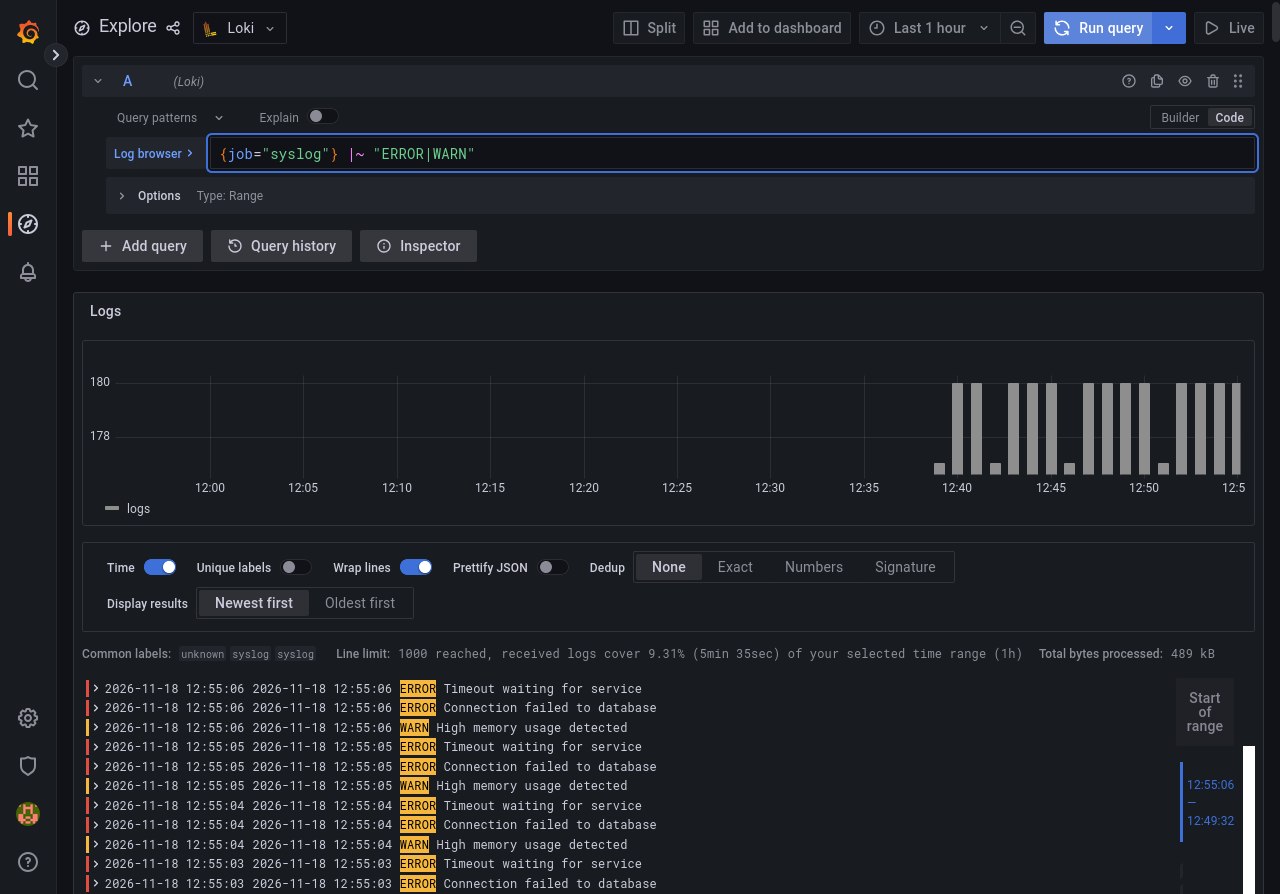
In Code mode, enter:
{job="syslog"} |~ "ERROR|WARN"
The |~ line filter matches a regular expression. Inside "ERROR|WARN", the single pipe means “or.” Run the query with Shift + Enter and look for both kinds of messages.
Save the query from the VM terminal:
echo '{job="syslog"} |~ "ERROR|WARN"' > ~/project/q3.txt
Summary
In this lab, you learned how to search your Log Library using LogQL.
You learned the three basic steps of searching:
- Select (
{...}): Pick the bookshelf you want to look at (e.g.,job="syslog"). - Filter (
|=): Find simple keywords within those logs (e.g.,"ERROR"). - Regex (
|~): Find complex patterns, like "A or B" (e.g.,"ERROR|WARN").
LogQL is very powerful. In the next lab, we will go one step further and perform calculations on these logs to create graphs, such as visualizing "Errors per Minute"!