
Introduction
In this lab, you will learn how to use Graylog, a powerful open-source log management platform, for collecting and analyzing log data. Centralized logging is a critical component of cybersecurity, allowing you to monitor system events, detect anomalies, and investigate security incidents from a single interface.
You will start by deploying the entire Graylog stack, which includes MongoDB and OpenSearch (the modern replacement for Elasticsearch), using Docker Compose. You will then configure Graylog to receive log data, send sample logs to it, perform search queries to filter information, and finally, build a visual dashboard to monitor key metrics. By the end of this lab, you will have hands-on experience with the fundamental workflow of log analysis in Graylog.
Deploy Graylog with Docker Compose
In this first step, you will deploy the Graylog logging platform. We will use Docker Compose v2, a tool for defining and running multi-container Docker applications. This approach simplifies the setup process by managing all the necessary components—Graylog, OpenSearch, and MongoDB—with a single configuration file.
First, let's prepare the environment and launch the services.
The setup script has already installed Docker Compose v2 for you. You can verify the installation by checking its version.
docker compose versionYou should see an output indicating the Docker Compose version, similar to this:
Docker Compose version v2.29.7Navigate to the dedicated directory for your Graylog configuration. This helps keep your project organized.
cd /home/labex/project/graylogNext, create the
docker-compose.ymlconfiguration file using thenanotext editor. This file tells Docker Compose which containers to run and how to configure them.nano docker-compose.ymlCopy and paste the following YAML configuration into the
nanoeditor. This configuration defines three services:mongodb: Stores Graylog's configuration data.opensearch: Indexes and stores the log messages for fast searching. Note that OpenSearch 2.12+ requires an initial admin password.graylog: The main application, providing the web interface and log processing engine.
services:
  mongodb:
    image: mongo:6.0
    container_name: graylog_mongodb
    volumes:
      - mongo_data:/data/db
    networks:
      - graylog_network
    healthcheck:
      test: ["CMD", "mongosh", "--eval", "db.runCommand('ping').ok"]
      interval: 30s
      timeout: 10s
      retries: 3
  opensearch:
    image: opensearchproject/opensearch:2.13.0
    container_name: graylog_opensearch
    environment:
      - discovery.type=single-node
      - plugins.security.disabled=true
      - bootstrap.memory_lock=true
      - "OPENSEARCH_JAVA_OPTS=-Xms512m -Xmx512m"
      - "OPENSEARCH_INITIAL_ADMIN_PASSWORD=StrongPassword123!"
    ulimits:
      memlock:
        soft: -1
        hard: -1
    volumes:
      - opensearch_data:/usr/share/opensearch/data
    networks:
      - graylog_network
    healthcheck:
      test:
        [
          "CMD-SHELL",
          "curl -f http://localhost:9200/_cluster/health || exit 1"
        ]
      interval: 30s
      timeout: 10s
      retries: 3
  graylog:
    image: graylog/graylog:6.1
    container_name: graylog_server
    volumes:
      - graylog_data:/usr/share/graylog/data
    environment:
      - GRAYLOG_PASSWORD_SECRET=somepasswordpepper
      - GRAYLOG_ROOT_PASSWORD_SHA2=8c6976e5b5410415bde908bd4dee15dfb167a9c873fc4bb8a81f6f2ab448a918
      - GRAYLOG_HTTP_EXTERNAL_URI=http://127.0.0.1:9000/
      - GRAYLOG_ELASTICSEARCH_HOSTS=http://opensearch:9200
      - GRAYLOG_MONGODB_URI=mongodb://mongodb:27017/graylog
    depends_on:
      mongodb:
        condition: service_healthy
      opensearch:
        condition: service_healthy
    ports:
      - "9000:9000"
      - "1514:1514"
      - "1514:1514/udp"
      - "12201:12201"
      - "12201:12201/udp"
    networks:
      - graylog_network
volumes:
  mongo_data:
  opensearch_data:
  graylog_data:
networks:
  graylog_network:
    driver: bridge
Press
Ctrl+O, thenEnterto save the file, andCtrl+Xto exitnano.Now, start all the services in the background using the
-d(detached) flag.docker compose up -dIt may take a minute or two for all services to initialize. You can check the status of your containers to ensure they are running correctly.
docker compose psYou should see all three services (
graylog_server,graylog_opensearch,graylog_mongodb) with aStateofUp.NAME IMAGE COMMAND SERVICE CREATED STATUS PORTS graylog_mongodb mongo:6.0 "docker-entrypoint.s…" mongodb About a minute ago Up About a minute (healthy) 27017/tcp graylog_opensearch opensearchproject/opensearch:2.13.0 "./opensearch-docker…" opensearch About a minute ago Up About a minute (healthy) 9200/tcp, 9300/tcp, 9600/tcp, 9650/tcp graylog_server graylog/graylog:6.1 "tini -- /docker-ent…" graylog About a minute ago Up 34 seconds (healthy) 0.0.0.0:1514->1514/tcp, :::1514->1514/tcp, 0.0.0.0:9000->9000/tcp, 0.0.0.0:1514->1514/udp, :::9000->9000/tcp, :::1514->1514/udp, 0.0.0.0:12201->12201/tcp, 0.0.0.0:12201->12201/udp, :::12201->12201/tcp, :::12201->12201/udp
The Graylog web interface is now accessible. You have successfully deployed the Graylog stack and are ready to configure it.
Configure a Syslog Input
With Graylog running, the next step is to configure an "Input." An input is a component that tells Graylog how to accept log messages. For this lab, you will create a Syslog UDP input, which is a common standard for collecting logs from network devices and Linux/Unix servers.
Open the Graylog web interface in your browser. You can do this by clicking the "Web Terminal" tab and selecting "Desktop" to open the browser, or by using the dedicated browser icon in the lab environment. Navigate to the following URL:
http://127.0.0.1:9000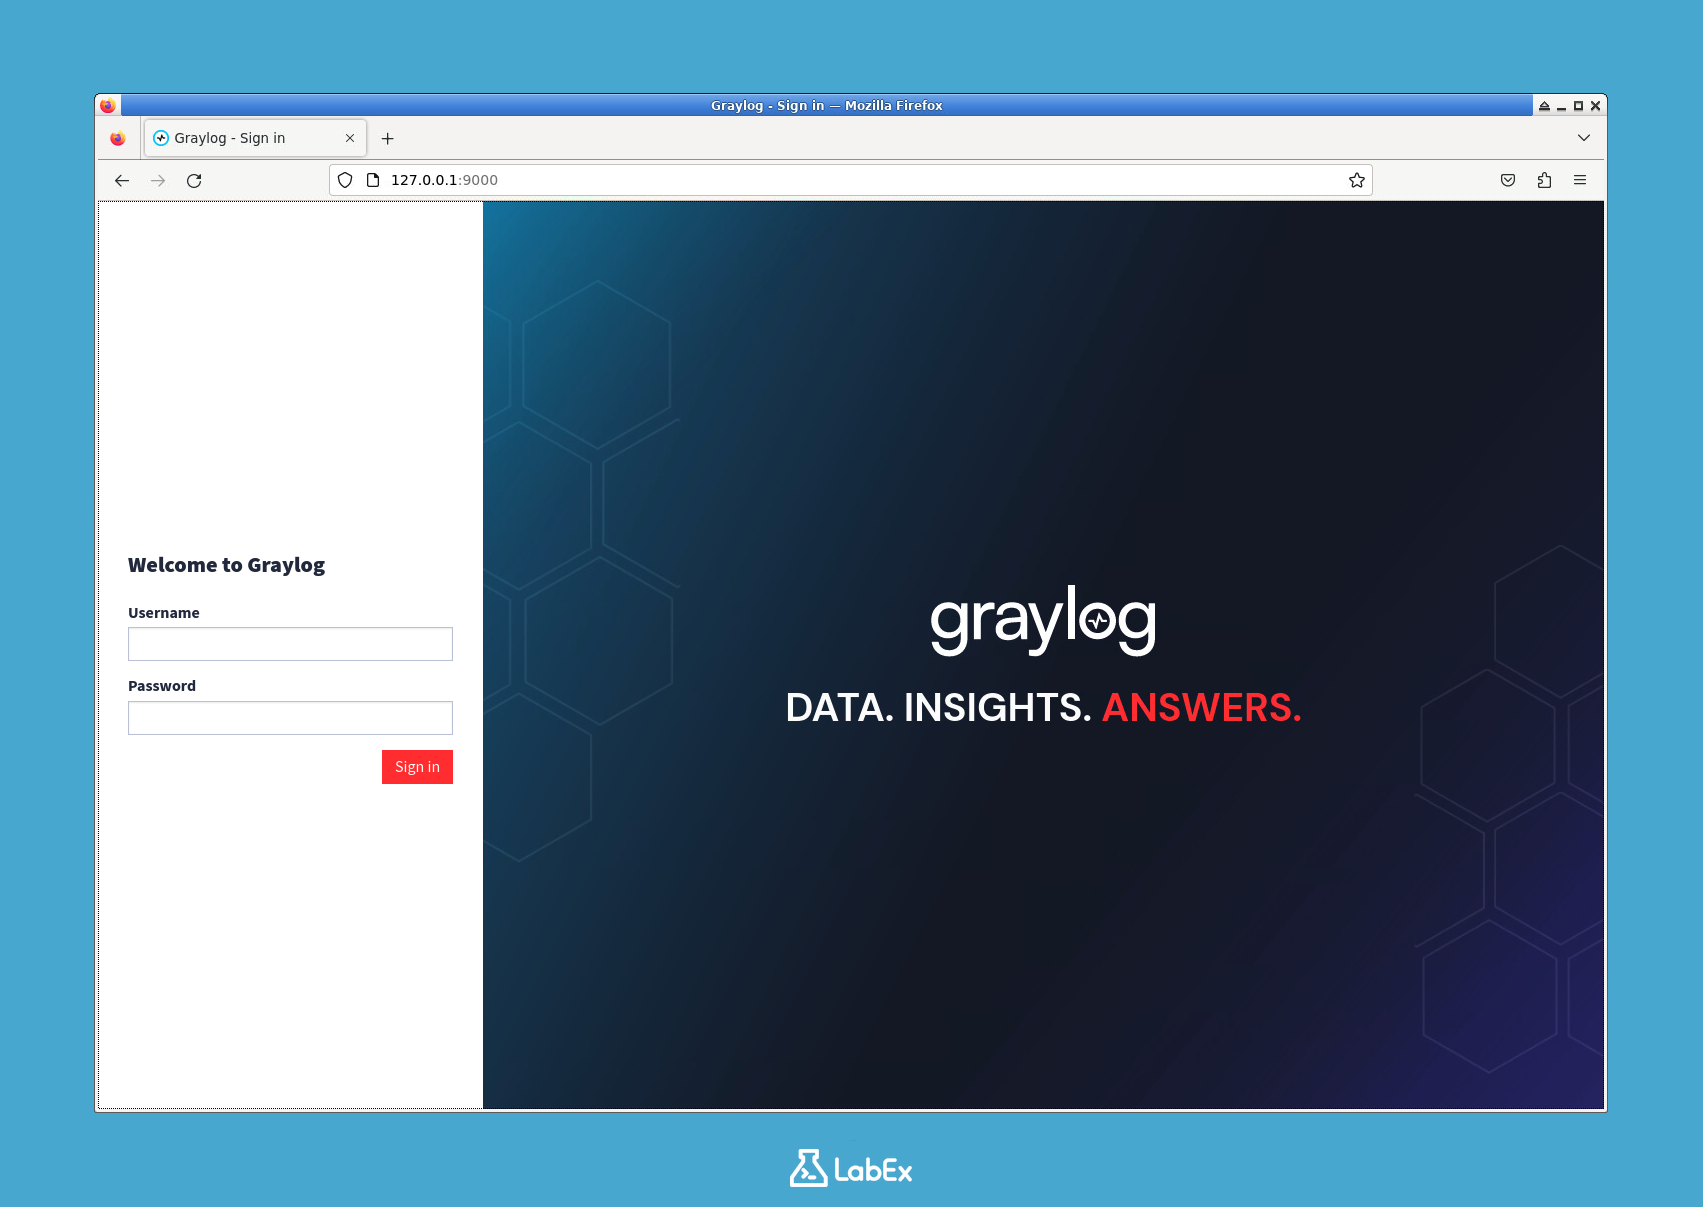
Log in with the default credentials:
- Username:
admin - Password:
admin
- Username:
Once logged in, you will create the new input. In the top navigation bar, click on System, and then select Inputs from the dropdown menu.
On the Inputs page, find the "Syslog UDP" input type in the "Select input" dropdown list and click the Launch new input button next to it.
A modal window will appear. Fill in the form with the following details to configure the input:
- Node: Select the only available node from the dropdown (it will be your Graylog server).
- Title:
Syslog UDP Input(This is a descriptive name for your input). - Bind address:
0.0.0.0(This tells Graylog to listen for logs on all network interfaces of the container). - Port:
1514(This is the port where Graylog will listen for incoming syslog messages).
Leave all other settings as their defaults and click Save.
After saving, you will be returned to the Inputs page. Your new "Syslog UDP Input" should appear in the list with a green "Running" status, indicating that it is active and ready to receive data.
To test the input, return to your terminal and send a sample log message using the
netcat(nc) utility. This command constructs a basic syslog message and sends it to the UDP port1514on your local machine.echo "<14>$(date +'%b %d %H:%M:%S') localhost labex: Test syslog message" | nc -w1 -u 127.0.0.1 1514
You have now successfully configured Graylog to receive logs. In the next step, you will send more structured logs and learn how to view them in the Graylog interface.
Send and View Sample Logs
Now that your Syslog input is ready, it's time to generate and send a batch of sample logs. This will populate Graylog with data, allowing you to practice searching and analysis. You will create a simple shell script to simulate log messages from an application.
First, navigate back to your project's root directory in the terminal.
cd /home/labex/projectCreate a new shell script named
generate_logs.shusing thenanoeditor.nano generate_logs.shCopy and paste the following script into the editor. This script generates 10 log messages in a loop. Each message has a random severity level, a timestamp, and a simple message body. It then uses
ncto send each log to the Graylog input you configured.#!/bin/bash for i in {1..10}; do severity=$(((RANDOM % 8))) timestamp=$(date +'%b %d %H:%M:%S') echo "<$((severity + 8))>$timestamp localhost sample_app[$i]: Sample log message $i with severity $severity" | nc -w1 -u 127.0.0.1 1514 echo "Sent log message $i" sleep 1 donePress
Ctrl+O,Enter, andCtrl+Xto save and exit.Make the script executable using the
chmodcommand.chmod +x generate_logs.shRun the script to send the logs to Graylog.
./generate_logs.shYou will see output in your terminal as each log is sent.
Sent log message 1
Sent log message 2
...
Sent log message 10
Now, let's view these logs in Graylog. Go back to the Graylog web interface in your browser (
http://127.0.0.1:9000).Click on the Search tab in the top navigation bar. You should see the log messages you just sent appear in the "Messages" list. It might take a few seconds for them to be indexed and displayed.
You can see how Graylog automatically parses the messages, breaking them down into fields like
timestamp,source,application_name, andseverity. This structured data is key to effective log analysis.
Query and Analyze Log Data
With logs flowing into Graylog, you can now learn how to search and filter them. Graylog's search functionality is powerful and allows you to quickly pinpoint specific events. This is essential for troubleshooting issues or investigating security incidents.
Go to the Search page in the Graylog web interface. The search bar is at the top of the page.
Let's start with a simple query. To find all logs from your simulated application, type the following into the search bar and press
Enter:application_name:sample_appThis filters the results to show only the logs where the
application_namefield is exactlysample_app.Now, try some other queries to explore different filtering capabilities:
- Find logs with a specific severity level (e.g., level 4):
severity:4 - Find logs with a severity level greater than 5 (warnings, errors, etc.):
severity:>5 - Search for a phrase within the log message:
message:"log message 5" - Combine filters using
AND:application_name:sample_app AND severity:<3
- Find logs with a specific severity level (e.g., level 4):
You can also control the time frame of your search. By default, Graylog shows logs from the "Last 5 minutes". Click on the time range selector to the left of the search bar and change it to Last 30 minutes to ensure all your generated logs are included in the search results.
To make a frequently used query easily accessible, you can save it. Let's save a search for high-severity events.
- Run the query:
severity:>4 - To the right of the search bar, click the floppy disk icon (Save Search).
- In the "Save Search" dialog, enter a Title, for example,
High Severity Events. - Click Save.
You can now access this saved search anytime from the "Saved Searches" list on the left sidebar, allowing you to quickly check for critical events.
- Run the query:
Build a Monitoring Dashboard
While the search page is great for active investigation, dashboards provide an at-a-glance overview of your log data. In this final step, you will create a dashboard with several widgets to visualize key metrics from your logs.
In the Graylog web interface, navigate to the Dashboards section from the top menu.
Click the Create dashboard button.
- Enter a Title:
Application Health Dashboard - Enter a Description:
Monitors the health and activity of sample_app. - Click Create.
- Enter a Title:
You now have an empty dashboard. Let's add some widgets to it. Click the Unlock / Edit button to enter edit mode.
Add a "Log Count" Widget: This widget will show the total number of log messages over time.
- Click Create Widget for Dashboard.
- Select Aggregation as the widget type.
- In the configuration window:
- Title:
Total Log Volume - Under "Rows", select timestamp as the field.
- Choose Bar Chart as the visualization type.
- Title:
- Click Create.
Add a "Severity Distribution" Widget: This widget will show the breakdown of logs by severity level.
- Click Create Widget for Dashboard again.
- Select Aggregation as the widget type.
- In the configuration window:
- Title:
Log Severity Distribution - Under "Rows", select severity as the field.
- Choose Pie Chart as the visualization type.
- Title:
- Click Create.
Add a "Recent Messages" Widget: This widget will display a list of the most recent log messages.
- Click Create Widget for Dashboard.
- Select Messages as the widget type.
- In the configuration window:
- Title:
Recent Log Messages - In the "Streams" field, make sure
All messagesis selected.
- Title:
- Click Create.
Once you have added the widgets, you can drag and drop them to arrange the layout. You can also resize them by dragging their corners. Arrange them in a way that is easy to read.
When you are satisfied with the layout, click the Lock / Save button in the top right corner to save your dashboard.
You have now created a basic monitoring dashboard. In a real-world scenario, dashboards like this are invaluable for keeping an eye on system health and security posture.
Summary
In this lab, you gained practical experience with the core functionalities of Graylog for log management and analysis. You started by deploying a complete Graylog environment using Docker Compose, which included the Graylog server, OpenSearch, and MongoDB.
You then configured a Syslog input to enable log collection and used a script to send sample log data, simulating real-world application logs. You learned how to use Graylog's powerful search and query language to filter and find specific information within your logs. Finally, you brought it all together by building a custom dashboard with various widgets to visualize log metrics, providing an at-a-glance view of system activity. These skills form a solid foundation for using Graylog in cybersecurity monitoring and operational intelligence.


