
Introduction
Grafana can evaluate the same data you see in a dashboard and raise an alert when a condition is met. In this lab, you will plot simulated traffic, link a Grafana-managed alert rule to the panel, and inspect how the rule is evaluated.
The lab VM runs Grafana 9.2.10. Follow the menu labels below for that version.
Prepare the Graph
In this step, you will create a dashboard panel using simulated data.
Sign in to Grafana
Switch to the Desktop tab, open Firefox inside the VM, and go to http://localhost:8080. Sign in with admin as both the username and password. On the password change page, select Skip so the lab's checks can use the VM's default credentials.
Add the data source
In the left sidebar, open the gear menu Configuration and select Data sources. Click Add data source, search for TestData DB, and select it. Click Save & test. Grafana uses this data source to generate simulated data.
Create and save the dashboard
Open Dashboards → New dashboard. Click Add a new panel. In the panel editor, select TestData DB under Data source. Keep the Time series visualization and set the query's Scenario to Random Walk. Random Walk generates a simulated series whose values change over time.
Set the panel Title to Traffic Monitor, then click Apply. Click the save icon, enter Alerting Lab as the Dashboard name, and click Save.
Create an Alert Rule
In this step, you will link an alert rule to the panel and set its threshold.
Open the alert editor
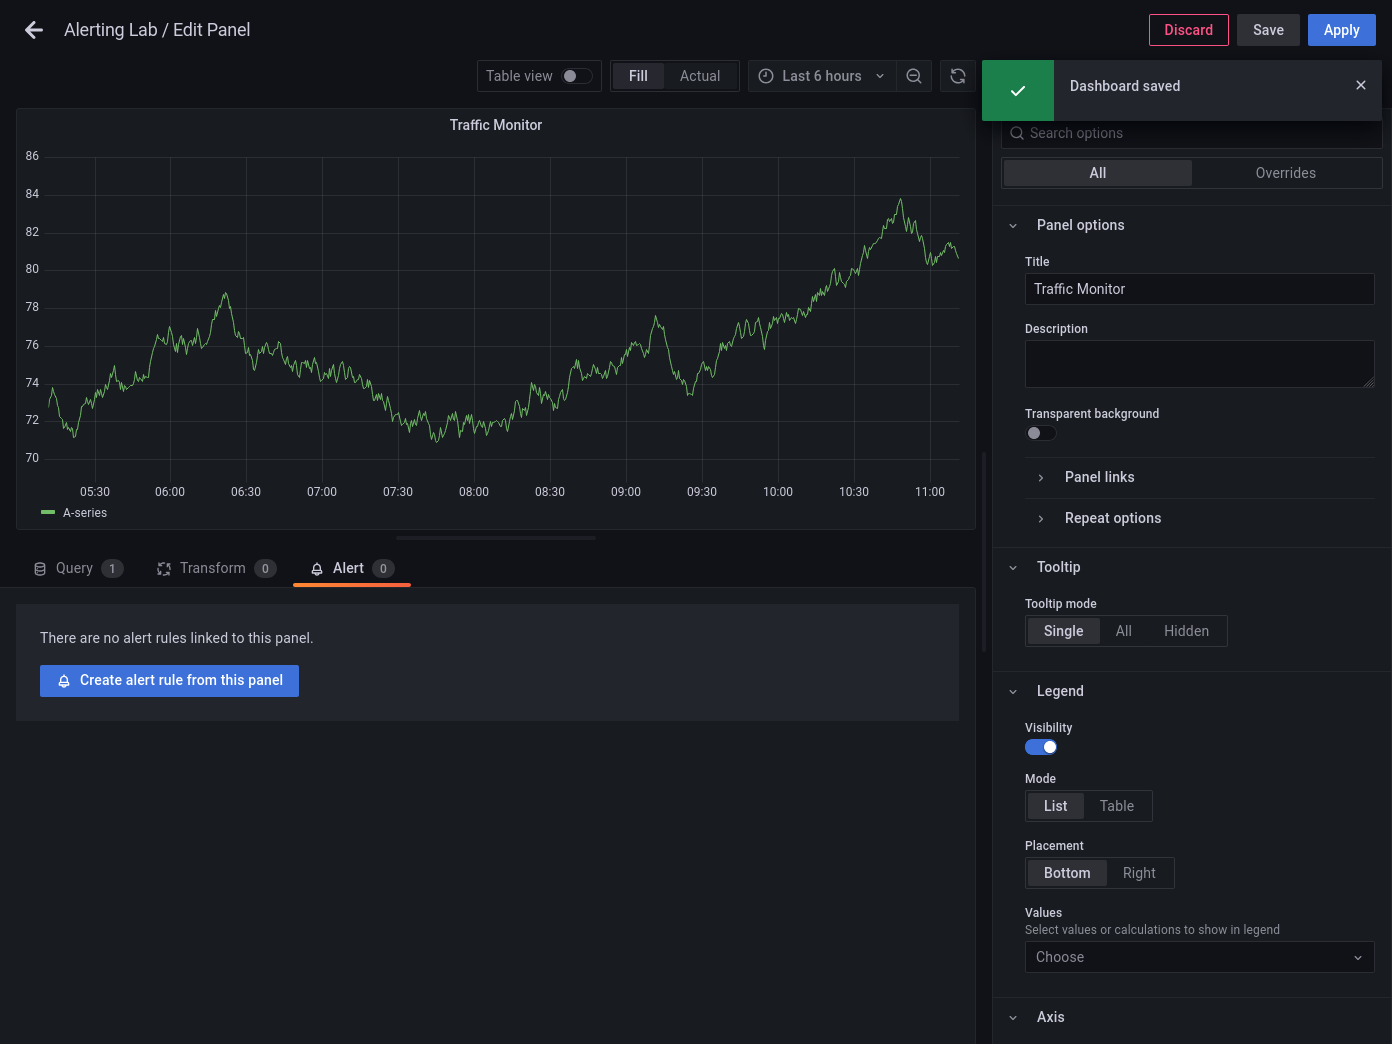
On the saved dashboard, open the menu in the Traffic Monitor panel header and select Edit. Open the Alert tab and click Create alert rule from this panel. Starting from the panel brings its query into the alert editor and links the rule to the panel.
Set the threshold
Under Set a query and alert condition, keep Grafana managed alert selected. Check that query A uses the TestData DB data source with the Random Walk scenario.
Expression B is already set to Classic condition with WHEN last() OF A IS ABOVE. Change the threshold to 50. Under Set alert condition, keep B - expression selected. The expression compares the last point returned by query A with the threshold.
Set the evaluation interval and save
Under Alert evaluation behavior, set Evaluate every to 1m and for to 0s. Grafana checks the condition every minute without an additional pending period.
Under Add details for your alert, set Rule name to High Traffic Alert.
In Folder, type LabFolder. If the folder does not exist yet, select + Add new and press Enter to confirm the name. Enter LabGroup in the Group field.
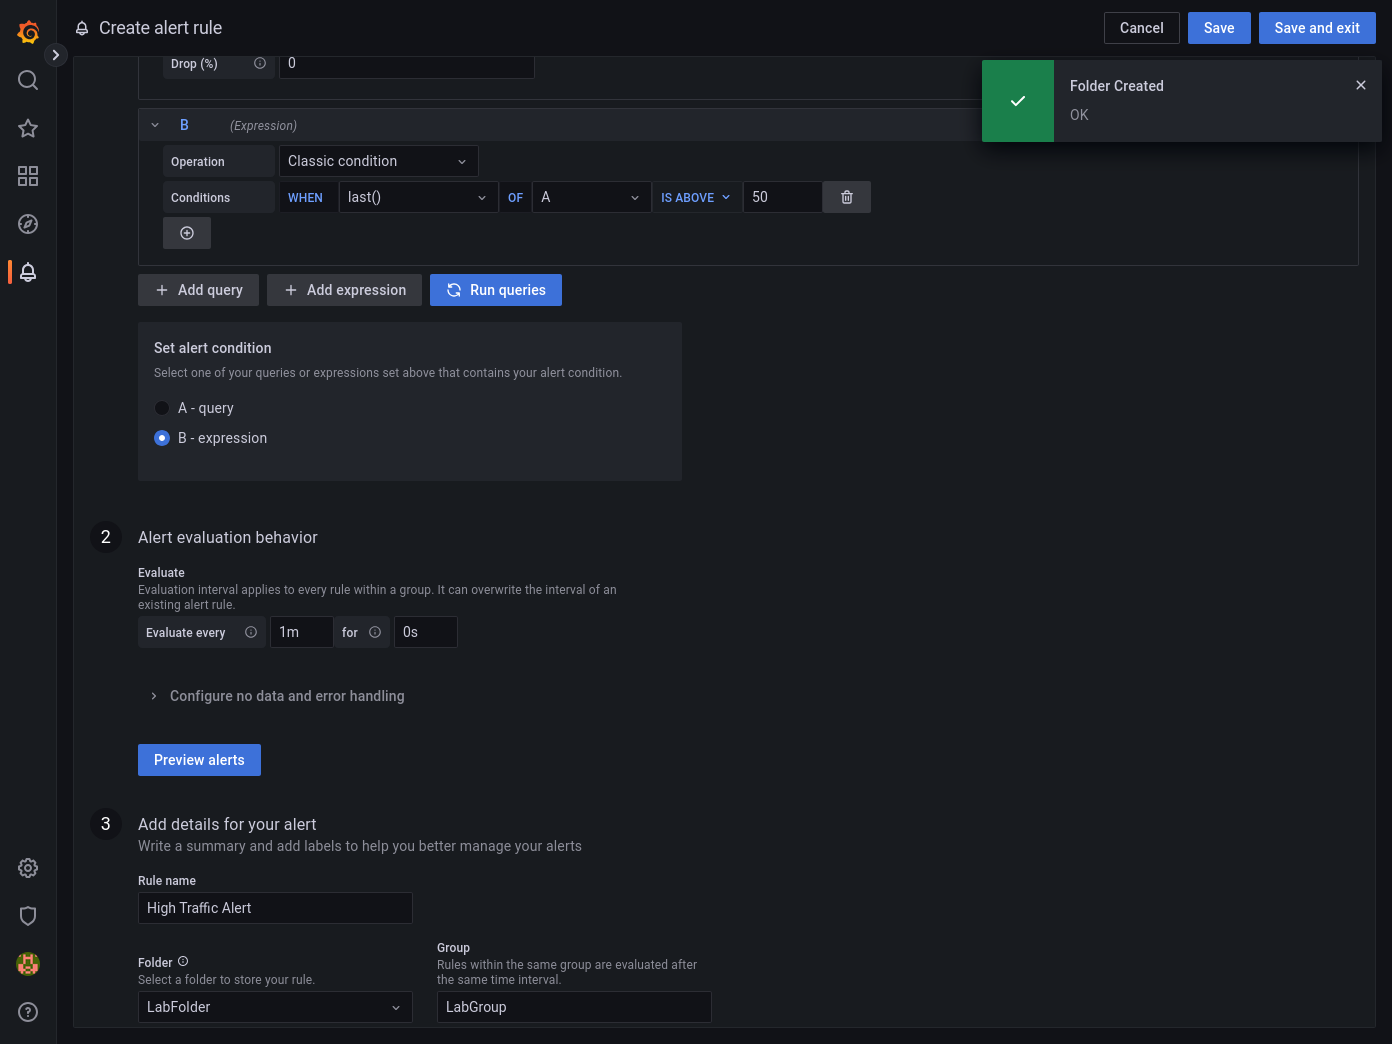
Click Save and exit.
Verify the Alert
In this step, you will inspect the rule and its evaluation state.
Check the alert state
In the left sidebar, open Alerting → Alert rules. Under Grafana, expand LabFolder and find High Traffic Alert. Check the rule's State column. Allow up to one minute for the first scheduled evaluation.
The state can change as Random Walk returns new values. Normal means the condition was false at evaluation time. Firing means the condition was met. Both are expected during this lab.
Inspect the saved rule in the terminal
You can also inspect the saved rule from the VM terminal. The following command uses Grafana 9.2's rules API and formats the response as JSON.
curl -fsS -u admin:admin http://localhost:8080/api/ruler/grafana/api/v1/rules |
  python3 -m json.tool
Look for the LabFolder entry, the LabGroup rule group, and the High Traffic Alert title. The rule's condition identifies the expression Grafana evaluates.
Summary
You plotted simulated traffic in a Time series panel and linked it to a Grafana-managed rule. The rule evaluates the last value from the TestData DB query every minute and fires when that value exceeds 50. You inspected the rule in Grafana and used the rules API to confirm its saved configuration.