
Introduction
In the previous lab, you created a simple line graph. But different data shapes are better represented by different visualization types.
Choosing the right visualization is part of operational clarity. The same metric can be technically correct in several formats, but only some formats make the intended meaning obvious to a human reader.
In this lab, you will explore these concepts by building a dashboard with different visualization types directly in Grafana. Choosing the right visualization is part of making dashboards useful rather than decorative.
Create a Gauge Panel
In this step, you will use a Gauge to display Go heap memory for monitored processes. Each series has its own gauge, so you can compare its value with a range at a glance.
Open Grafana
Switch to the Desktop tab, open Firefox inside the VM, and go to http://localhost:8080. This lab uses Grafana 9.2.10. Sign in as admin with password admin, and choose Skip if asked to change the password.
Build and save the gauge
Open Dashboards → New dashboard and click Add a new panel. In the panel editor, select Prometheus under Data source. Under Query, switch to Code, enter the following metric, and click Run queries:
go_memstats_heap_inuse_bytes
The metric reports the number of bytes allocated to active Go heap spans. In the right sidebar, click the visualization picker labeled Time series, then select Gauge. Under Panel options, set Title to Heap Memory.
Click Apply, then the Save dashboard icon. Enter Visualizations Lab in Dashboard name and click Save.
Create a Stat Panel
In this step, you will use a Stat panel to show the current goroutine count for each process that exports this metric.
On Visualizations Lab, click the Add panel icon and then Add a new panel. Select Prometheus as the data source. Under Query, switch to Code, enter this query, and click Run queries:
go_goroutines
Goroutines are units of work scheduled by the Go runtime. In the visualization picker, choose Stat. Under Panel options, set Title to Goroutines Count.
Click Apply, then Save dashboard, and confirm Save.
Configure Thresholds
In this step, you will use a threshold to make a high value stand out in the Stat panel.
Open the Goroutines Count panel menu and select Edit. In the right sidebar, find Thresholds. Keep Absolute mode and the green Base. Change the existing red threshold to 20.
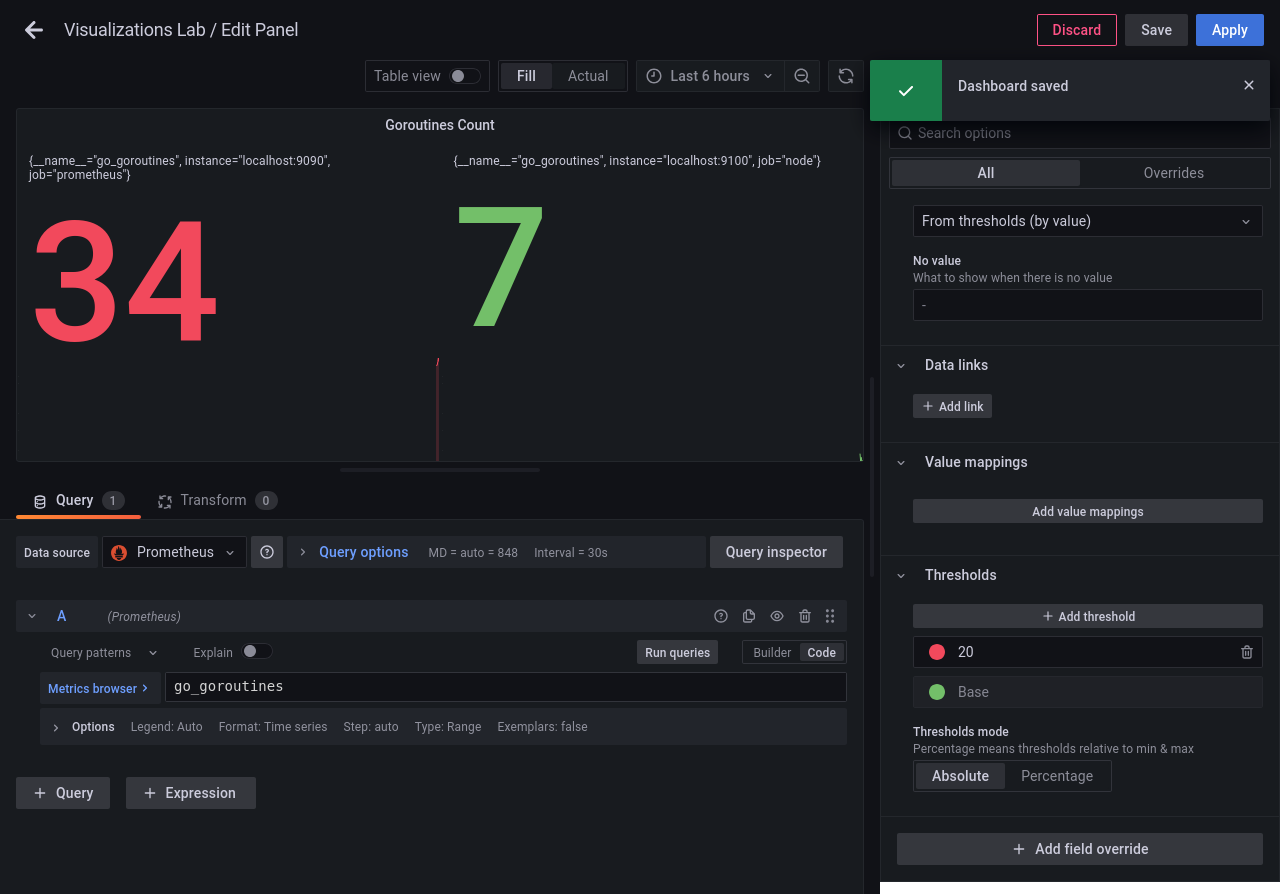
The Stat shows red when the value reaches or exceeds 20. It stays green below 20. Click Apply, then Save dashboard, and confirm Save.
Arrange Layout
In this step, you will arrange the two panels on one row so they are easy to compare.
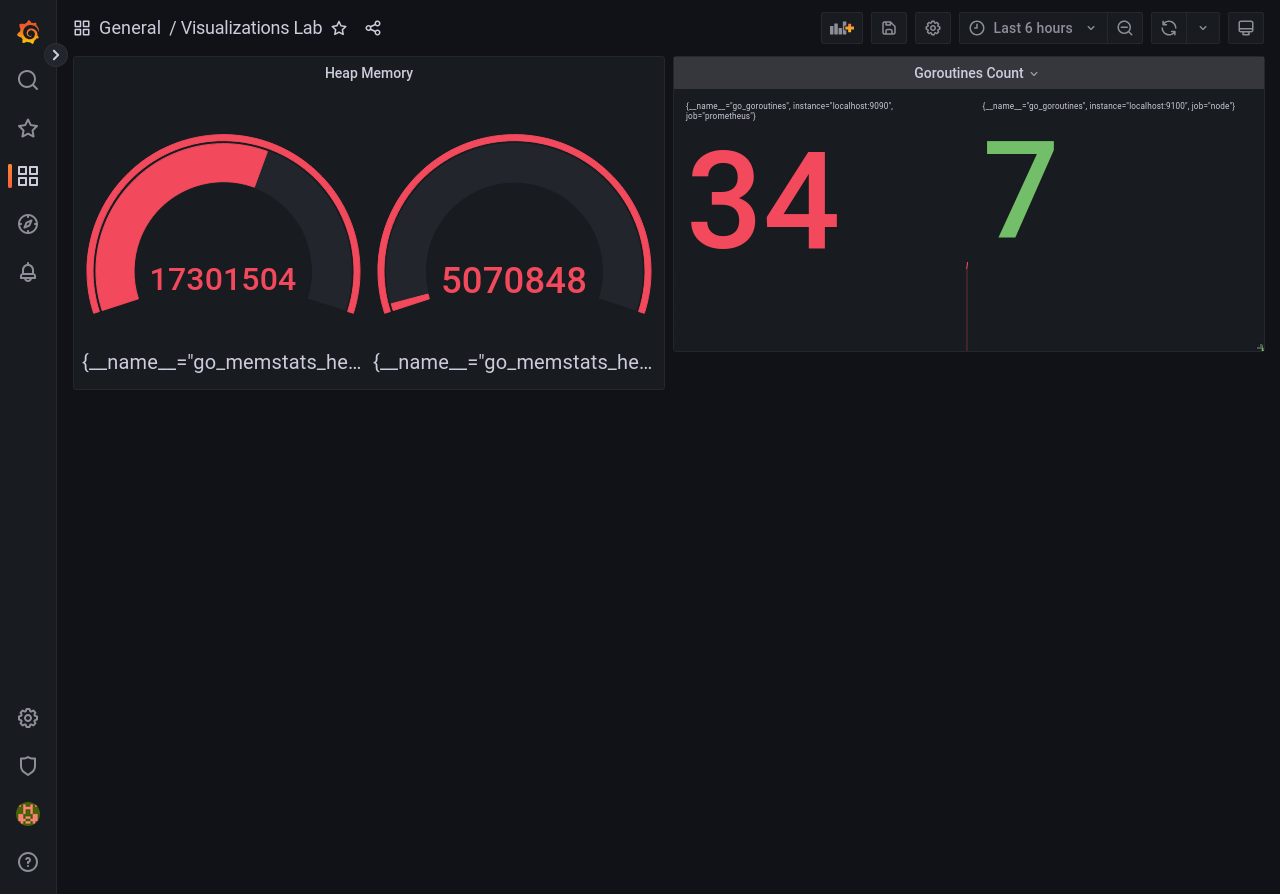
Drag Heap Memory to the left and Goroutines Count to the right. Align their top edges on the same row. If a panel is too wide to fit, drag its bottom-right corner to resize it.
Click Save dashboard and confirm Save. Your dashboard should show the two panels side by side.
Summary
In this lab, you expanded your Grafana toolkit beyond simple line graphs. You learned how to use Gauges for bounded data, Stats for current values, Thresholds to communicate urgency, and Layout to organize your workspace.
When you use Grafana, you will simply select "Gauge" or "Stat" from a dropdown menu, but now you understand exactly when to use each one and the logic behind them!