Introduction
If you have many similar systems, you usually do not want to build a separate dashboard for each one.
Variables solve a scalability problem in dashboard design. Without them, a monitoring team quickly ends up maintaining many nearly identical dashboards that drift apart over time.
In Grafana, this flexibility comes from variables. Variables let one dashboard adapt dynamically by changing the values used in its queries.
In this lab, you will Create a Variable to build the dropdown menu, Connect the Variable to update your graphs to listen to the dropdown, and Test the Remote by switching between different server instances ("Channels").
Access Variables Settings
In this step, you will open the dashboard settings where Grafana defines variables. A variable lets viewers change the data displayed by a dashboard.
Switch to the Desktop tab, open Firefox inside the VM, and go to http://localhost:8080. The lab runs Grafana 9.2.10. Sign in as admin with password admin and choose Skip when prompted to change the password.
Open Dashboards → New dashboard. Click the gear icon for Dashboard settings and select Variables on the left. The new dashboard starts with no variables.
Create a Variable
In this step, you will create a dropdown that lists the targets Prometheus monitors.
Configure the query
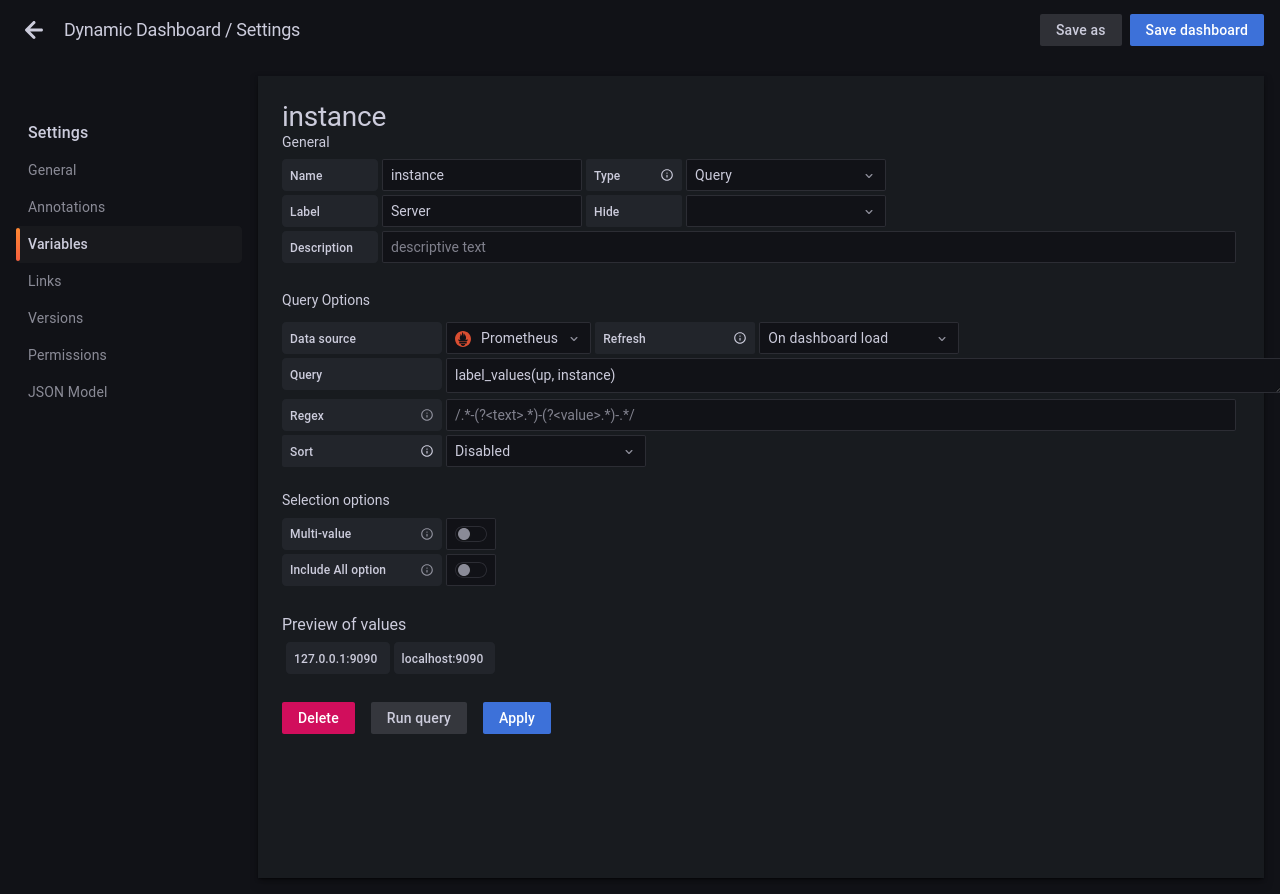
Click Add variable. Keep Type set to Query, set Name to instance, and set Label to Server. The name is used in queries, while the label appears beside the dropdown.
Under Query Options, keep Prometheus as the Data source and enter the following in Query:
label_values(up, instance)
This asks Grafana to list the values of the instance label on the Prometheus metric up. Click Run query. Under Preview of values, confirm that both localhost:9090 and 127.0.0.1:9090 appear.
Save the variable and dashboard
Click Apply to add the variable, then Save dashboard. Enter Dynamic Dashboard in Dashboard name and click Save. The dashboard shows a dropdown labeled Server.
Use the Variable
In this step, you will make a panel query depend on the Server dropdown.
In Dynamic Dashboard, click the Add panel icon, then Add a new panel. Keep Time series and select Prometheus under Data source. In the Query tab, switch to Code and enter:
up{instance="$instance"}
Grafana substitutes the selected value for $instance. Click Run queries. A value of 1 means Prometheus can scrape the selected target.
On the right, set Title under Panel options to Instance Status. Click Apply, then Save dashboard, and confirm Save.
Test Interactivity
In this step, you will switch the panel between two Prometheus targets and save the selected value.
Open Server and select 127.0.0.1:9090. Then select localhost:9090. Watch the panel update. Both addresses point to the same Prometheus server in this VM, so both can report 1 while the target in the legend changes.
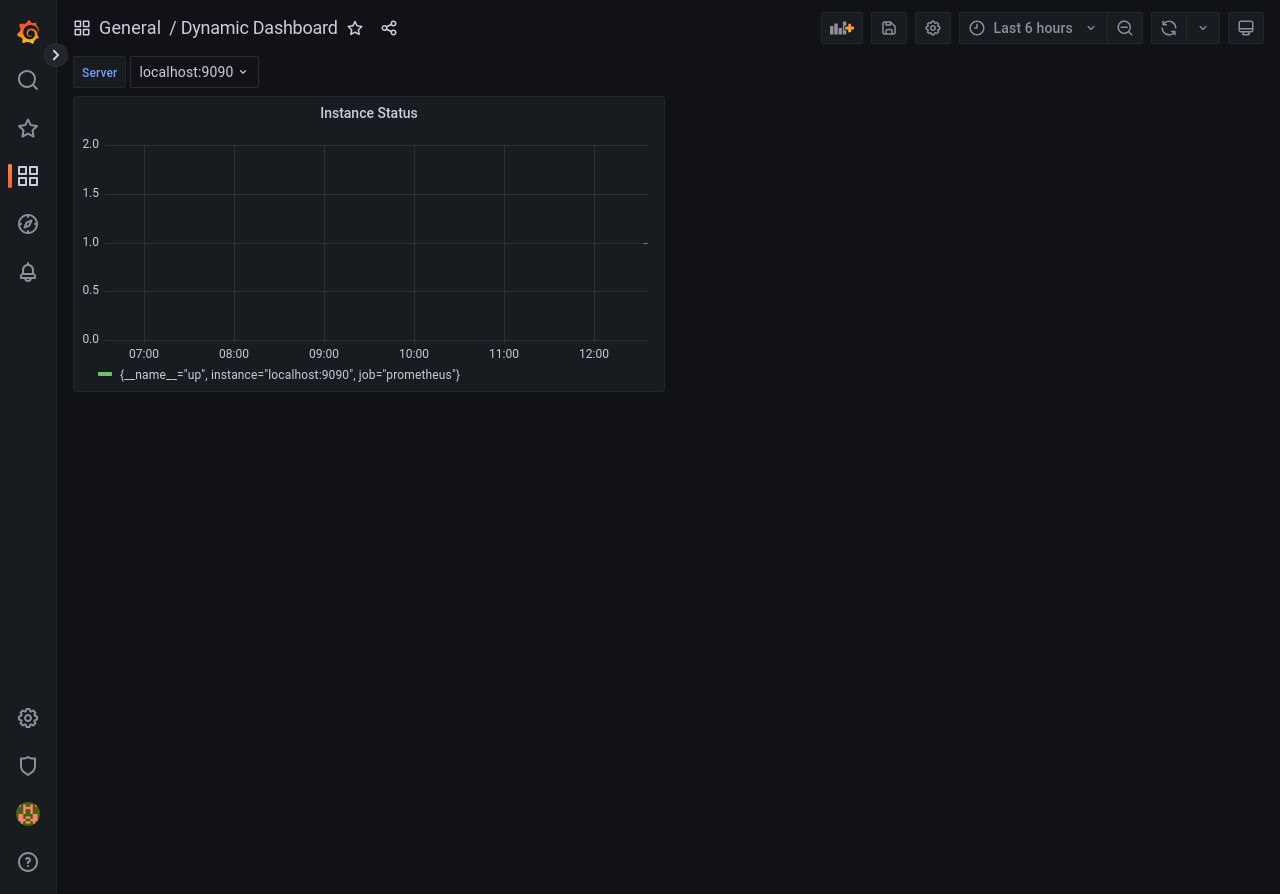
With localhost:9090 selected, click Save dashboard, enable Save current variable values as dashboard default, and confirm Save. Reopen the dashboard to confirm the selected value persisted.
Summary
In this lab, you built a Dynamic Dashboard. You learned how to create Variables (dropdown menus), use Templating to insert those variables into queries, and add Interactivity to switch contexts instantly.
This is a superpower. Instead of making 50 dashboards for 50 servers, you make one dashboard and give your team a Remote Control!