
Introduction
Grafana organizes visualizations into dashboards and panels. A dashboard is the full workspace, while a panel is an individual visualization inside it.
That distinction is important because operators rarely diagnose systems from one graph alone. A good dashboard combines several focused panels so related signals can be interpreted together.
This structure matters because effective observability is not just about drawing one graph. It is about arranging related views so humans can understand system behavior quickly.
In this lab, you will Create a Dashboard (your personal workspace), Add a Panel (a new graph), Tune the Channel (Use PromQL to pick what data to show), and Save your work.
Access Grafana
In this step, you will open Grafana 9.2.10 and check the Prometheus data source prepared by the lab.
Sign in to Grafana
Switch to the Desktop tab, open Firefox inside the VM, and go to http://localhost:8080. Sign in with admin as both the username and password. Choose Skip if Grafana asks you to change the password. The step checks use the default credentials inside this VM.
Check the data source
In the left sidebar, open Configuration → Data sources. Confirm that Prometheus is listed. Grafana uses this connection to retrieve the metrics for your dashboard.
Create a Dashboard
In this step, you will add a Time series panel and save the dashboard so Grafana can store your work as you go.
Add the panel
Open Dashboards → New dashboard, then click Add a new panel. In the editor, keep Time series as the visualization and select Prometheus under Data source if it is not already selected.
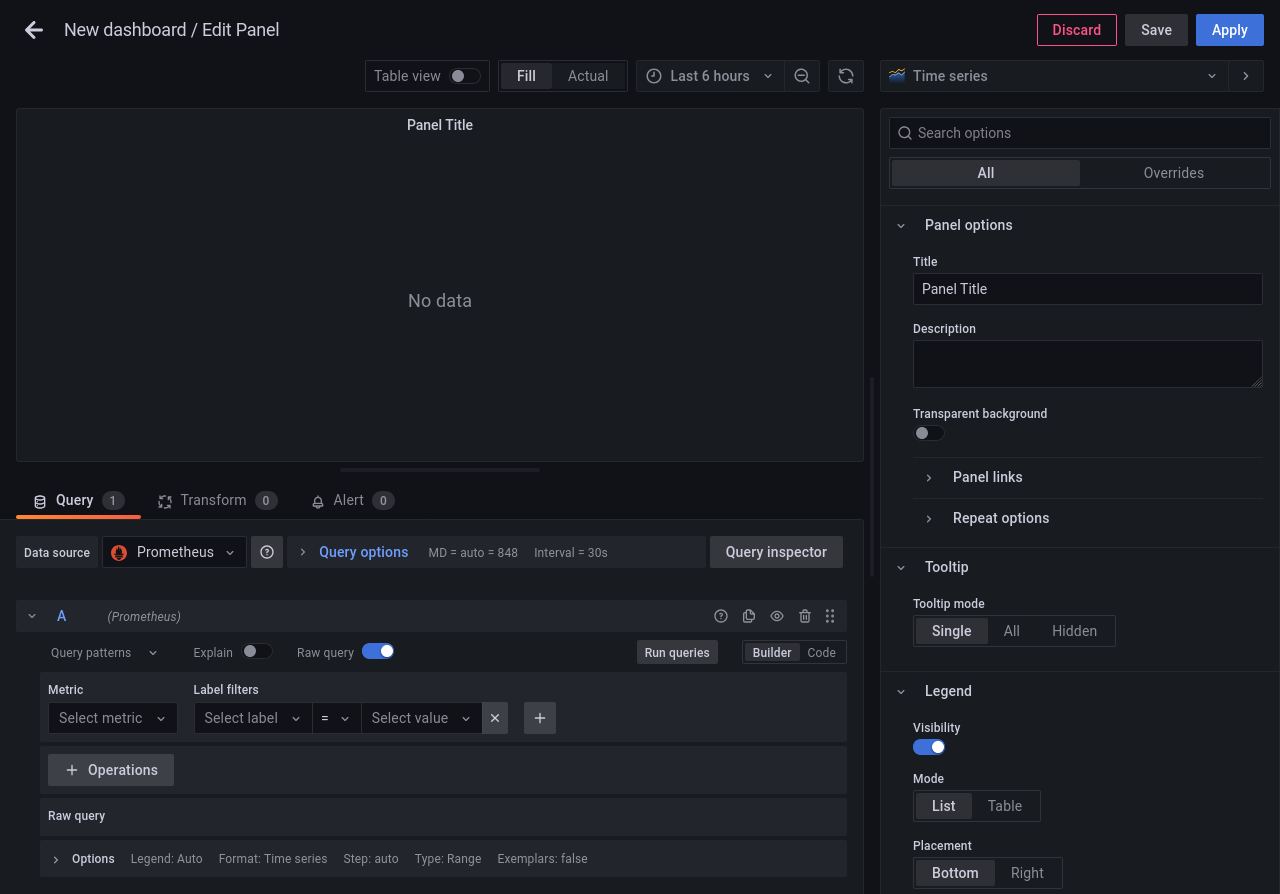
The chart preview is at the top, the query editor is below it, and panel options are on the right. You will configure the query in the next step.
Save the dashboard
Click Apply to return to the dashboard. Click the Save dashboard icon, enter First Dashboard in Dashboard name, and click Save.
Configure the Graph
In this step, you will query a Prometheus metric and see how it changes over time.
Query Prometheus
On First Dashboard, open the menu in the panel header and select Edit. In the Query tab below the chart, select Code and enter:
process_cpu_seconds_total
This metric is the cumulative CPU time used by a process, measured in seconds. It increases as the process uses CPU.
Look at the result
Click Run queries and look for a line in the chart. Hover over it to see individual samples. If no data appears yet, wait for Prometheus to collect a sample and run the query again.
Click Apply, then click the dashboard's Save dashboard icon and confirm Save.
Save the Dashboard
In this step, you will give the panel a clear title and confirm that the dashboard can be reopened.
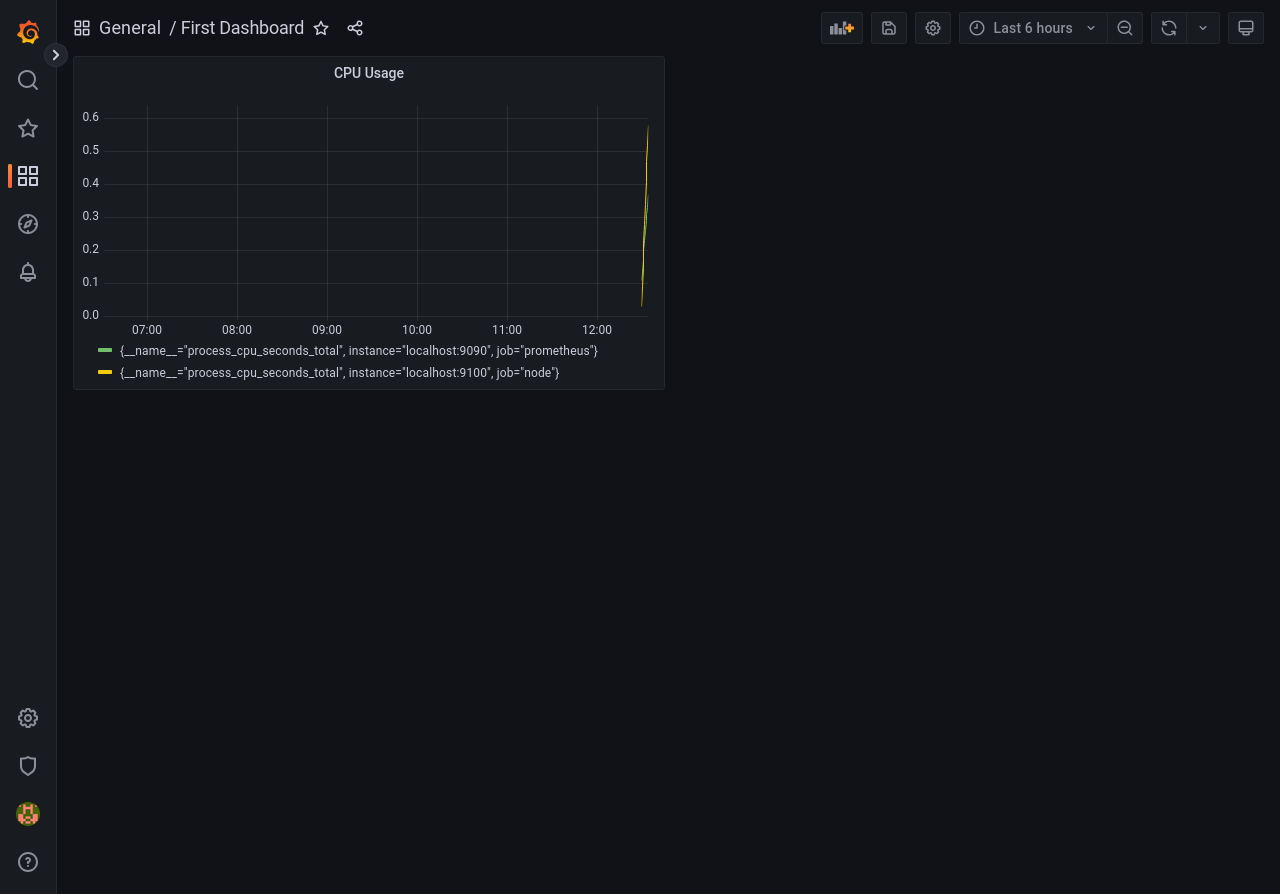
Open the panel menu and select Edit. Under Panel options on the right, set Title to CPU Usage. Click Apply, then Save dashboard, and confirm Save.
Open Dashboards → Browse, expand General, and reopen First Dashboard. Confirm that the CPU Usage panel displays the data you queried.
Summary
In this lab, you became a Dashboard Artist. You learned how to create a new Workspace (Dashboard), add Panels (visualizations), use Queries to select data, and Save your work.
But a line graph isn't the only way to see data. In the next lab, we will look at Gauges, Stats, and other cool visualization types!