
Introduction
An incorrect publication can break an otherwise running website. Configure a CloudWatch alarm, publish a supplied broken profile, use request logs to observe the failure, then restore the working profile and confirm successful traffic returns the alarm to OK.
Complete the request-log lab first. This fresh environment supplies its own website, private S3 image, role, logs and request-metric integration. You create the alarm and perform the failure and recovery yourself.
Certification Relevance
| Certification | Exam task | Practice |
|---|---|---|
| AWS Certified Cloud Practitioner (CLF-C02) | Task 3.8 | Use CloudWatch request metrics, alarms and logs to observe application failure and recovery. |
Lab Overview
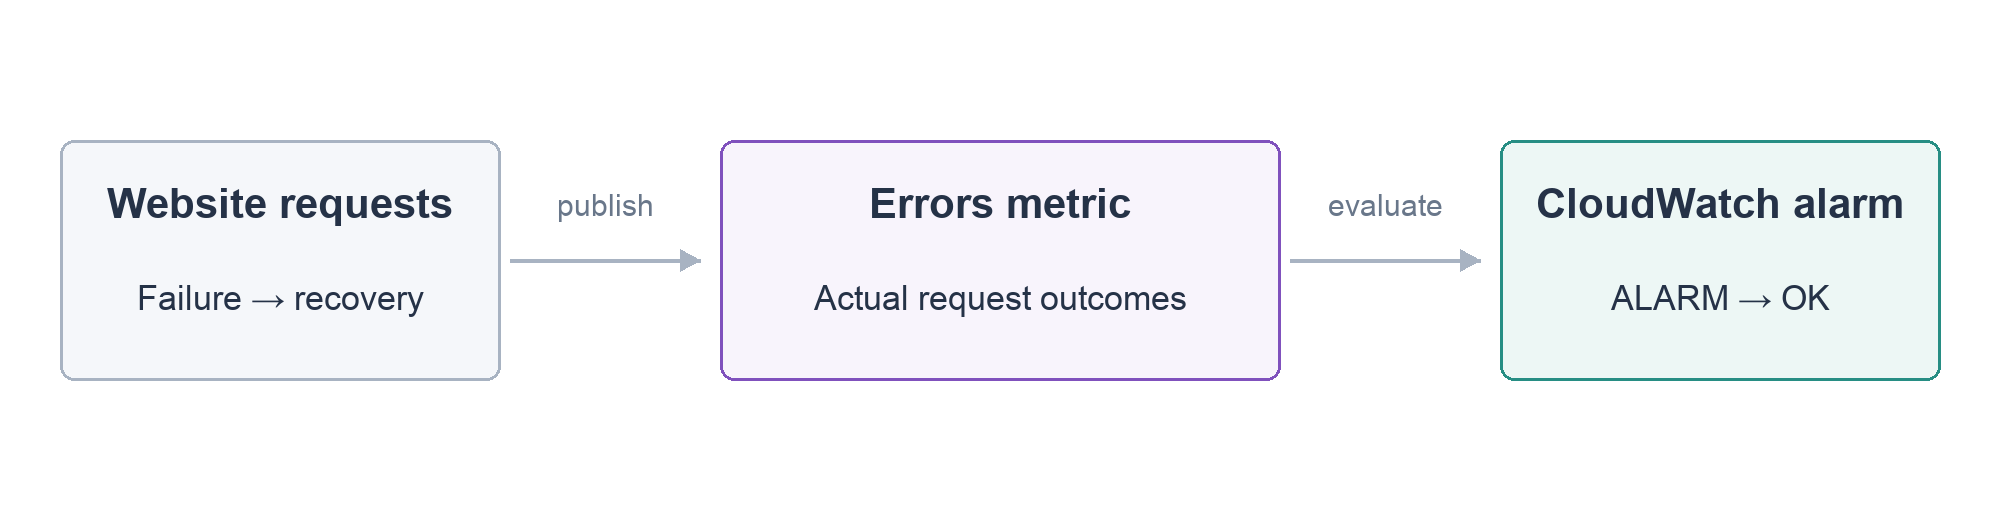
Configure a Website Error Alarm
In this step, you will configure an alarm on actual website request errors.
Open your portfolio from AWS View and confirm it works. Page and asset requests create log events. For each /website page request, the supplied integration publishes an Errors metric: 1 for a failed request and 0 for a successful request.
A metric is a numerical measurement over time. A namespace groups metrics, and a dimension identifies the application they describe. This metric is Errors in LabEx/Portfolio, with Application=portfolio. An alarm evaluates recent metric values against a threshold; it does not repair the website by itself.
Load your fresh server's identifiers:
cd /home/labex/project
source website.env
echo "$INSTANCE_ID"
Inspect the supplied alarm configuration:
cat website-alarm.json
Focus on these settings:
| Setting | Meaning |
|---|---|
MetricName: Errors |
Count the website's failed requests |
Statistic: Sum |
Add error values within a period |
Period: 10 |
Evaluate ten-second periods |
EvaluationPeriods: 1 |
One evaluated period is sufficient |
Threshold: 0 / GreaterThanThreshold |
A period containing an error breaches the threshold |
TreatMissingData: missing |
Missing request data is not assumed to be healthy traffic |
Ten-second alarms require high-resolution custom metrics; this lab's prepared integration publishes at one-second resolution. No notification destination is configured. The exercise teaches observation rather than email delivery.
Create the alarm using the supplied configuration:
aws cloudwatch put-metric-alarm --cli-input-json file://website-alarm.json
Read its state:
aws cloudwatch describe-alarms --alarm-names portfolio-errors
The state can initially be INSUFFICIENT_DATA, meaning the alarm does not yet have enough evaluated data. AWS View displays the same alarm. The next steps provide actual failed and successful requests; do not manually set the alarm state.
Observe a Failed Publication
In this step, you will publish a deliberately invalid profile and connect the resulting request errors to the alarm.
The supplied profile-broken.json is a practice fault. Inspect it:
cat profile-broken.json
It is invalid JSON, so the website cannot parse the profile. This reproduces a bad content publication without changing the server's network or permissions. Use the SCP workflow you learned earlier:
scp -F ssh_config profile-broken.json ubuntu@"$PUBLIC_IP":/home/ubuntu/portfolio/profile.json
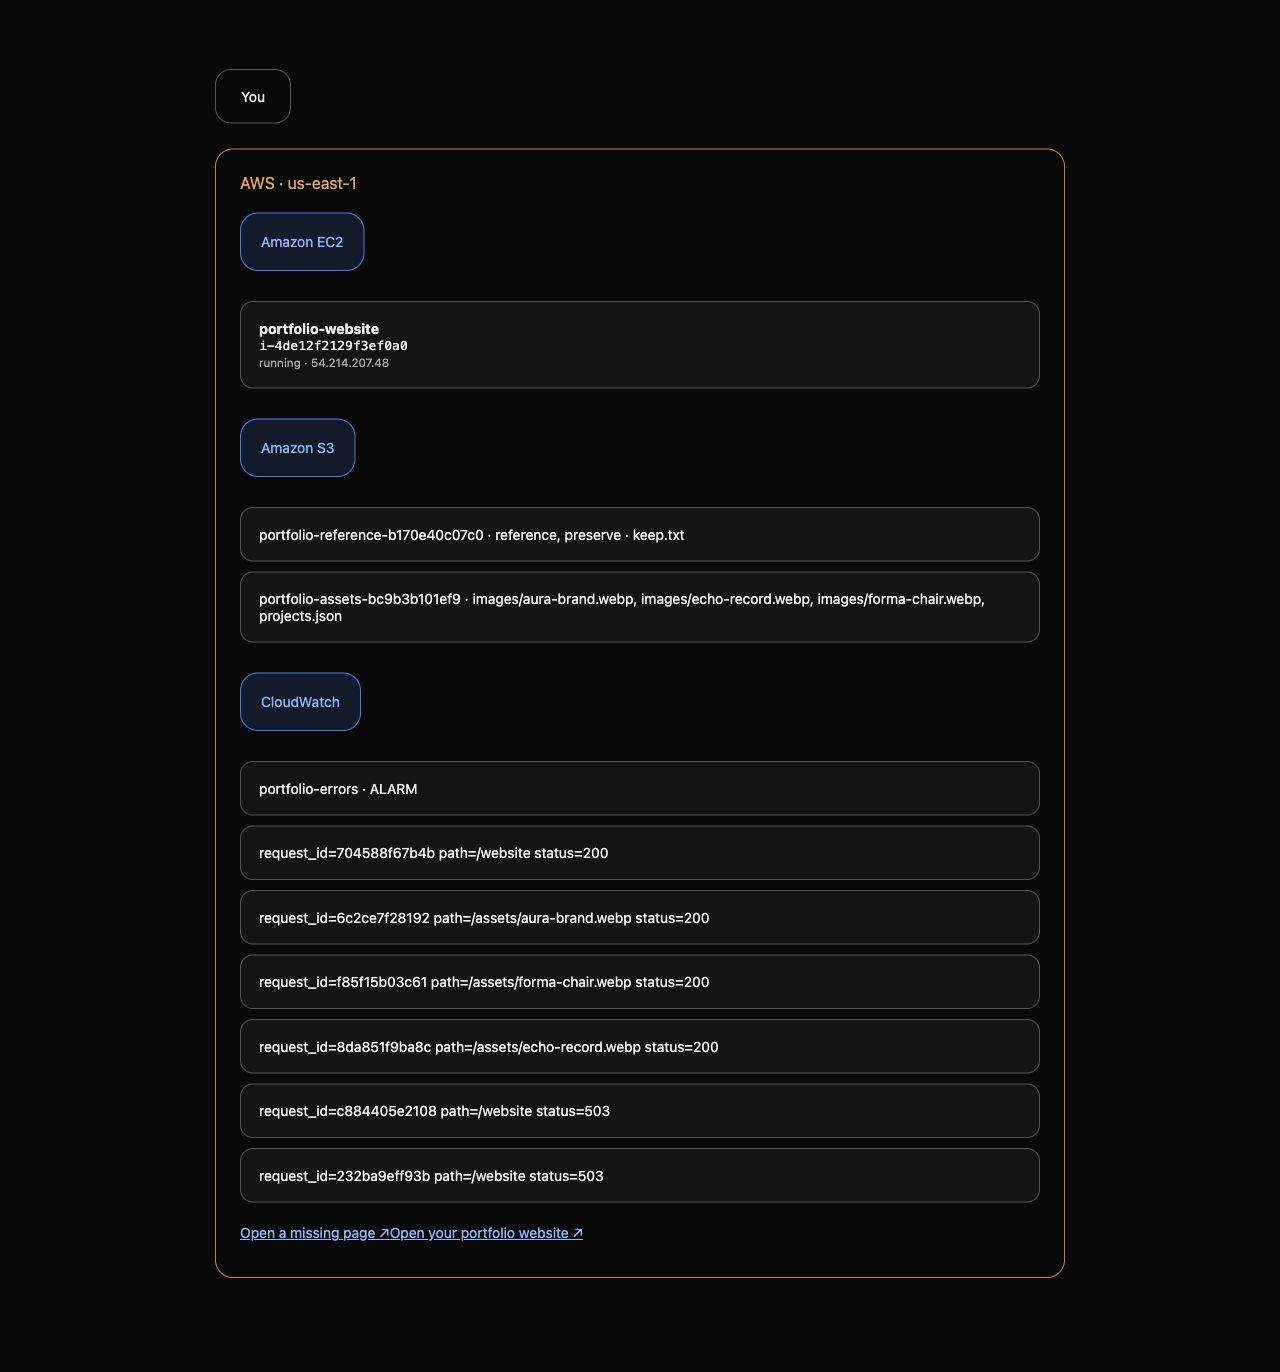
Refresh the portfolio tab. It should report Website unavailable, the application's generic failure response. The instance still shows running in AWS View. A running server can host an application that fails requests.
Find the failure in CloudWatch Logs:
aws logs filter-log-events --log-group-name "$LOG_GROUP" --filter-pattern '"status=503"'
Look for path=/website status=503. HTTP 503 indicates the application could not successfully handle that request. Here you know the trigger: the invalid profile was just published. The log establishes the actual response; inspect the recent change to identify its cause.
Allow a ten-second evaluation period to complete, refreshing the failing page again if needed to keep failed request data current. Check the alarm:
aws cloudwatch describe-alarms --alarm-names portfolio-errors
Confirm StateValue: ALARM in the response and AWS View. If it still says INSUFFICIENT_DATA, make another actual page request and allow an evaluation period before checking again. A stale log alone is not a current metric sample.
Restore the Website and Confirm Recovery
In this step, you will restore a valid profile and confirm both the page and alarm recover.
Inspect the supplied known working profile:
cat profile-working.json
It contains the three correctly formatted fields used by the application. Publish that file to the same remote path:
scp -F ssh_config profile-working.json ubuntu@"$PUBLIC_IP":/home/ubuntu/portfolio/profile.json
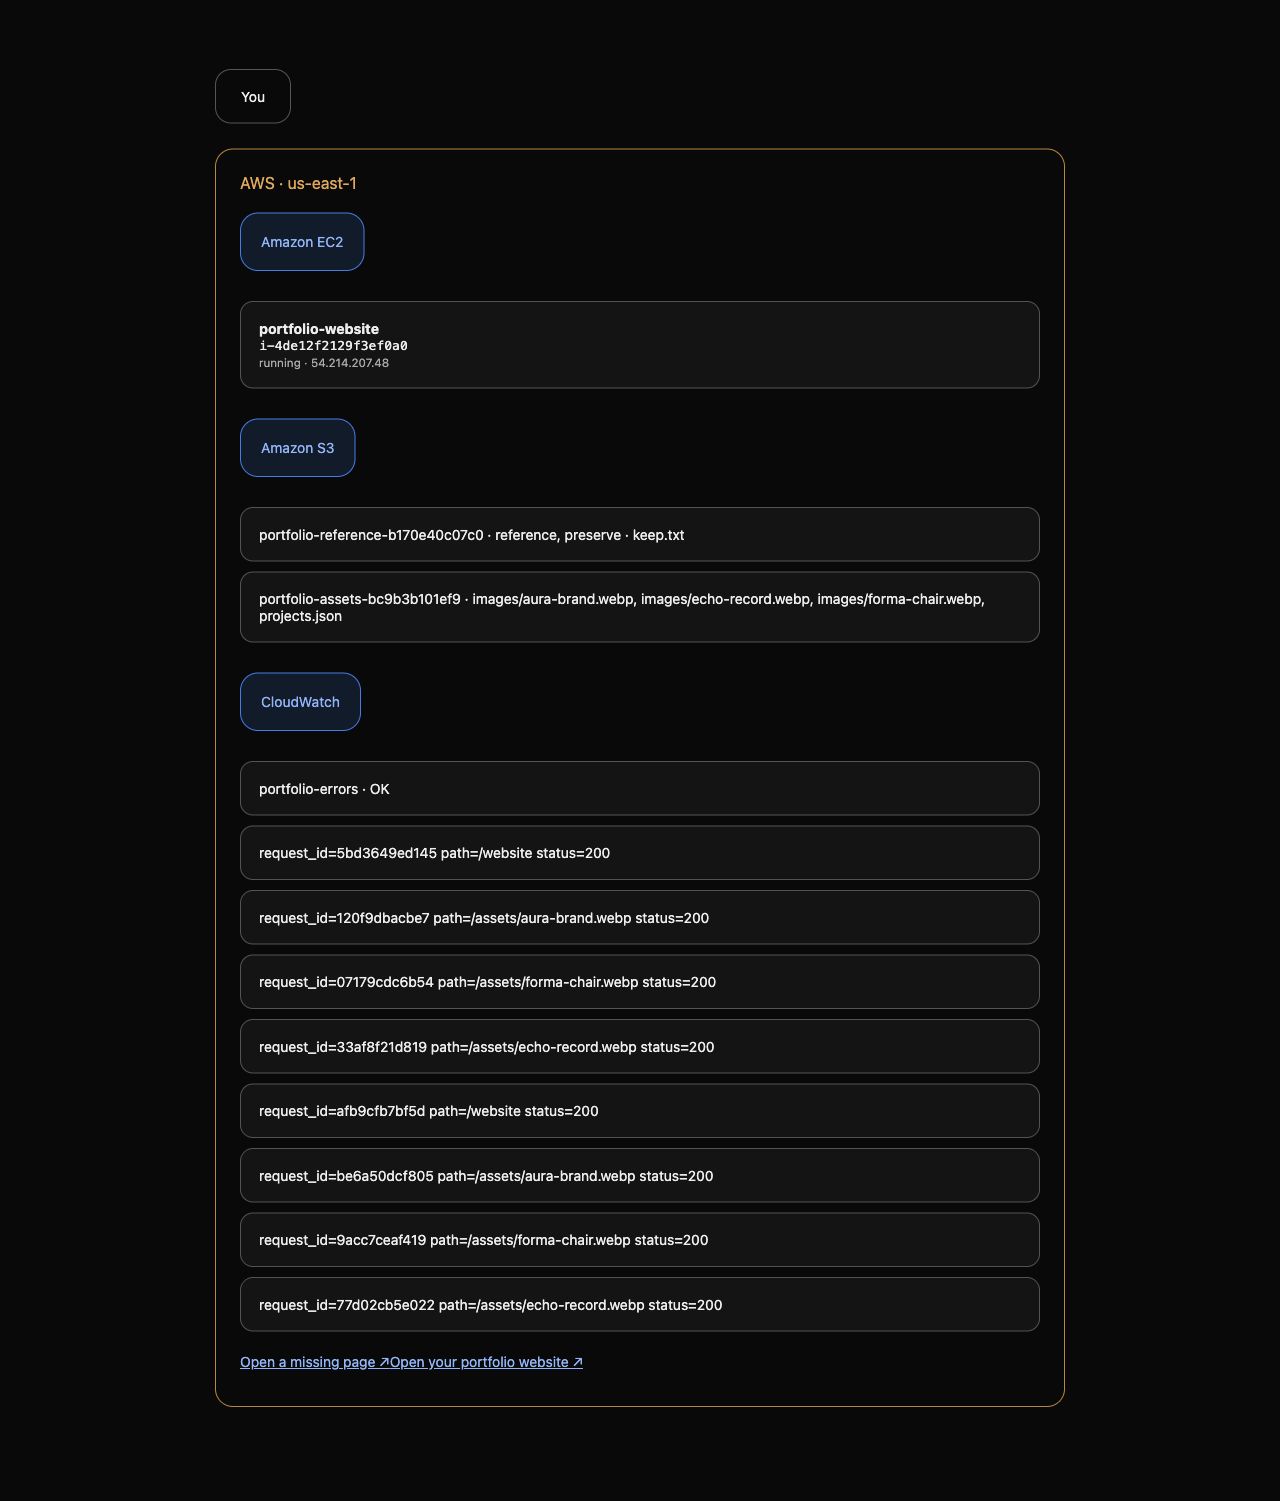
Refresh your portfolio tab. Alex Morgan, Make it memorable. and all three S3 project images should return. This confirms the repair at the application boundary.
Look for the successful page response:
aws logs filter-log-events --log-group-name "$LOG_GROUP" --filter-pattern '"status=200"'
Confirm a recent path=/website status=200 event after the failure. The old 503 event remains in history; recovery does not erase it.
Give the successful traffic a new evaluation period. Refresh the healthy page again as necessary, then read the alarm:
aws cloudwatch describe-alarms --alarm-names portfolio-errors
Confirm StateValue: OK in the response and AWS View. OK here means the evaluated request data does not breach the threshold. With no requests, missing-data treatment can return the alarm to INSUFFICIENT_DATA; that state is different from proven healthy traffic. Keep successful requests current while confirming the recovery.
You have completed an operational loop: a publication caused failures, logs showed their actual responses, an alarm detected the measured errors, and a valid publication restored successful requests.
Remove the Disposable Workload and Alarm
In this step, you will remove the exercise's server, alarm and log group after confirming recovery.
Terminate the instance:
aws ec2 terminate-instances --instance-ids "$INSTANCE_ID"
aws ec2 wait instance-terminated --instance-ids "$INSTANCE_ID"
Delete only the alarm you created:
aws cloudwatch delete-alarms --alarm-names portfolio-errors
Delete the exercise's request log group:
aws logs delete-log-group --log-group-name "$LOG_GROUP"
Confirm terminated in AWS View and no remaining exercise alarm. Preserve the supplied S3 storage, role, reference log events and network. Metrics are not deleted by deleting an alarm; this exercise stops generating new website request samples when the workload is gone.
You have finished the guided portfolio course. AWS Resource Management for Beginners will develop the precise resource-identification, querying and organization skills behind these project actions.
Summary
You configured a CloudWatch alarm on request-derived errors, published a known bad profile and observed actual HTTP failures, log events and an ALARM state. Restoring a valid profile produced healthy requests and returned the alarm to OK. You distinguished missing data from healthy traffic and removed the disposable workload, alarm and exercise logs.
Official references: CloudWatch alarms and high-resolution custom metrics.