
Introduction
FRAME Studio is checking the Linux workstation used for event-photo exports. Before watching a longer session, you need trustworthy readings: CPU non-idle time, memory that is not readily available, and usage of the filesystem containing the export directory. A high reading is a signal to interpret, not proof that the photo work has failed.
You will implement three short Bash functions and use a prepared adapter that runs real Linux commands. Know basic terminal paths, Bash variables, functions, conditions and loops, as taught in Shell for Beginners. The prepared shell programs handle command plumbing; you will read that plumbing and implement the percentage logic. This is an independent Linux instance with two small, real ext4 teaching filesystems. Mounting and preparing them is not learner work. The duration is an author estimate including reading and ordinary mistakes.
Measure CPU Non-Idle Time
In this step, you will see a working resource snapshot and implement its CPU conversion.
Start in Terminal. Every command in this lab runs here. Enter the prepared workspace; pwd prints your current location, and ls lists its files. If a relative filename is missing later, use this complete cd command again rather than resetting the instance.
Entering commands
Click inside Terminal before typing. Copy only the contents of a command block; do not type a prompt, the surrounding backticks or an expected-output example. Press Enter after each command and wait for the prompt to return before continuing. A command can finish successfully without printing anything. Keep this same Terminal open throughout the lab.
cd /home/labex/project/resource-watch
pwd
The path should end in /resource-watch. Run the prepared demonstration with Bash:
bash demo.sh
The first line names four fields. The next line contains a UTC timestamp and three actual percentages. Values vary. demo.sh is a supplied working example; it does not complete your functions or save your answer.
UTC timestamp | CPU non-idle % | memory pressure % | target filesystem used %
2026-...Z ... ... ...
CPU percentages describe time across the instance's virtual CPUs. vmstat reports system activity. In vmstat 1 2, 1 is the interval in seconds and 2 is the number of reports. The first CPU report is an average since boot; the second covers the new interval. Run it before extracting anything:
LC_ALL=C vmstat 1 2
LC_ALL=C applies an English, stable numeric format to this command. Find id in the CPU columns: it is idle time. This course defines non-idle = 100 - idle. Non-idle includes I/O wait and stolen time; it is not just time executing your program, nor a failure diagnosis.
The adapter uses a pipeline: | sends one command's output into the next. tail -n 1 selects the last line. awk '{print $15}' prints its fifteenth whitespace-separated field, the id column in this prepared procps version. Single quotes keep $15 for awk rather than letting the shell expand it. Confirm that the extracted value is an integer:
LC_ALL=C vmstat 1 2 | tail -n 1 | awk '{print $15}'
Now edit the supplied functions. nano is a terminal editor. Open the named file, replace only the : inside cpu_nonidle, and keep the other two functions unchanged. A colon is a placeholder that does nothing.
nano metrics.sh
Move the cursor with the arrow keys. In the first function, delete only the colon line and insert the two indented lines shown below. Keep the function name, opening and closing braces, and the other functions. The complete-function example shows the result to aim for; do not paste a second copy underneath the original. Indentation helps readability; the braces and spelling must remain correct.
Make the first function read:
cpu_nonidle() {
    local idle=$1
    echo $((100 - idle))
}
$1 is the function's first argument. local keeps the variable inside this function. $((...)) performs integer arithmetic, and echo prints its result. Press Ctrl+O, Enter, then Ctrl+X to save and exit nano. If a later edit causes a syntax error, reopen this file and correct the affected function; the prepared sampler stays intact.
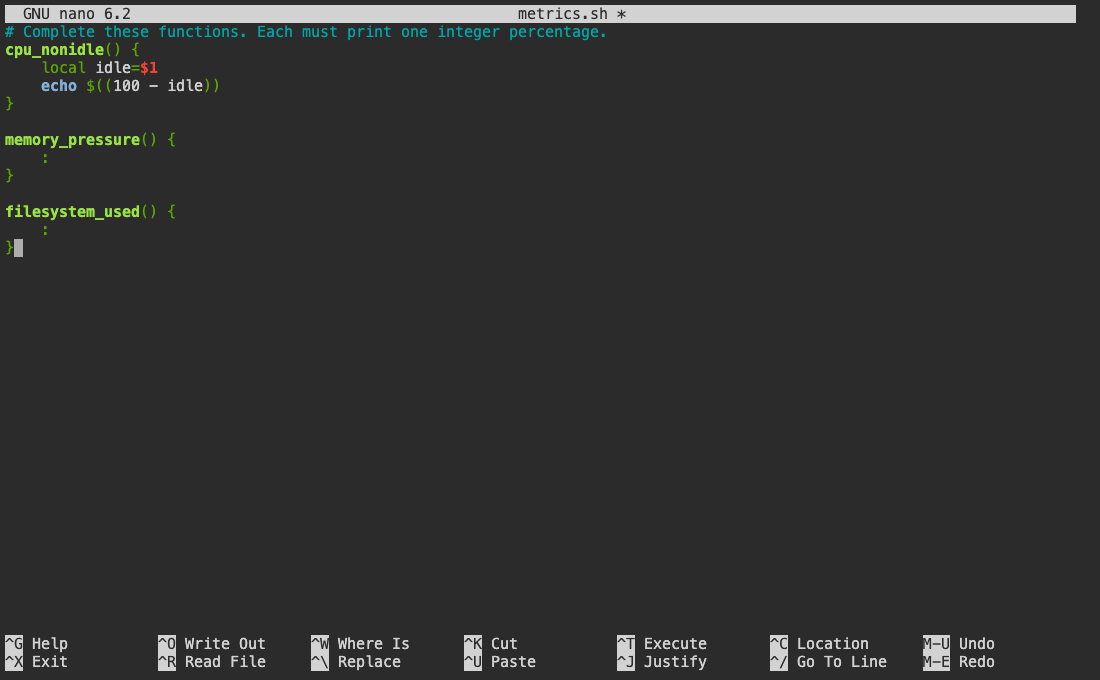
In this example, only the first function is complete; the two remaining colon placeholders are intentional. At the bottom of nano, a caret means the Ctrl key. For example, ^O means hold Ctrl and press O, not type those two characters.
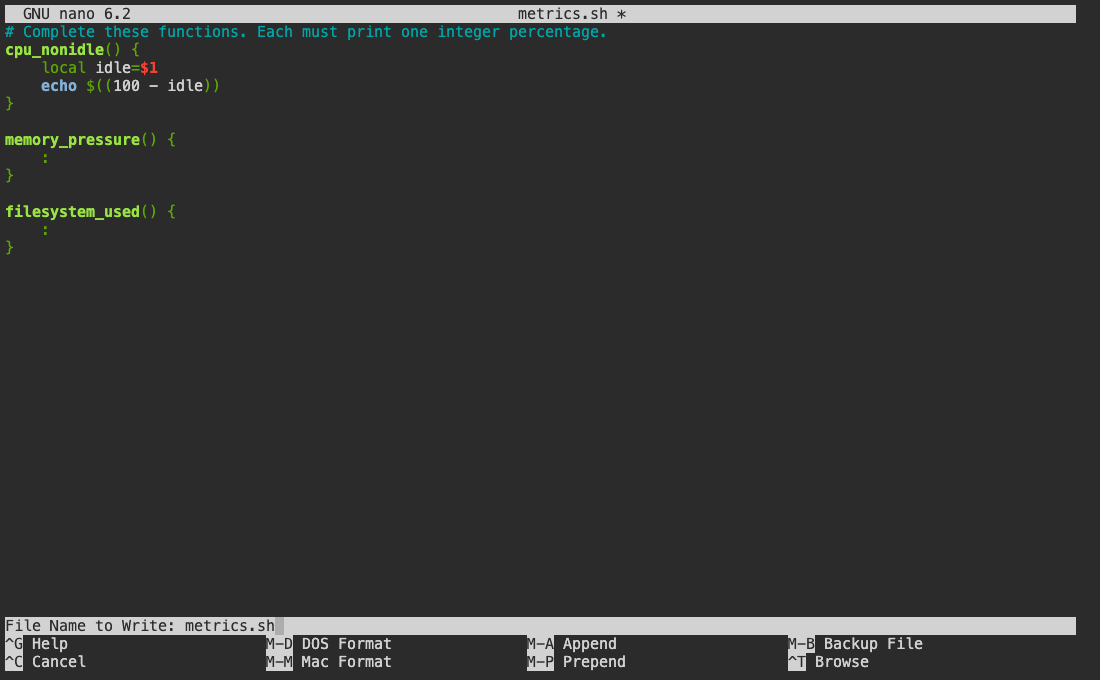
After Ctrl+O, nano asks for the filename at the bottom. Leave the existing name unchanged and press Enter to confirm it; then Ctrl+X returns to the shell prompt. If you opened the wrong file, Ctrl+X and answer N when asked whether to save, then open the correct file. Do not type shell commands while the editor is still open.
source loads function definitions into the current shell. Since Terminal starts Zsh while this exercise uses Bash, use bash -c to execute the quoted test in Bash. The outer single quotes preserve the inner function command.
bash -c 'source ./metrics.sh; cpu_nonidle 97'
3
This supplied idle input tests your arithmetic; it is not a claim that the current CPU is exactly 3% non-idle. Check both endpoints too:
bash -c 'source ./metrics.sh; cpu_nonidle 0; cpu_nonidle 100'
100
0
Your function is reusable for any integer idle value from 0 to 100. The actual sampler will provide the newly measured value.
Distinguish Available Memory from Free Memory
In this step, you will calculate memory pressure using memory Linux estimates is available to new applications.
Stay in Terminal, in /home/labex/project/resource-watch. free -k displays memory in KiB, units of 1024 bytes. Run the command before parsing it:
LC_ALL=C free -k
Read the Mem: row. free means completely unused memory; available estimates memory usable by new applications without swapping, including some reclaimable cache. Do not treat all cache as permanently unavailable. This course uses floor((total - available) * 100 / total) as its memory-pressure percentage. It does not predict whether a particular future allocation will succeed.
The adapter selects the total and available columns from the same row. In awk, /^Mem:/ matches a line starting with Mem:; $2 and $7 select its second and seventh fields.
LC_ALL=C free -k | awk '/^Mem:/ {print $2, $7}'
The output contains total followed by available memory. Both use the same units, so their ratio is meaningful. For example, total 1000 and available 750 means 25%, not 75%.
Open your file and replace only the memory_pressure placeholder:
nano metrics.sh
memory_pressure() {
    local total=$1 available=$2
    echo $(((total - available) * 100 / total))
}
Bash integer division truncates the fraction; all inputs here are nonnegative and total is positive, so truncation gives the floor. Multiply before dividing to avoid losing the fraction too early. Save with Ctrl+O, Enter, Ctrl+X.
bash -c 'source ./metrics.sh; memory_pressure 1000 750; memory_pressure 3 2'
25
33
A value of 33 is intentional for one unavailable unit out of three. The function contract uses whole-number units of the same size, with available between zero and total. Invalid-input parsing is handled outside this small exercise.
For the first test, 1000 - 750 = 250 unavailable units, so 250 × 100 ÷ 1000 = 25. For the second, one of three units is unavailable: 33.333… becomes 33 because the function returns a whole number. The second function argument is the available amount, not an already calculated percentage. Keep the CPU function you completed in the previous step.
Sample the Correct Filesystem
In this step, you will finish the filesystem function and save one complete observation.
Stay in Terminal, in /home/labex/project/resource-watch. The exports and reference directories belong to different prepared ext4 filesystems. Their original material and notes must remain intact. You are observing space; do not delete material, modify mounts or try to fill any filesystem.
df reports the filesystem containing the supplied path. Its -P option gives a predictable one-line-per-filesystem layout. Compare both paths:
df -P exports reference
Read Capacity, not the number of files in a directory. exports should have lower use than reference. Running df / would describe another filesystem and cannot substitute for the selected target.
In nano, replace only filesystem_used:
nano metrics.sh
filesystem_used() {
    df -P "$1" | awk 'NR == 2 {gsub(/%/, "", $5); print $5}'
}
Double quotes keep the supplied path as one argument. NR == 2 selects the data row after the header. gsub removes % from the fifth field before printing it. Save with Ctrl+O, Enter, Ctrl+X. A different implementation is allowed if it returns the same integer for the requested filesystem.
bash -c 'source ./metrics.sh; filesystem_used exports; filesystem_used reference'
The two numbers should agree with each corresponding df row. Finish with the prepared driver:
bash snapshot.sh
It now prints a UTC timestamp, CPU non-idle, memory pressure and target-filesystem usage, separated by tabs. CPU and memory may change between commands. Read the adapter if you want to connect the individual observations:
cat capture.sh
The adapter runs vmstat and free, calls your functions, and reads the target using df. $(...) captures command output; read -r assigns the whitespace-separated fields, and <<< supplies the captured string to that read. These supplied plumbing details are ready for you; your three functions determine the percentages.
Save one actual snapshot. > redirects output and replaces this one snapshot file; it does not change the original operator history.
The .tsv extension means tab-separated values: one observation per line, with a tab between fields. The saved snapshot has four fields in this order: UTC timestamp, CPU non-idle percentage, memory-pressure percentage and target-filesystem-used percentage. UTC is a shared time standard; the final Z on a timestamp marks UTC. These percentages describe different resources, so do not add them together or expect them to total 100.
bash snapshot.sh > snapshot.tsv
cat snapshot.tsv
If a file or function name is mistyped, use ls, reopen metrics.sh, correct it and rerun this snapshot command. Do not replace a failed observation with made-up numbers. You now have a working Bash sampler whose calculations and target are explicit.
Summary
You measured CPU non-idle time over a new interval, calculated memory pressure from available memory, and selected the filesystem containing the actual target. Your three Bash functions now produce one real resource snapshot. The next independent lab supplies these functions and adds warning rules and preserved history.