
Introduction
Some work can happen after a caller receives a response; other work must start without a caller at all. A support health monitor needs both: acknowledge a requested check promptly, and run periodic checks automatically. You will use background work for the first case and a scheduled handler for the second, then observe when the check actually finishes. Receiving an acknowledgment does not mean the work has completed.
This independent VM starts in /home/labex/project/task-monitor with Node.js 22.22.0, project-local Wrangler 4.131.1, Miniflare 4.20260730.0 for isolated assessment and a synthetic internal health-service fixture. You reuse the earlier service-binding and device-authorization skills, not a preceding VM or resource. Use your own learning account; no domain, storage product or paid upgrade is required. Requests and scheduled invocations count toward normal account usage.
Keep one terminal open. The brief one-minute schedule is for disposable testing. Finish by stopping log streams, deleting both Workers while authorized, confirming absence and logging out. Background work here is bounded and non-durable; do not use it as a promise of reliable queued delivery.
Return Before Background Work Finishes
In this step, a public endpoint will acknowledge a small health-check request while a supplied internal service does the asynchronous work. This is an independent VM; the service is a new fixture, not a resource from an earlier lab.
cd /home/labex/project/task-monitor
node --version
npx wrangler --version
cat health/index.js
Normally, returning a response ends the request's foreground work. ctx.waitUntil tells the Workers runtime about a promise that should be allowed to finish afterward, within its lifetime limits. This can suit a small follow-up check, but it does not save the job for guaranteed retry.
The fixture waits 250 milliseconds and returns synthetic JSON. It makes no external requests and stores no data. Generate a unique base name, then configure the public Worker and its internal HEALTH service. These are the standard service bindings you used earlier.
WORKER_NAME="labex-tasks-$(openssl rand -hex 6)"
cat > wrangler.jsonc <<CONFIG
{
  "name": "$WORKER_NAME",
  "main": "src/index.js",
  "compatibility_date": "2026-07-30",
  "workers_dev": true,
  "preview_urls": false,
  "services": [
    {
      "binding": "HEALTH",
      "service": "$WORKER_NAME-health"
    }
  ],
  "triggers": {
    "crons": []
  }
}
CONFIG
cat > health/wrangler.jsonc <<CONFIG
{
  "name": "$WORKER_NAME-health",
  "main": "index.js",
  "compatibility_date": "2026-07-30",
  "workers_dev": false,
  "preview_urls": false
}
CONFIG
cat > src/index.js <<'JS'
async function checkHealth(env, details) {
  const url = new URL('https://health.internal/health');
  url.searchParams.set('probe', details.probe);
  const response = await env.HEALTH.fetch(url, {signal: AbortSignal.timeout(3000)});
  if (!response.ok) throw new Error('health_service_unavailable');
  const data = await response.json();
  if (data.status !== 'ok' || data.service !== 'labex-health-fixture' || data.probe !== details.probe) {
    throw new Error('unexpected_health_response');
  }
  console.log(JSON.stringify({event: 'health_check', ...details, status: data.status, service: data.service}));
}

export default {
  async fetch(request, env, ctx) {
    const url = new URL(request.url);
    if (url.pathname === '/health' && request.method === 'GET') {
      return Response.json({status: 'ok'}, {headers: {'Cache-Control': 'no-store'}});
    }
    if (url.pathname !== '/checks') return Response.json({error: 'not_found'}, {status: 404});
    if (request.method !== 'POST') {
      return Response.json({error: 'method_not_allowed'}, {status: 405, headers: {Allow: 'POST'}});
    }
    const probe = url.searchParams.get('probe') || '';
    if (!/^[a-z0-9-]{1,48}$/.test(probe)) {
      return Response.json({error: 'invalid_probe'}, {status: 400});
    }
    ctx.waitUntil(checkHealth(env, {source: 'request', probe}).catch(() => {
      console.error(JSON.stringify({event: 'health_check_failed', source: 'request', probe}));
    }));
    return Response.json({accepted: true, probe}, {status: 202, headers: {'Cache-Control': 'no-store'}});
  }
};
JS
checkHealth validates the actual dependency response and emits a small structured result. Its three-second abort signal bounds the request. The public handler passes its promise to ctx.waitUntil and returns HTTP 202 immediately. A 202 acknowledges this short-lived attempt; it does not promise durable delivery. The catch records a failure without printing raw exceptions, requests or credentials. Only use the synthetic probe values shown here.
npx wrangler dev -c wrangler.jsonc -c health/wrangler.jsonc --ip 0.0.0.0 --port 8080 > dev.log 2>&1 &
Wait for the prompt, then inspect the log. Continue when the public development server is ready on port 8080. If it is still starting, wait briefly and read the log again.
cat dev.log
curl -i http://127.0.0.1:8080/health
curl -i -X POST "http://127.0.0.1:8080/checks?probe=manual-one"
cat dev.log
The foreground health route returns 200 and status ok. The POST returns 202 with accepted true and probe manual-one. After the dependency completes, the log includes event health_check, source request, the same probe and status ok. If you read the log too quickly, read it again after a moment. The response arriving before a later log is an observation, not a precise performance benchmark.
Use verification while the server is running. An isolated runtime holds its own health fixture behind a controlled gate, requires the foreground response to arrive before opening that gate, then requires completed background work. It also checks the public health route and rejected method/probe cases. Nothing in that test calls Cloudflare.
Invoke the Scheduled Handler Locally
In this step, you will arrange for the health check to start on a schedule. A Cron trigger is a timer rule; when it fires, Cloudflare calls the Worker's scheduled handler instead of waiting for an HTTP request. First you will invoke that handler locally to inspect its behavior. Inspect and stop the actual development job before editing, substituting its current job number if needed.
jobs
kill %1
cat > src/index.js <<'JS'
async function checkHealth(env, details) {
  const url = new URL('https://health.internal/health');
  url.searchParams.set('probe', details.probe);
  const response = await env.HEALTH.fetch(url, {signal: AbortSignal.timeout(3000)});
  if (!response.ok) throw new Error('health_service_unavailable');
  const data = await response.json();
  if (data.status !== 'ok' || data.service !== 'labex-health-fixture' || data.probe !== details.probe) {
    throw new Error('unexpected_health_response');
  }
  console.log(JSON.stringify({event: 'health_check', ...details, status: data.status, service: data.service}));
}

export default {
  async fetch(request, env, ctx) {
    const url = new URL(request.url);
    if (url.pathname === '/health' && request.method === 'GET') {
      return Response.json({status: 'ok'}, {headers: {'Cache-Control': 'no-store'}});
    }
    if (url.pathname !== '/checks') return Response.json({error: 'not_found'}, {status: 404});
    if (request.method !== 'POST') {
      return Response.json({error: 'method_not_allowed'}, {status: 405, headers: {Allow: 'POST'}});
    }
    const probe = url.searchParams.get('probe') || '';
    if (!/^[a-z0-9-]{1,48}$/.test(probe)) {
      return Response.json({error: 'invalid_probe'}, {status: 400});
    }
    ctx.waitUntil(checkHealth(env, {source: 'request', probe}).catch(() => {
      console.error(JSON.stringify({event: 'health_check_failed', source: 'request', probe}));
    }));
    return Response.json({accepted: true, probe}, {status: 202, headers: {'Cache-Control': 'no-store'}});
  },
  async scheduled(controller, env) {
    await checkHealth(env, {
      source: 'scheduled',
      probe: `cron-${controller.scheduledTime}`,
      cron: controller.cron,
      scheduledTime: controller.scheduledTime
    });
  }
};
JS
cat > wrangler.jsonc <<CONFIG
{
  "name": "$WORKER_NAME",
  "main": "src/index.js",
  "compatibility_date": "2026-07-30",
  "workers_dev": true,
  "preview_urls": false,
  "services": [
    {
      "binding": "HEALTH",
      "service": "$WORKER_NAME-health"
    }
  ],
  "triggers": {
    "crons": [
      "* * * * *"
    ]
  }
}
CONFIG
The five-field expression * * * * * means every minute, in UTC. This deliberately frequent schedule is only for a short disposable experiment. scheduled awaits the health operation so the invocation result reflects completion; it does not return an HTTP response. The log records the trigger's actual cron expression and scheduled time.
npx wrangler dev -c wrangler.jsonc -c health/wrangler.jsonc --ip 0.0.0.0 --port 8080 > dev.log 2>&1 &
Wait for the prompt, then inspect the log. Continue when the public development server is ready on port 8080. If it is still starting, wait briefly and read the log again.
cat dev.log
curl -i "http://127.0.0.1:8080/cdn-cgi/local/scheduled?cron=*+*+*+*+*&time=1700000000000&format=json"
cat dev.log
The local trigger should return outcome ok, and the application log should contain source scheduled, cron * * * * * and scheduledTime 1700000000000. This old timestamp is a deliberate synthetic test input, not evidence of a current cloud execution. Use verification to exercise a different controlled scheduled time and confirm the health service was called.
For HTTP invocations, waitUntil can extend work for up to 30 seconds after the response is sent or the client disconnects; that allowance is shared by the request's background promises. It is not a durable queue or a retry guarantee. This lab's small three-second-bounded operation fits that role. Work needing reliable delivery/retries belongs in a suitable queue/workflow design outside this lab. See the context API and scheduled handler documentation for the different invocation lifetimes.
Deploy and Observe Request Background Work
In this step, deploy both new Workers in your own learning account. Stop the actual local job and authorize this fresh VM using the familiar device flow.
jobs
kill %1
npx wrangler login --device --browser=false --scopes account:read user:read workers_scripts:write workers_tail:read
Open the displayed device link in your signed-in browser, enter its code, review the requested access and select the learning account. Wait for terminal success.
npx wrangler whoami --json
Confirm the account name even if only one is listed. Replace YOUR_ACCOUNT_ID in both configurations below with its actual ID. Keep the same generated Worker names and the one-minute schedule. The public Worker also enables Workers Logs, so its invocation and application logs are available under Observability in Dashboard. This is separate from the live wrangler tail connection. This disposable lab emits only synthetic health-check data; never log credentials. See the Workers Logs documentation.
cat > wrangler.jsonc <<CONFIG
{
  "name": "$WORKER_NAME",
  "main": "src/index.js",
  "compatibility_date": "2026-07-30",
  "workers_dev": true,
  "preview_urls": false,
  "services": [
    {
      "binding": "HEALTH",
      "service": "$WORKER_NAME-health"
    }
  ],
  "triggers": {
    "crons": [
      "* * * * *"
    ]
  },
  "observability": {
    "enabled": true
  },
  "account_id": "YOUR_ACCOUNT_ID"
}
CONFIG
cat > health/wrangler.jsonc <<CONFIG
{
  "name": "$WORKER_NAME-health",
  "main": "index.js",
  "compatibility_date": "2026-07-30",
  "workers_dev": false,
  "preview_urls": false,
  "account_id": "YOUR_ACCOUNT_ID"
}
CONFIG
npx wrangler deploy -c health/wrangler.jsonc
npx wrangler deploy
The internal health service is deployed first so the public Worker's binding can resolve it. Confirm the public deployment output includes schedule: * * * * *. Copy its actual workers.dev address below.
APP_URL="https://YOUR_WORKER.YOUR_SUBDOMAIN.workers.dev"
curl -i "$APP_URL/health"
npx wrangler tail --format pretty > events.log 2> tail-errors.log &
Allow the tail connection a few seconds to initialize, then send one synthetic check.
sleep 5
curl -i -X POST "$APP_URL/checks?probe=remote-one"
cat events.log
Find the POST event and its health_check log with source request and probe remote-one. If no event is visible yet, inspect tail-errors.log, wait briefly, send the request again and reread events.log. A log file from an earlier lab is not evidence for this deployment.
In Dashboard, open this account's Compute → Workers & Pages. Confirm both exact names, the public Worker address and its HEALTH binding to the matching internal service. Use verification: it checks authenticated ownership and endpoint/binding metadata, then opens its own short live-tail session and sends a fresh probe to confirm background completion. The assessor does not trust your events.log as proof. Keep your learner tail job running for the next step.
Observe a Real Cron Execution
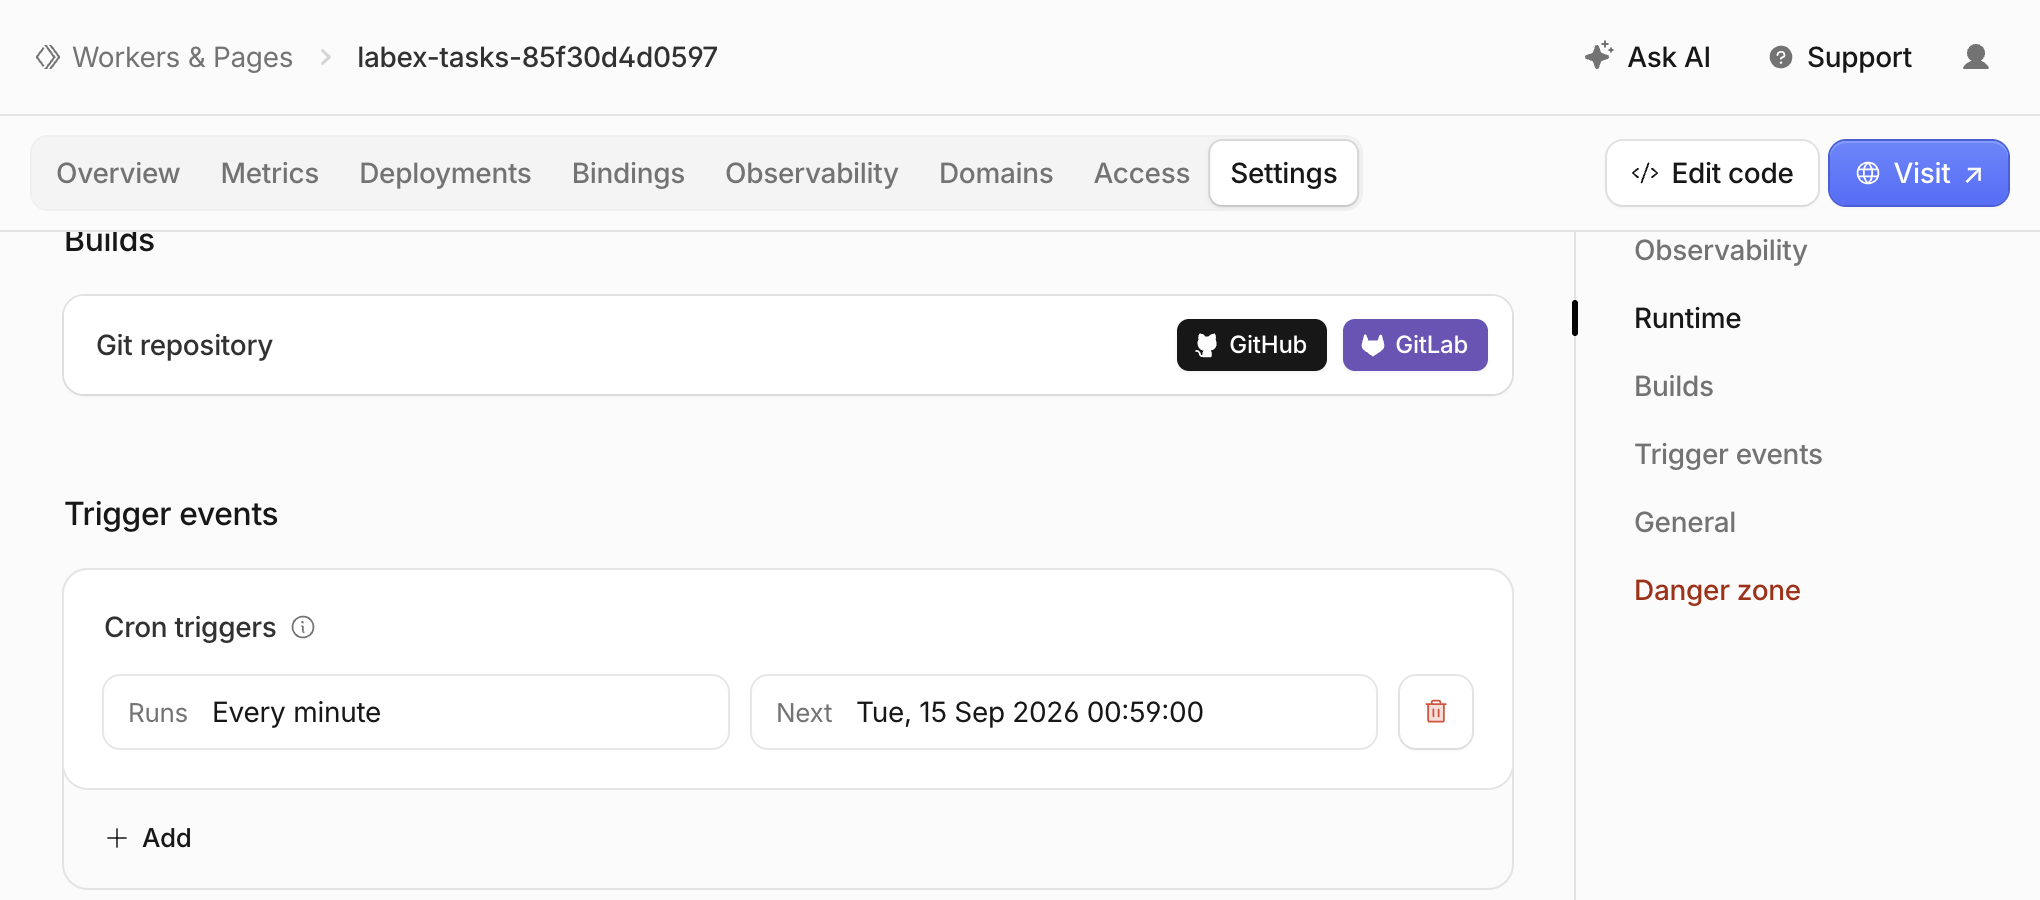
In this step, distinguish deployment configuration from execution. Open the public Worker in Dashboard and inspect Settings → Trigger events → Cron triggers. Confirm the schedule is shown as Every minute. The Next time is a prediction, not a completed execution. A configured schedule alone does not prove that its handler ran.
The example below shows the shortest supported interval: * * * * *, or once per minute. Compare the Worker name with your own configuration. The name and displayed time are examples; you do not need to add another trigger in Dashboard when Wrangler has already configured it.
Keep the existing learner tail connection running. Wait for a real scheduled event and inspect the same log file:
sleep 60
cat events.log
Find a successful scheduled invocation in the readable tail output, identified by the cron expression and its execution time. Its health_check log must have source scheduled, cron * * * * *, status ok, service labex-health-fixture, and scheduledTime. The probe is cron- followed by that scheduledTime. The independent verifier separately checks Cloudflare's structured event metadata against this application log. A POST event, a local synthetic timestamp, or an empty log does not establish this result.
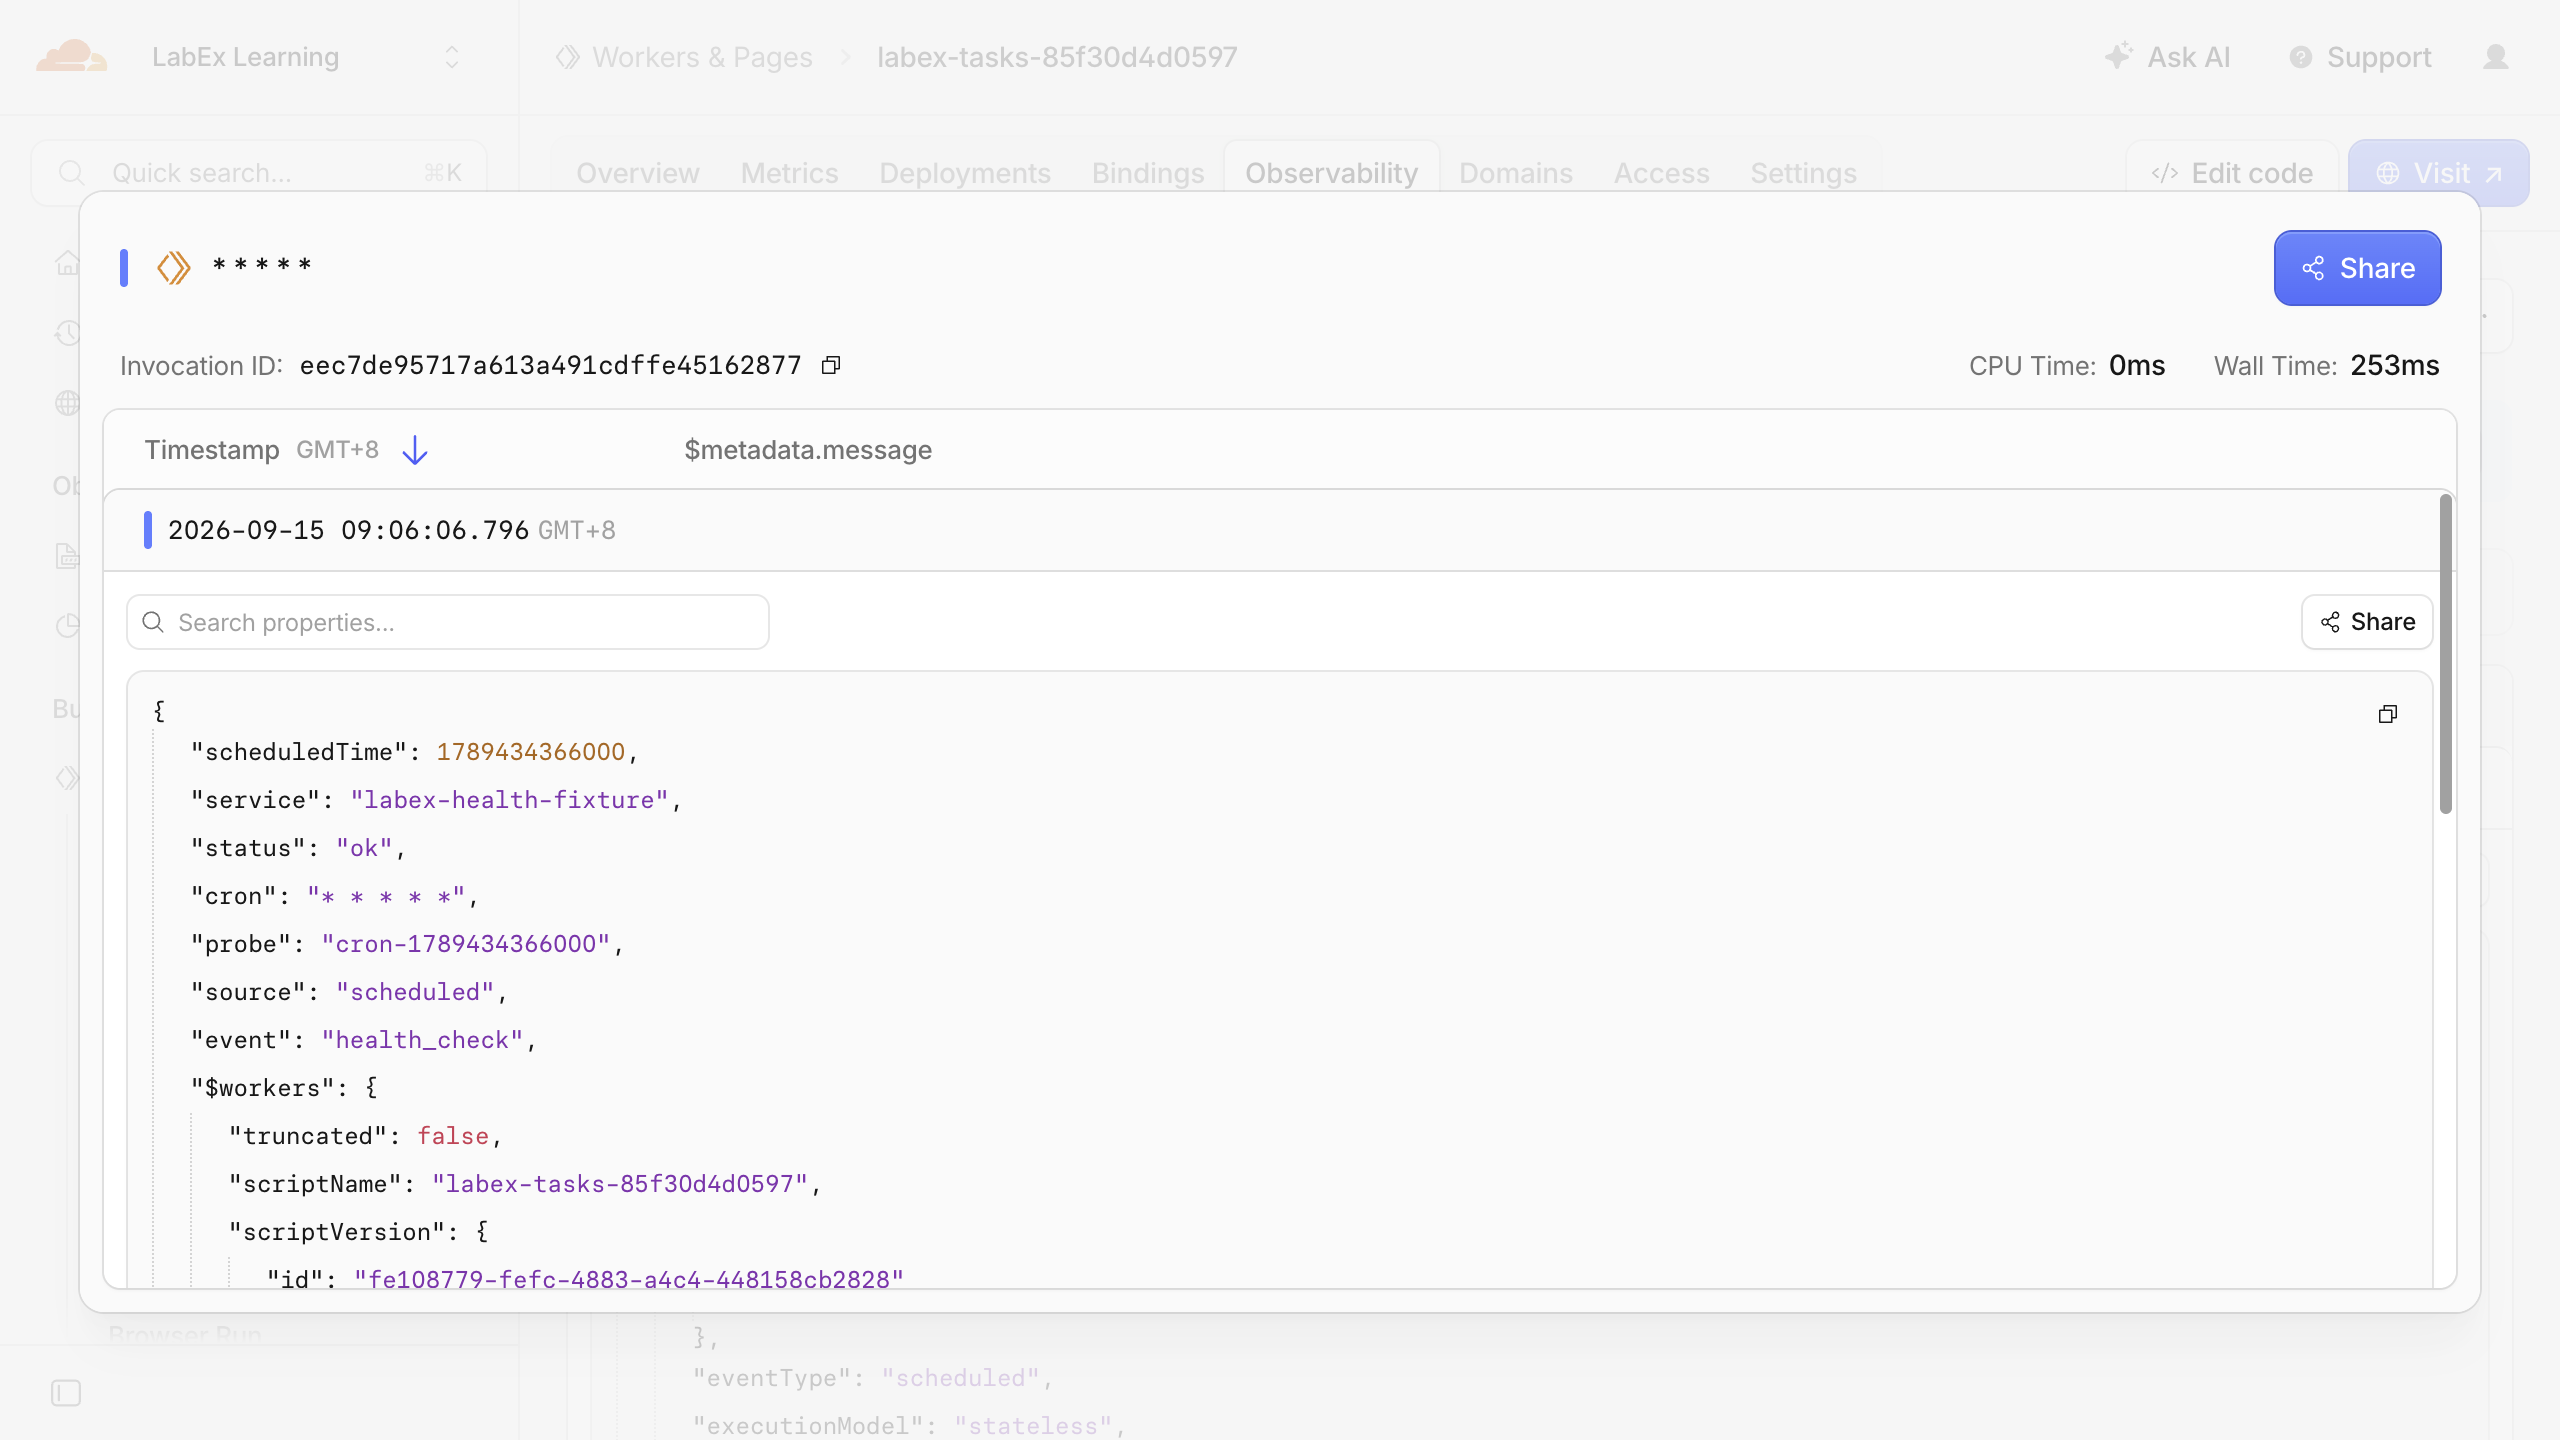
To connect that output to the browser, open the same Worker's Observability → Events page. Use Live while waiting, or refresh the saved event query with a time range that includes your deployment. Invocation rows for this handler display * * * * *. Expand one, select View invocation, and expand its associated application-log row to inspect the health-check fields. A structured application log can have a blank Message cell; expand the row instead of treating it as missing data. You can pause the live display while reading.
In this real example, source is scheduled, status is ok, and service is labex-health-fixture. The cron-... probe matches the application log's scheduledTime in milliseconds. Dashboard renders the visible timestamp in its displayed timezone (GMT+8 here), while the Cron schedule uses UTC. Your name, invocation ID and time will differ. Read these fields together with the invocation outcome; the screenshot itself is not completion evidence.
Cron updates can take up to 15 minutes to propagate. Repeat the one-minute wait and inspect cycle, allowing at most 17 minutes from the successful deployment. Inspect tail-errors.log if the stream is empty or stopped. If no matching event appears within that bound, stop and diagnose configuration, authorization and trigger status; do not report success. This is a bounded learning observation, not a guarantee of exact execution latency. The Cron Triggers documentation explains propagation and UTC scheduling. Saved Workers Logs can also take a short time to appear; refresh the query after allowing for ingestion. The separate Past Cron Events history for a new Worker can take up to 30 minutes to display events. An empty history is not proof of failure; use the real-time observation above within this lab's bound.
Use verification after you observe an execution. It checks the deployed schedule and watches a separate live stream for up to 70 seconds for an actual scheduled event with the health result. This covers a full minute boundary after connection startup. A no-event result is inconclusive, so inspect connection and propagation status and retry within the same observation bound. No scheduled event is manufactured by the assessor. Stop your learner tail only after verification succeeds; use the actual job number.
jobs
kill %1
End the disposable schedule promptly by completing the next step. Do not leave an every-minute learning job running unattended.
Delete Both Scheduled-Test Workers
In this step, remove the public Worker and its trigger, then the internal health fixture, while still authorized. Confirm that both configurations contain this lab's exact names and the intended account.
cat wrangler.jsonc
cat health/wrangler.jsonc
npx wrangler delete
npx wrangler delete -c health/wrangler.jsonc
At each matching name prompt press the single key y. Preserve unrelated projects, the account and its subdomain. The pinned Wrangler may emit the known legacy KV cleanup authentication diagnostic after deleting a Worker; neither that message nor a failed network request proves deletion. Do not broaden permissions for that diagnostic.
Refresh Dashboard and use verification. A successful authenticated Worker inventory must show both names absent. This confirms removal of the deployed resources, not instant global propagation of every scheduler change. Logging out or closing the VM alone would not perform this cleanup.
Disconnect the Lab VM
In this step, confirm the tail job is stopped and the resources are gone before disconnecting this VM.
jobs
npx wrangler logout
npx wrangler whoami --json
Require explicit loggedIn: false. The structured unauthenticated command can exit nonzero; a network error is not the same result. Use verification and end the VM. Your browser login can remain available for later independent labs.
Summary
You used waitUntil to let a bounded health check complete after a foreground acknowledgement, then reused that operation from a scheduled handler. Controlled local tests separated the response from the delayed work, while a real cloud event established scheduled execution after deployment. Configuration, manual invocation and live execution provided different kinds of evidence.
You checked ownership and service bindings, correlated synthetic probes with structured logs, respected invocation lifetime limits and removed the disposable scheduled application before disconnecting. Reliable long-running delivery requires a different architecture from this short-lived background-work pattern.