Project in JavaScript Skill Tree
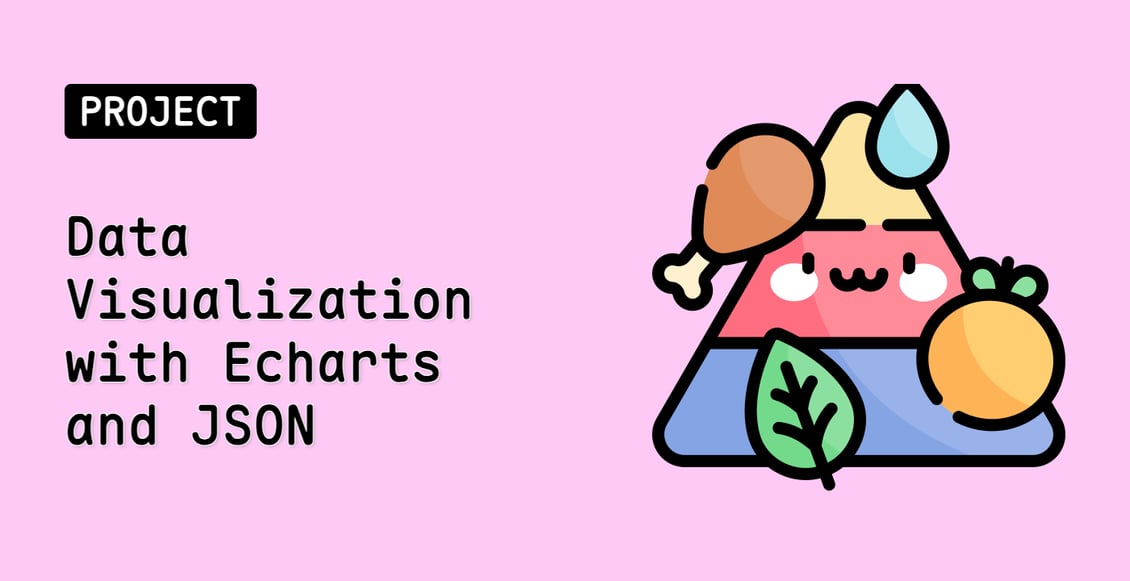
Data Visualization with Echarts and JSON
Beginner
In this project, you will learn how to fetch data from a JSON file, render the protein content of different foods, and create an Echarts pie chart to visualize the data. This project aims to provide you with a hands-on experience in working with data manipulation and data visualization using JavaScript.
javascriptweb-development
Teacher

Labby
Labby is the LabEx teacher.
Upgrade to Get Certificate
Join Our Discord and Learn Together
Join NowUser Reviews
" good way for practiceing comands "
— Sreenath Reddy
" Thank you for the learning lab, I hope to learn much more!"
— Monique