はじめに
この実験 (Lab) では、Python で最も人気のあるデータ可視化ライブラリの 1 つである Matplotlib を使用して、円グラフを作成およびカスタマイズする方法を学びます。円グラフは、数値の割合を示すためにスライスに分割された円形の統計グラフィックです。
データの準備から始め、基本的な円グラフをプロットし、徐々に「explode」効果、パーセンテージラベル、影などの機能を追加して、グラフをより情報豊富で視覚的に魅力的なものにします。
すべての操作は LabEx WebIDE 内で実行されます。ファイルに Python コードを記述し、それを実行してチャート画像を生成します。この環境ではグラフィカル表示が利用できないため、plt.savefig() を使用してチャートを画像ファイルとして保存し、IDE で直接表示します。
ラベルとサイズのリストを準備する
このステップでは、円グラフをプロットするために必要なデータを準備します。円グラフには、2 つの主要なデータセットが必要です。各スライスのラベルと、各スライスの対応するサイズまたは値です。
まず、Python スクリプトを作成します。左側の WebIDE ファイルエクスプローラーで、project ディレクトリ内に main.py という名前のファイルが表示されます。それをダブルクリックしてエディタで開きます。
次に、main.py に以下のコードを追加します。このコードは、カテゴリ用の labels とそれぞれの割合用の sizes という 2 つの Python リストを定義します。
## Data for the pie chart
labels = ['Frogs', 'Hogs', 'Dogs', 'Logs']
sizes = [15, 30, 45, 10]
labels: 円グラフの各スライスにラベルとして使用される文字列のリストです。sizes: 各スライスの値または割合を表す数値のリストです。これらの値の合計が円全体を表します。
コードを追加した後、main.py ファイルは以下のようになります。このスクリプトはまだ何も出力しませんが、次のステップに必要なデータを設定します。
plt.pie(sizes, labels=labels) を使用して円グラフをプロットする
このステップでは、前のステップのデータを使用して基本的な円グラフをプロットします。Matplotlib ライブラリの plt.pie() 関数を使用します。
まず、慣例的にエイリアス plt でインポートされる matplotlib.pyplot モジュールをインポートする必要があります。次に、sizes リストと labels リストを引数として渡して、plt.pie() 関数を呼び出すことができます。
この環境では GUI ウィンドウを表示できないため、plt.savefig() を使用してチャートを画像ファイルに保存します。
main.py ファイルを以下のコードで更新してください。
import matplotlib.pyplot as plt

## Data for the pie chart
labels = ['Frogs', 'Hogs', 'Dogs', 'Logs']
sizes = [15, 30, 45, 10]

## Create a figure and a set of subplots
fig, ax = plt.subplots()

## Plot the pie chart
ax.pie(sizes, labels=labels)

## Save the figure to a file
plt.savefig('/home/labex/project/pie_chart.png')

print("Pie chart saved to pie_chart.png")
次に、スクリプトを実行しましょう。WebIDE でターミナルを開きます(ターミナルパネルの + アイコンまたは Terminal > New Terminal メニューを使用できます)そして以下のコマンドを実行します。
python3 main.py
ターミナルに以下の出力が表示されるはずです。
Pie chart saved to pie_chart.png
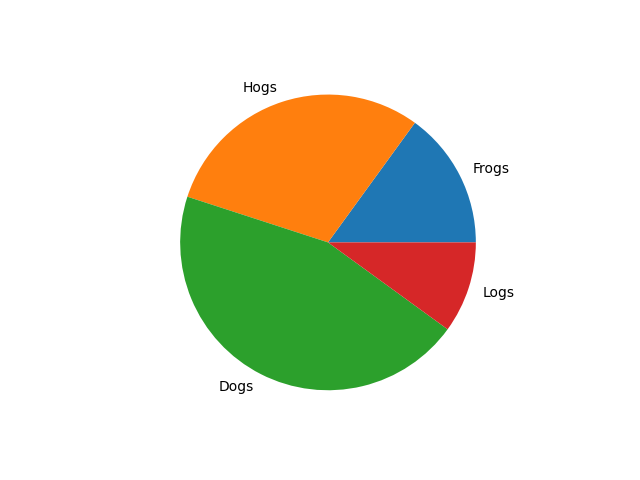
project ディレクトリに pie_chart.png という名前の新しいファイルが表示されます。ファイルエクスプローラーで pie_chart.png をダブルクリックして開き、最初の円グラフを表示します。
explode パラメータを使用して explode 効果を追加する
このステップでは、「explode」させることで円グラフの特定の Слайс を強調する方法を学びます。これは、円の中心からわずかにオフセットさせることを意味します。これは、pie() 関数で explode パラメータを使用して実現されます。
explode パラメータは、sizes データと同じ長さのタプルまたはリストを受け取します。タプルの各値は、各ウェッジをオフセットする半径の割合を指定します。値が 0 の場合、Слайс は元の位置にとどまりますが、0.1 のような非ゼロの値は Слайс を外側に移動させます。
main.py を変更して 'Hogs' Слайс を explode させましょう。また、以前のものと比較するために、出力を新しいファイル pie_chart_explode.png に保存します。
main.py ファイルを以下のコードで更新してください。
import matplotlib.pyplot as plt

## Data for the pie chart
labels = ['Frogs', 'Hogs', 'Dogs', 'Logs']
sizes = [15, 30, 45, 10]
explode = (0, 0.1, 0, 0)  ## only "explode" the 2nd slice (i.e. 'Hogs')

## Create a figure and a set of subplots
fig, ax = plt.subplots()

## Plot the pie chart with explode effect
ax.pie(sizes, explode=explode, labels=labels)

## Save the figure to a file
plt.savefig('/home/labex/project/pie_chart_explode.png')

print("Pie chart with explode effect saved to pie_chart_explode.png")
次に、更新されたスクリプトをターミナルから実行します。
python3 main.py
以下の出力が表示されます。
Pie chart with explode effect saved to pie_chart_explode.png
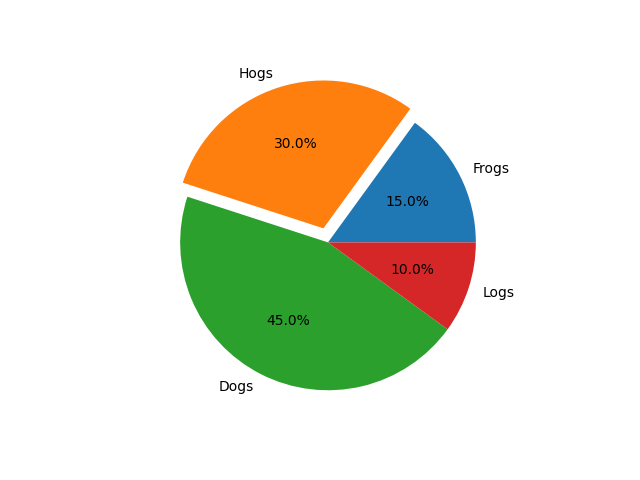
pie_chart_explode.png という新しいファイルがプロジェクトディレクトリに作成されました。これを開いて、'Hogs' Слайс が円の他の部分からわずかに分離されていることを確認してください。

autopct='%1.1f%%' を使用してパーセンテージを表示する
このステップでは、グラフをより分かりやすくするために、各 Слайс にパーセンテージラベルを追加します。これは autopct パラメータを使用して行うことができます。
autopct パラメータは、各 Слайс のパーセンテージ値をどのように表示するかを決定するフォーマット文字列を受け取ります。例えば、'%1.1f%%' は、数値を小数点以下 1 桁の浮動小数点数としてフォーマットし、その後にパーセント記号を付けます。末尾の %% は、リテラルの % シンボルを表示するために必要です。
main.py を更新してパーセンテージを含めましょう。結果を pie_chart_percent.png に保存します。
import matplotlib.pyplot as plt

## Data for the pie chart
labels = ['Frogs', 'Hogs', 'Dogs', 'Logs']
sizes = [15, 30, 45, 10]
explode = (0, 0.1, 0, 0)  ## only "explode" the 2nd slice (i.e. 'Hogs')

## Create a figure and a set of subplots
fig, ax = plt.subplots()

## Plot the pie chart with explode and percentage
ax.pie(sizes, explode=explode, labels=labels, autopct='%1.1f%%')

## Save the figure to a file
plt.savefig('/home/labex/project/pie_chart_percent.png')

print("Pie chart with percentages saved to pie_chart_percent.png")
ターミナルからスクリプトを再度実行します。
python3 main.py
出力は以下のようになります。
Pie chart with percentages saved to pie_chart_percent.png
これで、ファイルエクスプローラーから pie_chart_percent.png を開きます。各 Слайс にパーセンテージ値が表示されていることがわかります。
shadow=True を使用して影を設定する
この最終ステップでは、円グラフに影を追加して、少し 3D のような外観にします。これは、shadow パラメータを True に設定することで簡単に実現できます。
これまでに学んだすべての機能(explode、autopct、shadow)を組み合わせましょう。最終的なグラフは pie_chart_final.png として保存します。
main.py ファイルを以下の完全なコードで更新してください。
import matplotlib.pyplot as plt

## Data for the pie chart
labels = ['Frogs', 'Hogs', 'Dogs', 'Logs']
sizes = [15, 30, 45, 10]
explode = (0, 0.1, 0, 0)  ## only "explode" the 2nd slice (i.e. 'Hogs')

## Create a figure and a set of subplots
fig, ax = plt.subplots()

## Plot the final pie chart with all features
ax.pie(sizes, explode=explode, labels=labels, autopct='%1.1f%%',
        shadow=True, startangle=90)

## Equal aspect ratio ensures that pie is drawn as a circle.
ax.axis('equal')

## Save the figure to a file
plt.savefig('/home/labex/project/pie_chart_final.png')

print("Final pie chart saved to pie_chart_final.png")
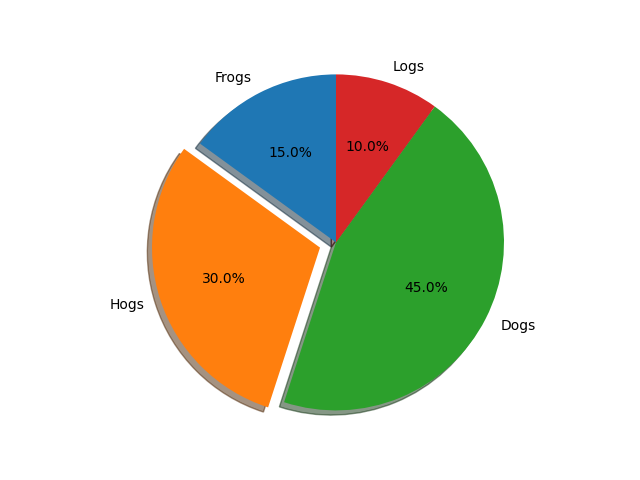
この最終バージョンでは、円グラフの開始点を反時計回りに 90 度回転させるために startangle=90 を追加し、円グラフが完全な円として描画されるように ax.axis('equal') も追加しました。
スクリプトを最後にもう一度実行します。
python3 main.py
出力は以下のようになります。
Final pie chart saved to pie_chart_final.png
pie_chart_final.png を開いて、explode された Слайс、パーセンテージラベル、影を備えた、完成したすべての機能を持つ円グラフを確認してください。
まとめ
実験の完了おめでとうございます!Python の Matplotlib を使用して円グラフを作成およびカスタマイズする方法を習得しました。
この実験では、以下のことを学びました。
- 円グラフのデータ(ラベルとサイズ)を準備する。
plt.pie()を使用して基本的な円グラフをプロットする。plt.savefig()を使用して Matplotlib のプロットを画像ファイルに保存する。explodeパラメータを使用して Слайс を強調する。autopctパラメータを使用して Слайс にパーセンテージ値を表示する。shadow=Trueパラメータを使用して視覚的な 3D 効果を追加する。
これで、データ視覚化プロジェクトのために、情報量が多く視覚的に魅力的な円グラフを作成するための基本的なスキルを習得しました。