简介
在这个实验中,你将学习如何在使用 Matplotlib 创建的图表上设置标题的位置。图表标题有助于查看者理解可视化所传达的信息。Matplotlib 提供了多种设置这些标题位置的选项——居中(默认设置)、左对齐、右对齐或自定义垂直位置。
在本实验结束时,你将能够:
- 创建一个带有居中标题的基本图表
- 将标题设置在图表的左侧或右侧
- 创建一个标题位于自定义位置的图表
- 使用不同的方法调整标题的位置
使用默认标题位置进行基本绘图
在这一步中,你将创建一个简单的折线图并添加一个居中的标题,这是 Matplotlib 中的默认位置。
创建 Jupyter Notebook
虚拟机启动完成后,点击左上角切换到 Notebook 标签页以访问 Jupyter Notebook。

你可能需要等待几秒钟,让 Jupyter Notebook 加载完成。由于 Jupyter Notebook 的限制,操作验证无法自动进行。
如果你在实验过程中遇到任何问题,随时向 Labby 寻求帮助。请在实验结束后提供反馈,以便我们及时解决任何问题。
导入 Matplotlib
现在,让我们从导入 Matplotlib 库开始。在你的 Notebook 的第一个单元格中,输入以下代码并按 Shift+Enter 运行:
import matplotlib.pyplot as plt
这行代码从 Matplotlib 中导入了 pyplot 模块,并将其别名为 plt,这是一种常见的约定。
创建简单的图表
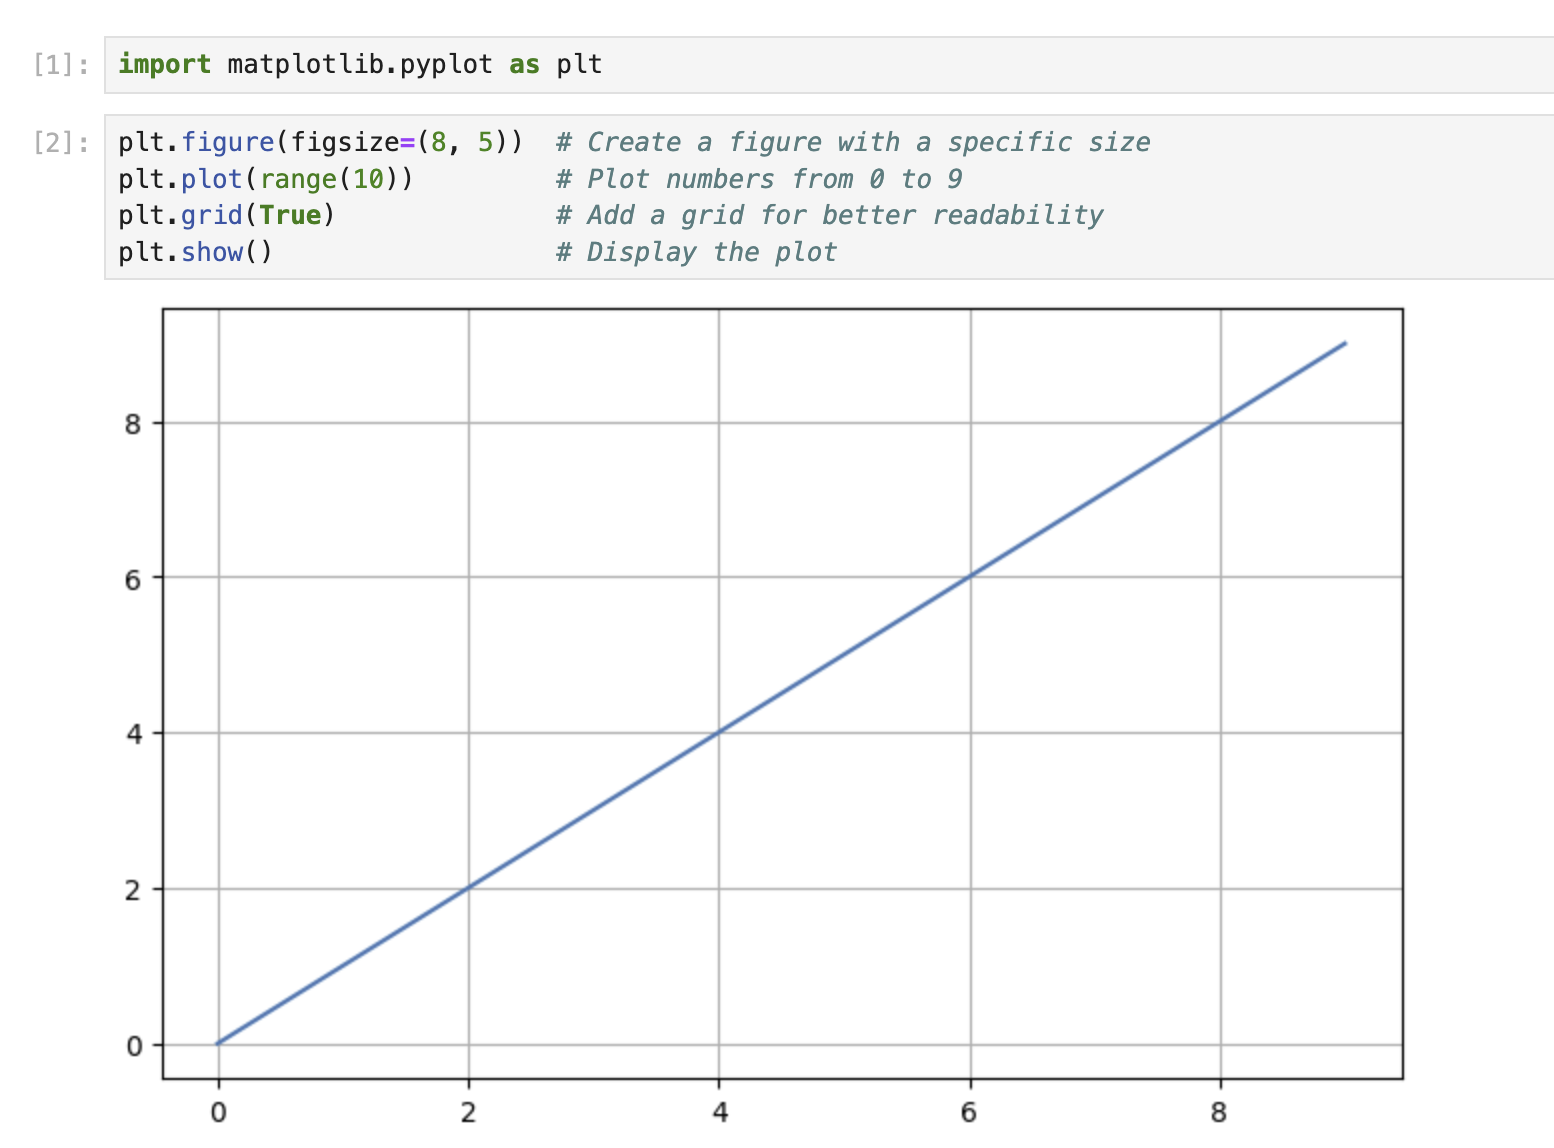
接下来,让我们创建一个基本的折线图。在一个新的单元格中,输入以下代码并运行:
plt.figure(figsize=(8, 5))  ## Create a figure with a specific size
plt.plot(range(10))         ## Plot numbers from 0 to 9
plt.grid(True)              ## Add a grid for better readability
plt.show()                  ## Display the plot
你应该会在输出中看到一个简单的折线图,显示从 0 到 9 的数值。
添加默认(居中)标题
现在,让我们为图表添加一个标题。标题的默认位置是在图表顶部居中。在一个新的单元格中,输入以下代码:
plt.figure(figsize=(8, 5))
plt.plot(range(10))
plt.grid(True)
plt.title('My First Matplotlib Plot')  ## Add a centered title
plt.show()
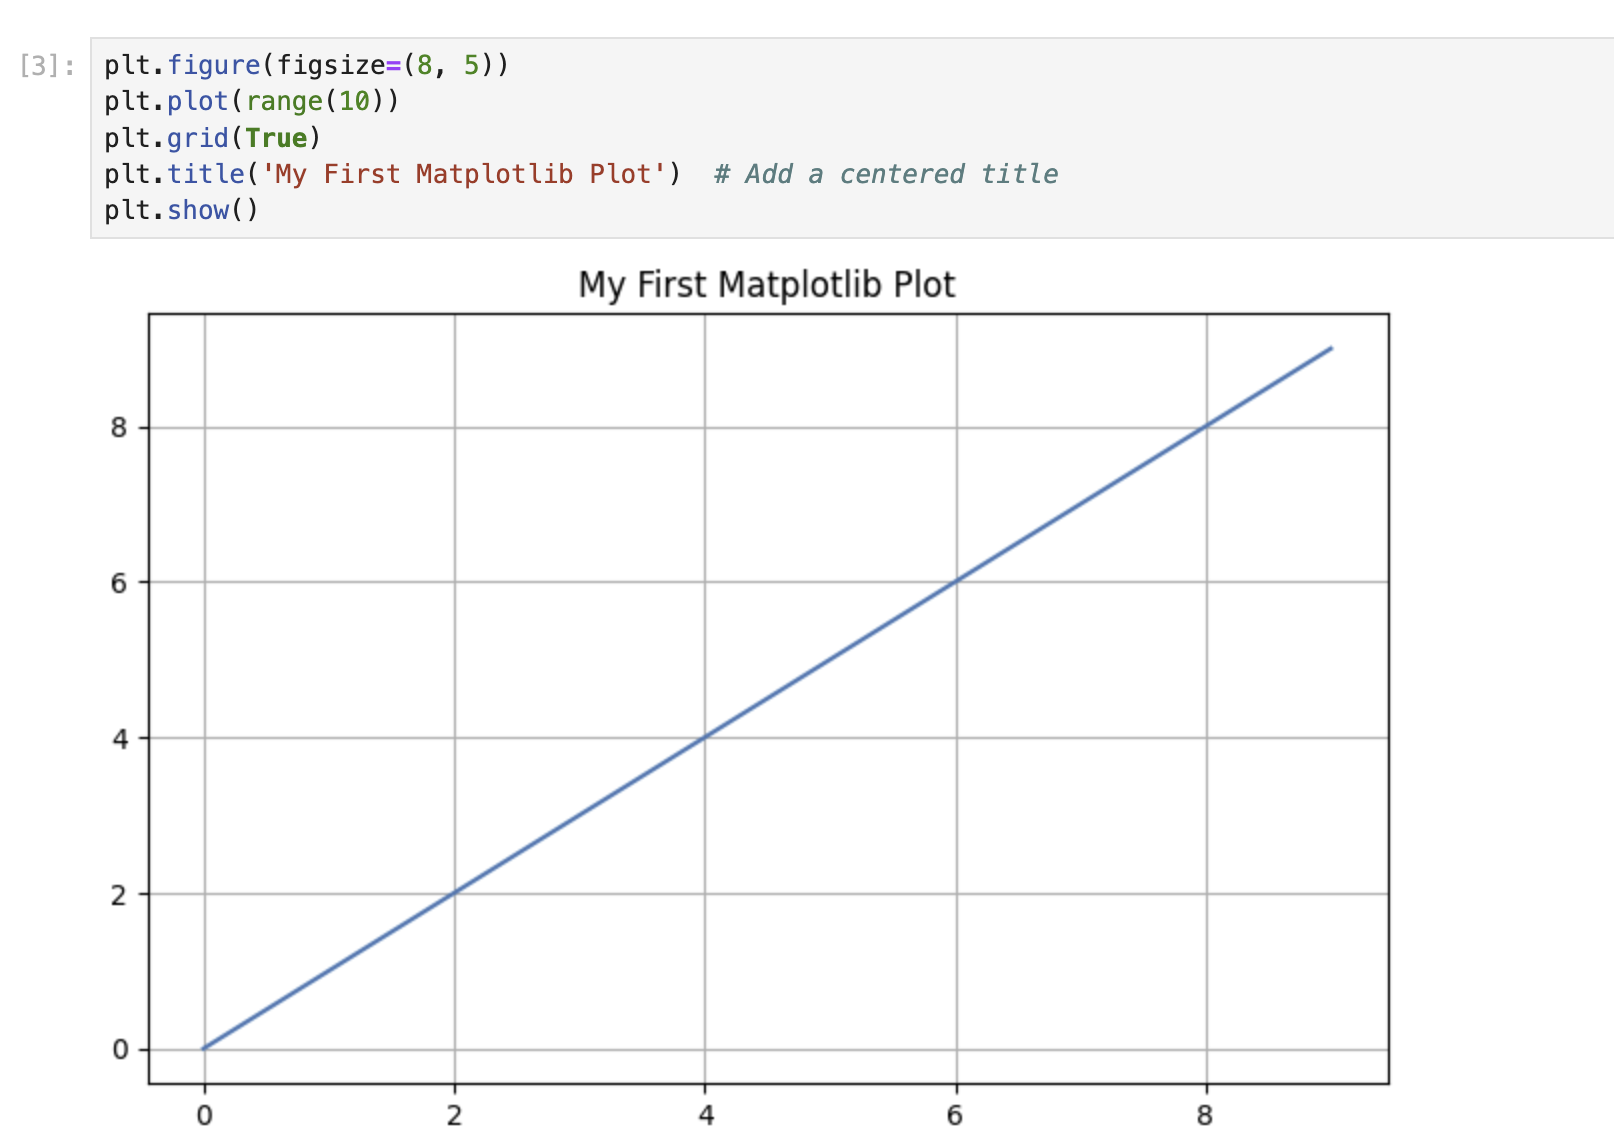
运行该单元格,你应该会看到图表顶部有一个居中的标题。
title() 函数在不使用任何额外参数的情况下会将标题置于中心位置,这是默认设置。
标题左对齐和右对齐
Matplotlib 允许你使用 loc 参数将标题定位在图表的左侧或右侧。在这一步中,你将学习如何将标题对齐到图表的左侧和右侧。
创建标题左对齐的图表
让我们创建一个标题位于左侧的图表。在一个新的单元格中,输入以下代码:
plt.figure(figsize=(8, 5))
plt.plot(range(10))
plt.grid(True)
plt.title('Left-Aligned Title', loc='left')  ## Position the title at the left
plt.show()
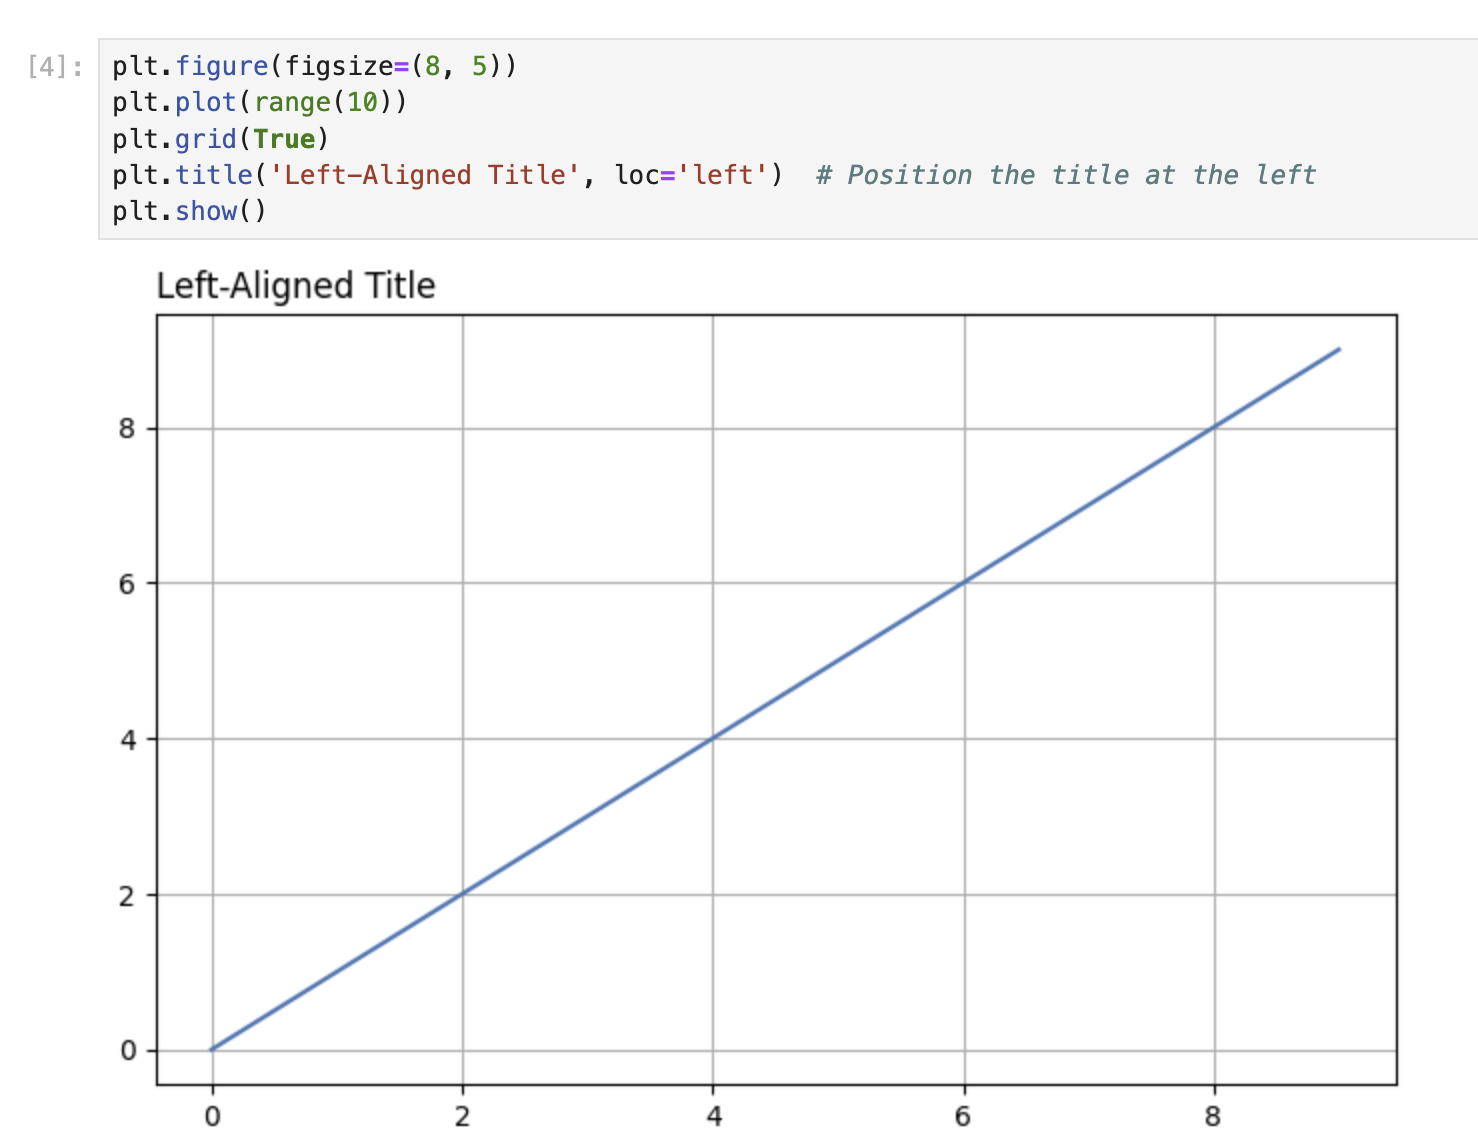
运行该单元格。注意,现在标题是与图表的左边缘对齐,而不是居中显示。
title() 函数中的 loc 参数决定了标题的水平位置。通过设置 loc='left',你是在告诉 Matplotlib 将标题定位在图表的左侧。
创建标题右对齐的图表
现在,让我们创建另一个标题位于右侧的图表。在一个新的单元格中,输入以下代码:
plt.figure(figsize=(8, 5))
plt.plot(range(10))
plt.grid(True)
plt.title('Right-Aligned Title', loc='right')  ## Position the title at the right
plt.show()
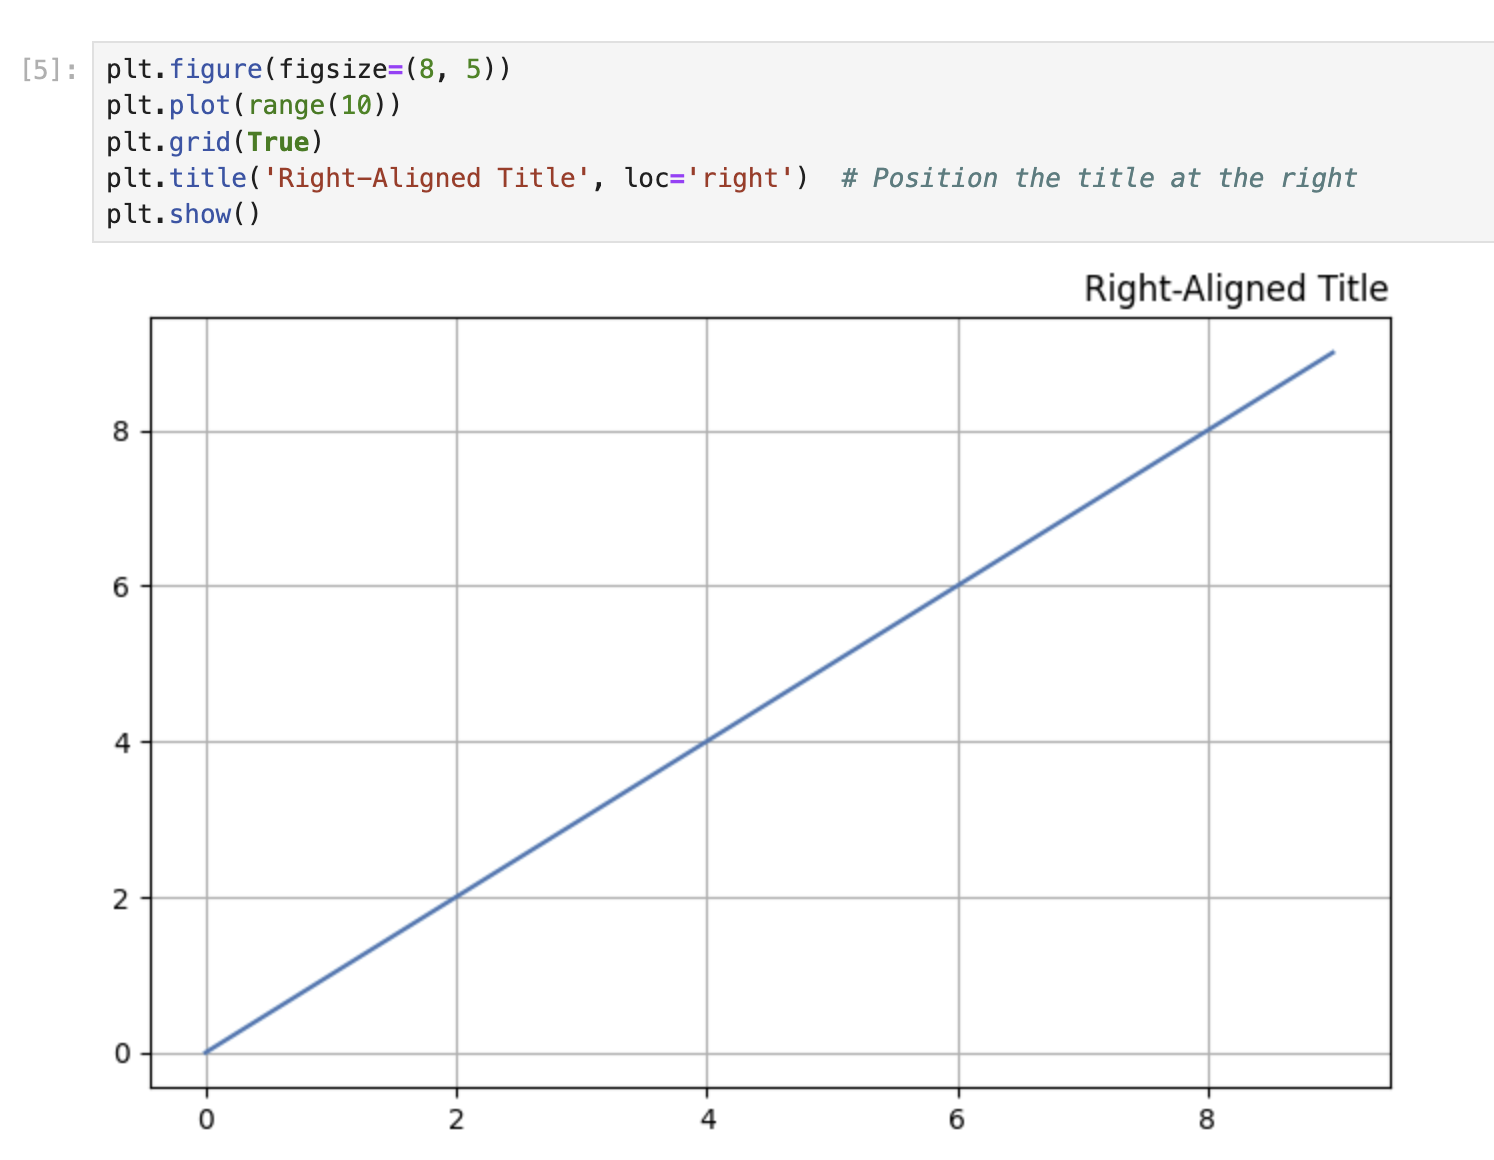
运行该单元格。标题现在应该与图表的右边缘对齐。
比较不同的标题位置
让我们创建一组三个图表,以比较不同的标题位置(居中、左对齐和右对齐)。在一个新的单元格中,输入以下代码:
## Create a figure with 3 subplots arranged horizontally
fig, axes = plt.subplots(1, 3, figsize=(15, 4))

## Plot 1: Center-aligned title (default)
axes[0].plot(range(10))
axes[0].grid(True)
axes[0].set_title('Center Title')

## Plot 2: Left-aligned title
axes[1].plot(range(10))
axes[1].grid(True)
axes[1].set_title('Left Title', loc='left')

## Plot 3: Right-aligned title
axes[2].plot(range(10))
axes[2].grid(True)
axes[2].set_title('Right Title', loc='right')

plt.tight_layout()  ## Adjust spacing between subplots
plt.show()
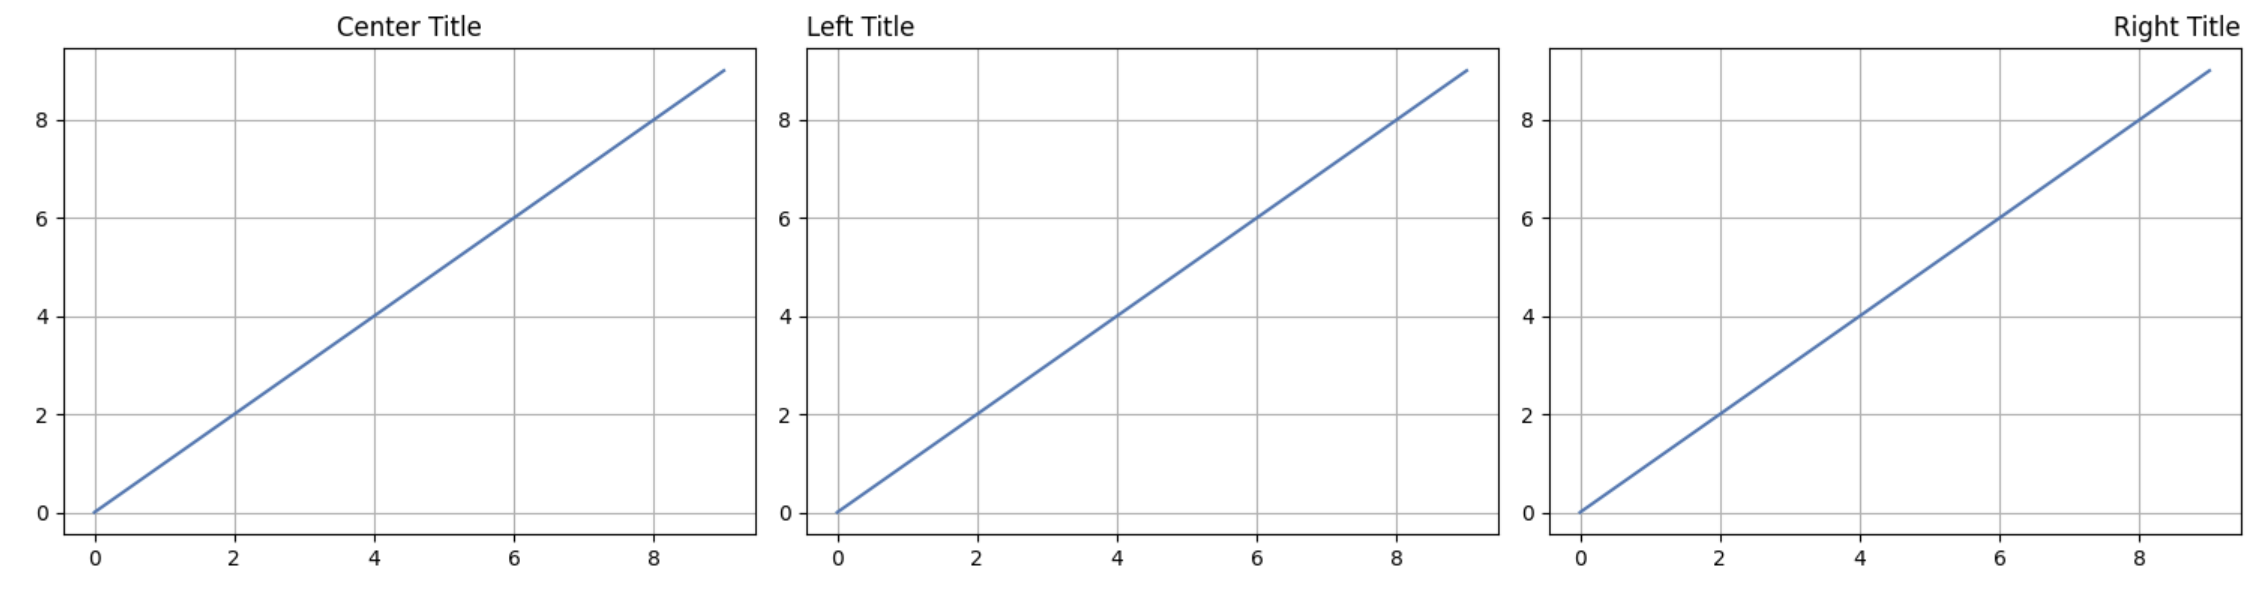
运行该单元格,你将看到三种标题位置并排显示。这种可视化比较有助于你理解 loc 参数是如何影响标题位置的。
请注意,在处理子图时,我们使用单个轴对象的 set_title() 方法,而不是全局的 plt.title() 函数。
自定义标题垂直位置
有时你可能想要调整标题的垂直位置。在这一步中,你将学习如何手动控制图表标题的垂直(y 轴)位置。
理解标题的 Y 轴位置
标题的垂直位置可以使用 title() 函数中的 y 参数进行调整。y 参数接受归一化坐标值,其中:
y = 1.0(默认值)将标题置于图表顶部。y > 1.0将标题置于图表顶部上方。y < 1.0将标题置于图表顶部下方,使其更靠近图表内容。
创建具有自定义标题 Y 轴位置的图表
让我们创建一个标题位置比默认位置更高的图表。在一个新的单元格中,输入以下代码:
plt.figure(figsize=(8, 5))
plt.plot(range(10))
plt.grid(True)
plt.title('Higher Title Position', y=1.1)  ## Position the title higher
plt.show()
运行该单元格。注意,与默认位置相比,标题现在出现在图表上方稍高的位置。
现在,让我们创建一个标题位置比默认位置更低的图表:
plt.figure(figsize=(8, 5))
plt.plot(range(10))
plt.grid(True)
plt.title('Lower Title Position', y=0.9)  ## Position the title lower
plt.show()
运行该单元格。标题现在应该更靠近图表内容。
比较不同的 Y 轴位置
让我们并排创建多个图表,以比较不同的标题垂直位置:
## Create a figure with 3 subplots arranged horizontally
fig, axes = plt.subplots(1, 3, figsize=(15, 4))

## Plot 1: Default Y-position
axes[0].plot(range(10))
axes[0].grid(True)
axes[0].set_title('Default Position (y=1.0)')

## Plot 2: Higher Y-position
axes[1].plot(range(10))
axes[1].grid(True)
axes[1].set_title('Higher Position', y=1.15)

## Plot 3: Lower Y-position
axes[2].plot(range(10))
axes[2].grid(True)
axes[2].set_title('Lower Position', y=0.85)

plt.tight_layout()  ## Adjust spacing between subplots
plt.show()
运行该单元格,你将看到三种垂直位置并排显示。这种比较有助于你理解 y 参数如何影响标题的垂直位置。
结合水平和垂直定位
你可以将 loc 参数(用于水平对齐)与 y 参数(用于垂直位置)结合使用,将标题精确地放置在你想要的位置:
plt.figure(figsize=(8, 5))
plt.plot(range(10))
plt.grid(True)
plt.title('Custom Positioned Title', loc='right', y=1.1)  ## Right-aligned and higher
plt.show()
运行该单元格。标题现在应该与图表的右边缘对齐,并且位置比默认位置更高。
使用子图进行高级标题定位
在这一步中,你将学习在使用子图布局和轴对象时进行标题定位的高级技巧。你还将学习如何使用 suptitle() 函数为包含多个子图的图形添加一个整体标题。
创建带有子图和独立标题的图形
让我们创建一个 2x2 的子图网格,每个子图的标题位置都不同:
## Create a figure with a 2x2 grid of subplots
fig, axes = plt.subplots(2, 2, figsize=(10, 8))

## Flatten the 2D array of axes for easier iteration
axes = axes.flatten()

## Plot data and set titles with different positions for each subplot
for i, ax in enumerate(axes):
    ax.plot(range(10))
    ax.grid(True)

## Top-left subplot: Default centered title
axes[0].set_title('Default (Centered)')

## Top-right subplot: Left-aligned title
axes[1].set_title('Left-Aligned', loc='left')

## Bottom-left subplot: Right-aligned title
axes[2].set_title('Right-Aligned', loc='right')

## Bottom-right subplot: Custom positioned title
axes[3].set_title('Custom Position', y=0.85, loc='center')

## Add spacing between subplots
plt.tight_layout()
plt.show()
运行该单元格。你应该会看到四个子图,每个子图的标题位置都不同。
使用 suptitle() 添加图形级别的标题
在处理多个子图时,你可能想要为整个图形添加一个整体标题。这可以使用 suptitle() 函数来完成:
## Create a figure with a 2x2 grid of subplots
fig, axes = plt.subplots(2, 2, figsize=(10, 8))

## Flatten the 2D array of axes for easier iteration
axes = axes.flatten()

## Plot data on each subplot
for i, ax in enumerate(axes):
    ax.plot(range(10))
    ax.grid(True)
    ax.set_title(f'Subplot {i+1}')

## Add an overall title to the figure
fig.suptitle('Multiple Subplots with an Overall Title', fontsize=16)

## Add spacing between subplots
plt.tight_layout()
## Add top spacing for the suptitle
plt.subplots_adjust(top=0.9)
plt.show()
运行该单元格。你应该会看到四个子图,每个子图都有自己的标题,并且图形顶部有一个整体标题。
结合轴标题和图形标题
你可以将各个子图的标题与图形的整体标题结合起来:
## Create a figure with a 2x2 grid of subplots
fig, axes = plt.subplots(2, 2, figsize=(10, 8))

## Plot data on each subplot with different title positions
axes[0, 0].plot(range(10))
axes[0, 0].grid(True)
axes[0, 0].set_title('Centered Title', loc='center')

axes[0, 1].plot(range(10))
axes[0, 1].grid(True)
axes[0, 1].set_title('Left-Aligned Title', loc='left')

axes[1, 0].plot(range(10))
axes[1, 0].grid(True)
axes[1, 0].set_title('Right-Aligned Title', loc='right')

axes[1, 1].plot(range(10))
axes[1, 1].grid(True)
axes[1, 1].set_title('Lower Title', y=0.85)

## Add an overall title to the figure
fig.suptitle('Advanced Title Positioning Demo', fontsize=16)

## Add spacing between subplots
plt.tight_layout()
## Add top spacing for the suptitle
plt.subplots_adjust(top=0.9)
plt.show()
运行该单元格。你应该会看到一个包含四个子图的图形,每个子图的标题位置都不同,并且图形顶部有一个整体标题。
suptitle() 函数对于添加描述整个图形的主标题很有用,而在轴对象上单独调用 set_title() 则可以为每个子图添加更具体的标题。
使用 RCParams 进行全局标题定位
在这最后一步中,你将学习如何使用 Matplotlib 的运行时配置参数(RCParams)来设置标题定位的全局默认值。当你希望笔记本或脚本中的所有图表都使用一致的标题定位,而无需为每个图表单独指定时,这非常有用。
理解 Matplotlib 中的 RCParams
可以使用一个类似字典的变量 rcParams 来定制 Matplotlib 的行为。这使你能够为各种属性设置全局默认值,包括标题定位。
使用 rcParams 设置全局标题定位
让我们为标题定位设置全局默认值,然后创建一些会自动使用这些设置的图表:
## View the current default values
print("Default title y position:", plt.rcParams['axes.titley'])
print("Default title padding:", plt.rcParams['axes.titlepad'])
运行该单元格以查看默认值。现在,让我们修改这些设置:
## Set new global defaults for title positioning
plt.rcParams['axes.titley'] = 1.05     ## Set title y position higher
plt.rcParams['axes.titlepad'] = 10     ## Set padding between title and plot
plt.rcParams['axes.titlelocation'] = 'left'  ## Set default alignment to left

## Create a plot that will use the new defaults
plt.figure(figsize=(8, 5))
plt.plot(range(10))
plt.grid(True)
plt.title('This Title Uses Global RCParams Settings')
plt.show()
运行该单元格。注意,即使我们在 title() 函数中没有指定任何定位参数,标题也是根据我们定义的全局设置进行定位的。
创建使用相同设置的多个图表
让我们创建几个都使用我们全局设置的图表:
## Create a figure with a 2x2 grid of subplots
fig, axes = plt.subplots(2, 2, figsize=(10, 8))

## Flatten the 2D array of axes for easier iteration
axes = axes.flatten()

## Plot data on each subplot with titles that use global settings
for i, ax in enumerate(axes):
    ax.plot(range(10))
    ax.grid(True)
    ax.set_title(f'Subplot {i+1} Using Global Settings')

plt.tight_layout()
plt.show()
运行该单元格。所有四个子图的标题都应该根据我们之前定义的全局设置进行定位。
将 RCParams 重置为默认值
如果你想将 RCParams 重置为默认值,可以使用 rcdefaults() 函数:
## Reset to default settings
plt.rcdefaults()

## Create a plot with default settings
plt.figure(figsize=(8, 5))
plt.plot(range(10))
plt.grid(True)
plt.title('This Title Uses Default Settings Again')
plt.show()
运行该单元格。现在标题应该使用 Matplotlib 的默认设置进行定位。
临时更改 RCParams
如果你只想在代码的特定部分临时更改 RCParams,可以使用上下文管理器:
## Create a plot with default settings
plt.figure(figsize=(8, 5))
plt.plot(range(10))
plt.grid(True)
plt.title('Default Settings')
plt.show()

## Temporarily change RCParams for just this section
with plt.rc_context({'axes.titlelocation': 'right', 'axes.titley': 1.1}):
    plt.figure(figsize=(8, 5))
    plt.plot(range(10))
    plt.grid(True)
    plt.title('Temporary Settings Change')
    plt.show()

## Create another plot that will use default settings again
plt.figure(figsize=(8, 5))
plt.plot(range(10))
plt.grid(True)
plt.title('Back to Default Settings')
plt.show()
运行该单元格。你应该会看到三个图表:
- 第一个图表使用默认的标题定位。
- 第二个图表的标题右对齐且位置更高(由于临时设置)。
- 第三个图表再次使用默认的标题定位(因为临时设置仅在上下文管理器内生效)。
这种方法允许你临时更改全局设置,而不会影响其他图表。
总结
在这个实验中,你学习了如何在 Matplotlib 中控制图表标题的位置:
- 基本标题定位:你使用默认定位创建了带有居中标题的简单图表。
- 水平定位:你学习了如何使用
loc参数将标题对齐到图表的左侧或右侧。 - 垂直定位:你了解了如何使用
y参数调整标题的垂直位置,使其相对于图表更高或更低。 - 使用子图的高级技巧:你探索了如何在各个子图上定位标题,以及如何使用
suptitle()添加整个图形的标题。 - 使用 RCParams 设置全局设置:你学习了如何使用 Matplotlib 的运行时配置参数为标题定位设置全局默认值,从而使多个图表具有一致的样式。
这些技能将帮助你创建更专业、更具视觉吸引力的数据可视化图表,让标题精确地位于你想要的位置。标题定位是有效数据可视化中一个虽小但重要的方面,有助于引导观众的注意力并提高图表的整体清晰度。
为了进一步探索,你可以考虑尝试其他标题自定义选项,如字体属性、旋转和颜色,以使你的可视化效果更具影响力。