介绍
在本实验中,你将学习如何使用 Matplotlib(Python 中最流行的数据可视化库之一)创建和自定义饼图。饼图是一种圆形统计图,它被分成多个扇形来展示数值比例。
你将从准备数据开始,然后绘制一个基础饼图,并逐步添加“爆炸”效果、百分比标签和阴影等功能,使图表更具信息量和视觉吸引力。
所有操作都将在 LabEx WebIDE 中进行。你将在一个文件中编写 Python 代码并执行它来生成图表图像。由于此环境中没有图形显示,你将使用 plt.savefig() 将图表保存为图像文件,然后在 IDE 中直接查看它们。
准备标签和大小列表
在此步骤中,你将准备绘制饼图所需的数据。饼图需要两组主要数据:每个扇形的标签及其对应的大小或值。
首先,让我们创建一个 Python 脚本。在左侧的 WebIDE 文件浏览器中,你会在 project 目录下看到一个名为 main.py 的文件。双击它在编辑器中打开。
现在,将以下代码添加到 main.py。此代码定义了两个 Python 列表:labels 用于类别,sizes 用于它们各自的比例。
## Data for the pie chart
labels = ['Frogs', 'Hogs', 'Dogs', 'Logs']
sizes = [15, 30, 45, 10]
labels: 一个字符串列表,将用于标记饼图的每个扇形。sizes: 一个数字列表,表示每个扇形的值或比例。这些值的总和将代表整个饼图。
添加代码后,你的 main.py 文件应如下所示。此脚本目前不会产生任何输出,但它为后续步骤设置了必要的数据。
使用 plt.pie(sizes, labels=labels) 绘制饼图
在此步骤中,你将使用上一步的数据绘制一个基础饼图。我们将使用 Matplotlib 库中的 plt.pie() 函数。
首先,你需要导入 matplotlib.pyplot 模块,该模块通常以别名 plt 导入。然后,你可以调用 plt.pie() 函数,并将你的 sizes 和 labels 列表作为参数传递。
由于在此环境中无法显示 GUI 窗口,我们将使用 plt.savefig() 将图表保存到图像文件。
使用以下代码更新你的 main.py 文件:
import matplotlib.pyplot as plt

## Data for the pie chart
labels = ['Frogs', 'Hogs', 'Dogs', 'Logs']
sizes = [15, 30, 45, 10]

## Create a figure and a set of subplots
fig, ax = plt.subplots()

## Plot the pie chart
ax.pie(sizes, labels=labels)

## Save the figure to a file
plt.savefig('/home/labex/project/pie_chart.png')

print("Pie chart saved to pie_chart.png")
现在,让我们运行脚本。在 WebIDE 中打开一个终端(你可以使用终端面板中的 + 图标或 Terminal > New Terminal 菜单),然后执行以下命令:
python3 main.py
你将在终端中看到以下输出:
Pie chart saved to pie_chart.png
一个名为 pie_chart.png 的新文件将出现在你的 project 目录中。在文件浏览器中双击 pie_chart.png 打开它,查看你的第一个饼图。
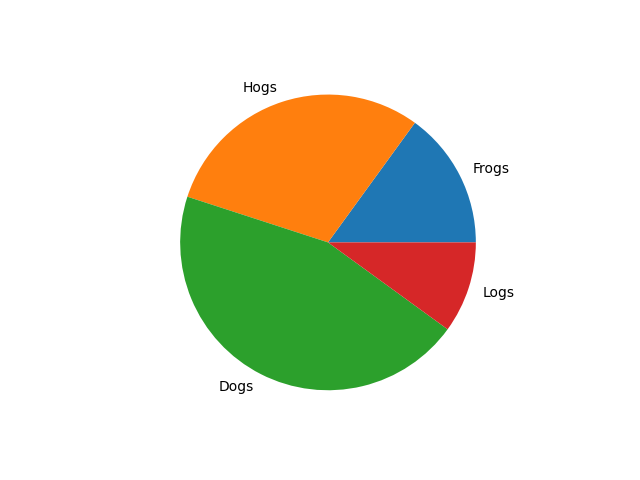
使用 explode 参数添加爆炸效果
在此步骤中,你将学习如何通过“爆炸”来突出饼图中的特定扇形。这意味着将其稍微从饼图中心移开。这可以通过 pie() 函数中的 explode 参数来实现。
explode 参数接受一个与你的 sizes 数据长度相同的元组或列表。元组中的每个值指定了扇形偏移的半径比例。值为 0 表示扇形保持原位,而非零值(如 0.1)则会将其移出。
让我们修改 main.py 来爆炸 'Hogs' 扇形。我们还将输出保存到新文件 pie_chart_explode.png,以便与之前的进行比较。
使用以下代码更新你的 main.py 文件:
import matplotlib.pyplot as plt

## Data for the pie chart
labels = ['Frogs', 'Hogs', 'Dogs', 'Logs']
sizes = [15, 30, 45, 10]
explode = (0, 0.1, 0, 0)  ## only "explode" the 2nd slice (i.e. 'Hogs')

## Create a figure and a set of subplots
fig, ax = plt.subplots()

## Plot the pie chart with explode effect
ax.pie(sizes, explode=explode, labels=labels)

## Save the figure to a file
plt.savefig('/home/labex/project/pie_chart_explode.png')

print("Pie chart with explode effect saved to pie_chart_explode.png")
现在,从终端运行更新后的脚本:
python3 main.py
你将看到此输出:
Pie chart with explode effect saved to pie_chart_explode.png
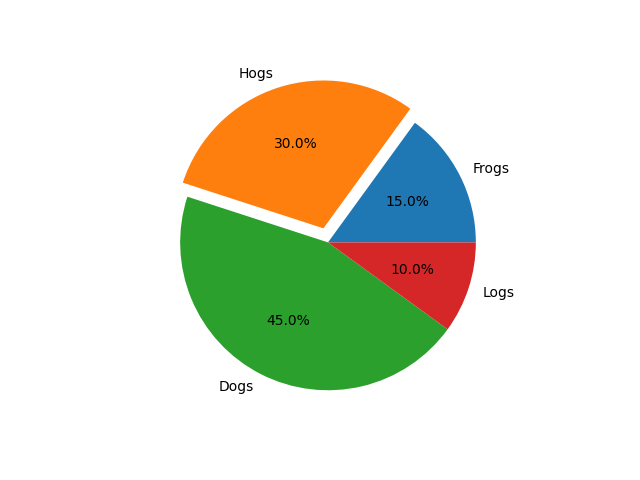
一个名为 pie_chart_explode.png 的新文件现在位于你的项目目录中。打开它,你将看到 'Hogs' 扇形与饼图的其余部分略有分离。

使用 autopct='%1.1f%%' 显示百分比
在此步骤中,你将为每个扇形添加百分比标签,使图表更具信息量。这可以通过 autopct 参数完成。
autopct 参数接受一个格式字符串,该字符串决定了每个扇形的百分比值如何显示。例如,'%1.1f%%' 将数字格式化为带有一个小数位的浮点数,后跟一个百分号。末尾的 %% 是显示字面百分号所必需的。
让我们更新 main.py 以包含百分比。我们将结果保存到 pie_chart_percent.png。
import matplotlib.pyplot as plt

## Data for the pie chart
labels = ['Frogs', 'Hogs', 'Dogs', 'Logs']
sizes = [15, 30, 45, 10]
explode = (0, 0.1, 0, 0)  ## only "explode" the 2nd slice (i.e. 'Hogs')

## Create a figure and a set of subplots
fig, ax = plt.subplots()

## Plot the pie chart with explode and percentage
ax.pie(sizes, explode=explode, labels=labels, autopct='%1.1f%%')

## Save the figure to a file
plt.savefig('/home/labex/project/pie_chart_percent.png')

print("Pie chart with percentages saved to pie_chart_percent.png")
再次从终端运行脚本:
python3 main.py
输出将是:
Pie chart with percentages saved to pie_chart_percent.png
现在,从文件浏览器打开 pie_chart_percent.png。你将看到每个扇形上都显示了其百分比值。
使用 shadow=True 设置阴影
在最后一步中,你将为饼图添加阴影,使其具有一点 3D 外观。这可以通过将 shadow 参数设置为 True 来轻松实现。
让我们结合所有学到的功能:爆炸 (explode)、百分比显示 (autopct) 和阴影 (shadow)。我们将最终图表保存为 pie_chart_final.png。
使用完整的代码更新你的 main.py 文件:
import matplotlib.pyplot as plt

## Data for the pie chart
labels = ['Frogs', 'Hogs', 'Dogs', 'Logs']
sizes = [15, 30, 45, 10]
explode = (0, 0.1, 0, 0)  ## only "explode" the 2nd slice (i.e. 'Hogs')

## Create a figure and a set of subplots
fig, ax = plt.subplots()

## Plot the final pie chart with all features
ax.pie(sizes, explode=explode, labels=labels, autopct='%1.1f%%',
        shadow=True, startangle=90)

## Equal aspect ratio ensures that pie is drawn as a circle.
ax.axis('equal')

## Save the figure to a file
plt.savefig('/home/labex/project/pie_chart_final.png')

print("Final pie chart saved to pie_chart_final.png")
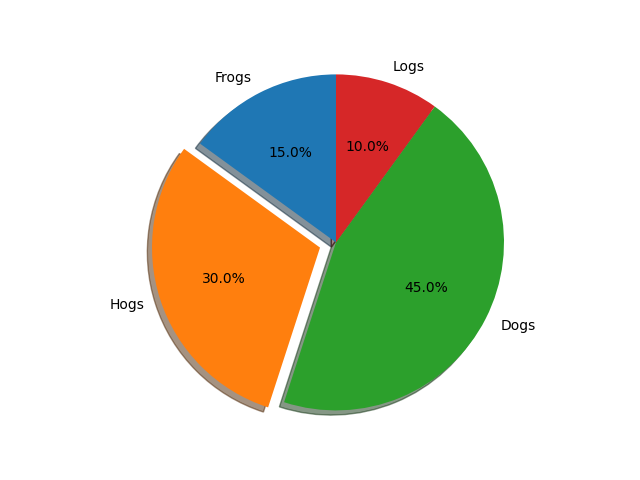
在这个最终版本中,我们还添加了 startangle=90 以将饼图的起始点逆时针旋转 90 度,并添加了 ax.axis('equal') 以确保饼图绘制成一个完美的圆形。
最后一次执行脚本:
python3 main.py
输出将是:
Final pie chart saved to pie_chart_final.png
打开 pie_chart_final.png,你将看到你完成的、功能齐全的饼图,其中包含一个爆炸的扇形、百分比标签和阴影。
总结
恭喜你完成了本次实验!你已成功学会了如何使用 Python 中的 Matplotlib 创建和自定义饼图。
在本次实验中,你学会了:
- 为饼图准备数据(标签和大小)。
- 使用
plt.pie()绘制基础饼图。 - 使用
plt.savefig()将 Matplotlib 图表保存到图像文件。 - 使用
explode参数突出显示某个扇形。 - 使用
autopct参数在扇形上显示百分比值。 - 使用
shadow=True参数添加视觉上的 3D 效果。
现在你已掌握了为数据可视化项目创建信息丰富且视觉吸引人的饼图的基本技能。