Introducción
Este laboratorio demuestra cómo utilizar Python Matplotlib para dibujar elipses. El laboratorio cubre dos ejemplos:
- Dibujar elipses individuales
- Dibujar elipses con diferentes ángulos
Puedes abrir el archivo
ellipse-demo.ipynben WebIDE para comenzar los ejercicios. Aprende cómo utilizar Jupyter Notebooks en VS Code.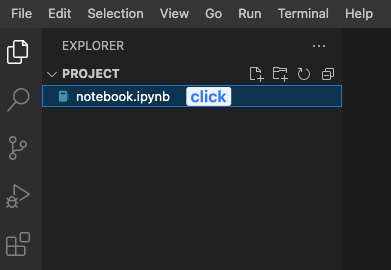 Labby no puede verificar automáticamente las respuestas porque no puede acceder al cuaderno.
Importación de las bibliotecas necesarias
Primero, necesitamos importar las bibliotecas necesarias. Utilizaremos numpy para generar datos aleatorios, y matplotlib.pyplot y matplotlib.patches para dibujar las elipses.
import matplotlib.pyplot as plt
import numpy as np
from matplotlib.patches import Ellipse
Dibujar elipses individuales
En este ejemplo, dibujaremos muchas elipses con tamaños, posiciones y colores aleatorios. Cada elipse será una instancia de la clase Ellipse.
## Fixing random state for reproducibility
np.random.seed(19680801)

## Number of ellipses to draw
NUM = 250

## Generate the ellipses
ells = [Ellipse(xy=np.random.rand(2) * 10,
                width=np.random.rand(), height=np.random.rand(),
                angle=np.random.rand() * 360)
        for i in range(NUM)]

## Create the plot and set the aspect ratio to 'equal'
fig, ax = plt.subplots(subplot_kw={'aspect': 'equal'})

## Add each ellipse to the plot
for e in ells:
    ax.add_artist(e)
    e.set_clip_box(ax.bbox)
    e.set_alpha(np.random.rand())
    e.set_facecolor(np.random.rand(3))

## Set the x and y limits of the plot
ax.set_xlim(0, 10)
ax.set_ylim(0, 10)

## Show the plot
plt.show()
Dibujar elipses con diferentes ángulos
En este ejemplo, dibujaremos muchas elipses con diferentes ángulos. Utilizaremos un bucle para crear una instancia de Ellipse para cada ángulo que queramos dibujar.
## Define the angle step and the range of angles to draw
angle_step = 45  ## degrees
angles = np.arange(0, 180, angle_step)

## Create the plot and set the aspect ratio to 'equal'
fig, ax = plt.subplots(subplot_kw={'aspect': 'equal'})

## Loop over the angles and draw an ellipse for each angle
for angle in angles:
    ellipse = Ellipse((0, 0), 4, 2, angle=angle, alpha=0.1)
    ax.add_artist(ellipse)

## Set the x and y limits of the plot
ax.set_xlim(-2.2, 2.2)
ax.set_ylim(-2.2, 2.2)

## Show the plot
plt.show()
Resumen
En este laboratorio, hemos aprendido cómo utilizar Python Matplotlib para dibujar elipses. Hemos cubierto dos ejemplos: dibujar elipses individuales y dibujar elipses con diferentes ángulos. Siguiendo los pasos de este laboratorio, deberías poder dibujar elipses en tus propios proyectos de Python utilizando Matplotlib.