

What Can eBPF Show About a Linux HTTP Service?
Compare known HTTP requests with real OBI output on Linux, then separate automatic protocol observations from application behavior they cannot explain.

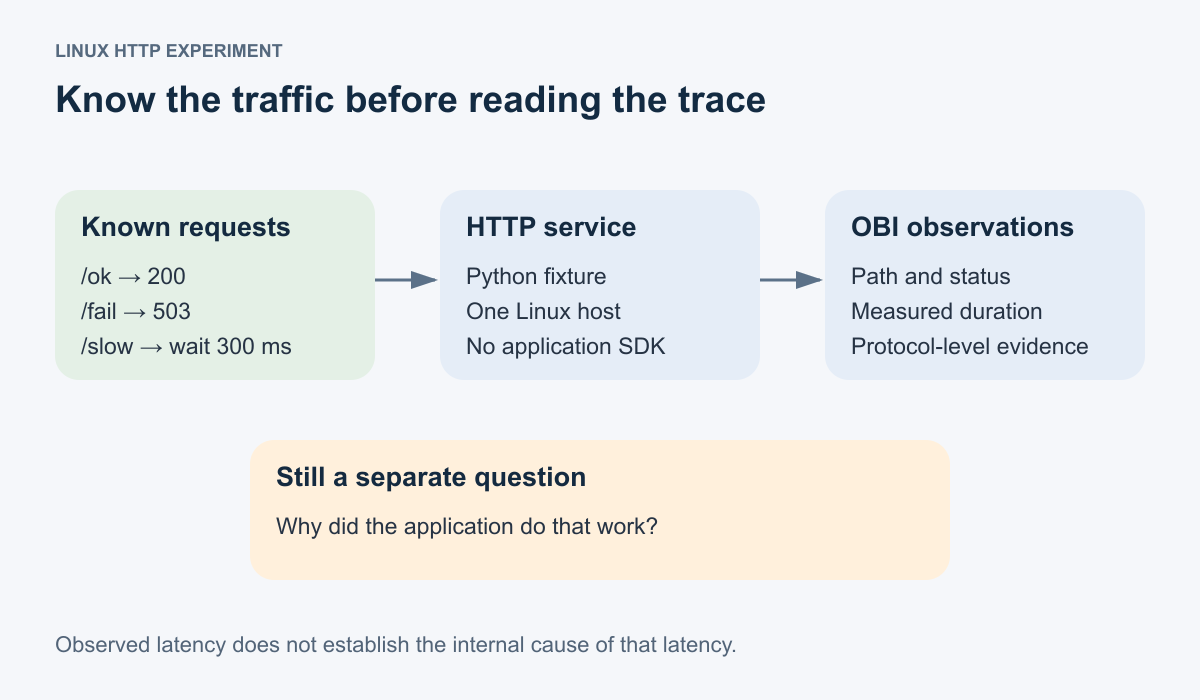
One request succeeds. One deliberately returns an error. A third waits before replying. If an observer can see all three, what has it actually learned about the application?
OpenTelemetry eBPF Instrumentation, or OBI, reached v1.0.0 on October 30, 2026. It offers a useful way to investigate that question without adding an SDK to the service. Start with traffic whose behavior you already know, so an attractive trace cannot become your only source of truth.
Choose a host that can do the observing
This experiment ran on a disposable Ubuntu 22.04 Linux host, kernel 5.15, x86_64, with BTF available, Python 3.10.6, and OBI v1.0.0. The downloaded OBI archive was checked against the release’s checksum file.
OBI’s platform requirements include kernel features and privileges, not just a Python package. A terminal inside a restricted container is not automatically an equivalent environment. Check the current requirements before trying the commands on your own learning host.
For this bounded test, OBI ran with elevated privileges on the disposable host. That is an experimental setup, not a recommendation to grant every monitoring agent unrestricted access to production.
Give the observer something unambiguous
Save this as server.py:
from http.server import BaseHTTPRequestHandler, HTTPServer
from time import sleep

class Handler(BaseHTTPRequestHandler):
    def do_GET(self):
        if self.path == "/slow":
            sleep(0.3)
        status = 503 if self.path == "/fail" else 200
        self.send_response(status)
        self.end_headers()
        self.wfile.write(b"fixture response\n")

HTTPServer(("127.0.0.1", 8088), Handler).serve_forever()
Run it in one terminal:
python3 server.pyAfter installing and verifying the pinned OBI release using the standalone setup guide, start the observer in a second terminal from the directory containing obi:
sudo env OTEL_EBPF_OPEN_PORT=8088 OTEL_EBPF_TRACE_PRINTER=json ./obiThis test uses the retained Config v1 environment-variable interface. The configuration reference labels that interface and links to Config v2; do not mix fields from the two formats when adapting the setup.
Wait for OBI to report that it is instrumenting the service. Then, from a third terminal, send the three requests:
for path in ok fail slow; do
  curl -s -o /dev/null \
    -w "$path status=%{http_code} seconds=%{time_total}\n" \
    "http://127.0.0.1:8088/$path"
done
Compare observations with the fixture
OBI emitted HTTP server observations for all three paths in this run:
| Path | Deliberate behavior | Observed status | Observed duration |
|---|---|---|---|
/ok |
Immediate reply | 200 | 0.436 ms |
/fail |
Explicit error response | 503 | 0.253 ms |
/slow |
Wait about 300 ms | 200 | 300.692 ms |
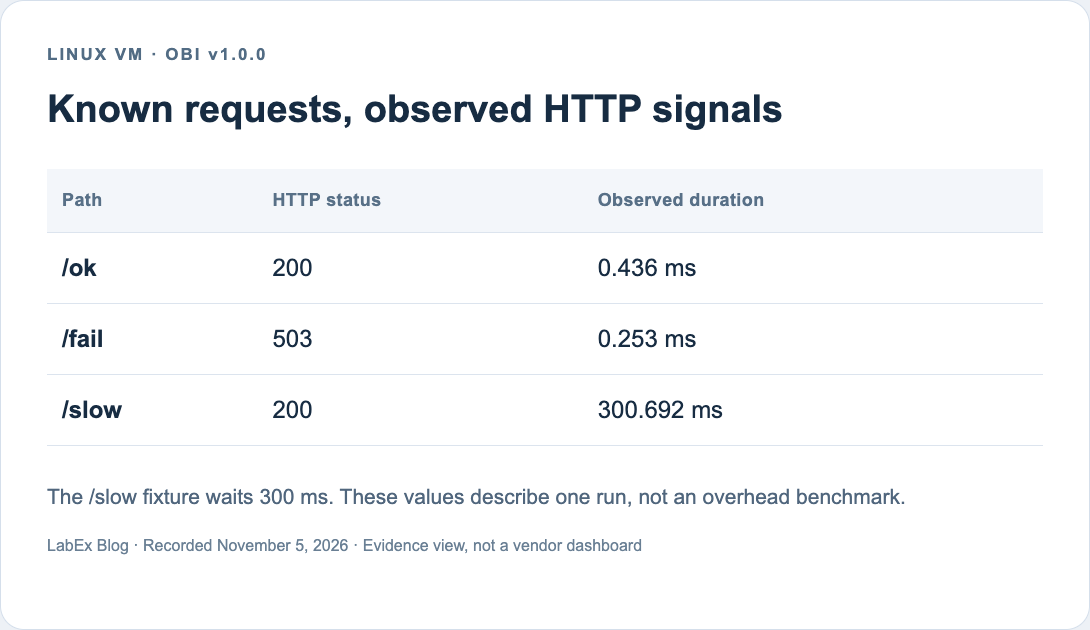
Actual OBI v1.0.0 output from November 5, 2026, reduced to the relevant fields in an evidence view. Timings are one run’s observations, not a benchmark.
The error was faster than the successful slow request. A short duration therefore did not mean the request succeeded. Equally, a 200 response did not explain what work happened inside the service.
We know why /slow took longer because we wrote the fixture. The observed duration alone does not establish that a real application’s delay came from a database, a lock, a remote service, or deliberate waiting.
Keep the missing question visible
Automatic protocol observations are a useful starting point. Application-specific operations, business events, and custom attributes can still require language-level or manual instrumentation. This experiment does not test distributed propagation, encrypted cross-service calls, or production overhead.
For a reader learning monitoring from the ground up, LabEx’s Node Exporter activity provides a complementary view of host metrics. It is prerequisite practice, not an OBI lab. Keep the question attached to the signal: host resource use, request behavior, and application meaning are different things to investigate.
Stop OBI and the Python server with Ctrl+C in their respective terminals, then remove the disposable environment. Keep the request list beside the observed output; that pair is the evidence worth saving.
References
- OBI v1.0.0: release and configuration context.
- OBI overview: platform requirements and limitations.
- Standalone setup: release artifacts and checksum verification.
- Config v1 options: the environment variables used in this experiment. Sources checked November 5, 2026.