소개
데이터 시각화를 생성할 때, 주석을 추가하면 시청자의 플롯 이해도를 크게 향상시킬 수 있습니다. 텍스트 상자는 시각화 내에 추가 정보를 직접 포함하는 효과적인 방법입니다. 정적, 애니메이션 및 대화형 시각화를 생성하기 위한 인기 있는 Python 라이브러리인 Matplotlib 은 플롯에 사용자 정의 가능한 텍스트 상자를 추가하기 위한 강력한 도구를 제공합니다.
이 Lab 에서는 Python 을 사용하여 Matplotlib 플롯에 텍스트 상자를 배치하는 방법을 배우게 됩니다. 데이터 스케일 변경과 관계없이 텍스트를 플롯에 상대적으로 고정된 위치에 유지하는 축 좌표에서 텍스트를 배치하는 방법을 알게 됩니다. 또한 bbox 속성을 사용하여 다양한 스타일, 색상 및 투명도 수준으로 텍스트 상자를 사용자 정의하는 방법을 배우게 됩니다.
이 Lab 이 끝나면 데이터 시각화 프로젝트를 위해 전략적으로 배치된 주석을 사용하여 유익하고 시각적으로 매력적인 플롯을 만들 수 있습니다.
VM 팁
VM 시작이 완료되면 왼쪽 상단 모서리를 클릭하여 Notebook 탭으로 전환하여 실습을 위한 Jupyter Notebook 에 액세스하십시오.
Jupyter Notebook 이 로딩을 완료하는 데 몇 초 정도 기다려야 할 수 있습니다. Jupyter Notebook 의 제한 사항으로 인해 작업의 유효성 검사는 자동화할 수 없습니다.
Lab 중에 문제가 발생하면 언제든지 Labby 에게 도움을 요청하십시오. Lab 경험을 개선하는 데 도움이 되도록 세션 후 피드백을 보내주시면 감사하겠습니다.
Jupyter Notebook 생성 및 데이터 준비
이 첫 번째 단계에서는 새로운 Jupyter Notebook 을 생성하고 시각화를 위한 데이터를 설정합니다.
새로운 Notebook 생성
Notebook 의 첫 번째 셀에서 필요한 라이브러리를 가져오겠습니다. 다음 코드를 입력하고 "Run" 버튼을 클릭하거나 Shift+Enter 를 눌러 실행합니다.
import matplotlib.pyplot as plt
import numpy as np
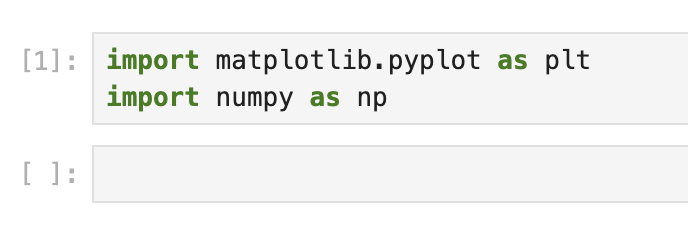
이 코드는 두 가지 필수 라이브러리를 가져옵니다.
matplotlib.pyplot: matplotlib 을 MATLAB 처럼 작동하게 해주는 함수의 모음numpy: Python 에서 과학적 계산을 위한 기본 패키지
샘플 데이터 생성
이제 시각화할 샘플 데이터를 생성해 보겠습니다. 새 셀에 다음 코드를 입력하고 실행합니다.
## Set a random seed for reproducibility
np.random.seed(19680801)

## Generate 10,000 random numbers from a normal distribution
x = 30 * np.random.randn(10000)

## Calculate basic statistics
mu = x.mean()
median = np.median(x)
sigma = x.std()

## Display the statistics
print(f"Mean (μ): {mu:.2f}")
print(f"Median: {median:.2f}")
print(f"Standard Deviation (σ): {sigma:.2f}")
이 셀을 실행하면 다음과 유사한 출력이 표시됩니다.
Mean (μ): -0.31
Median: -0.28
Standard Deviation (σ): 29.86
정확한 값은 약간 다를 수 있습니다. 정규 분포에서 생성된 10,000 개의 난수로 데이터 세트를 생성하고 세 가지 중요한 통계를 계산했습니다.
- 평균 (μ): 모든 데이터 포인트의 평균값
- 중앙값: 데이터를 정렬했을 때 중간값
- 표준 편차 (σ): 데이터가 얼마나 퍼져 있는지 측정하는 척도
이러한 통계는 나중에 시각화에 주석을 추가하는 데 사용됩니다.
기본 히스토그램 생성
이제 데이터를 확보했으므로, 분포를 시각화하기 위해 히스토그램을 생성해 보겠습니다. 히스토그램은 데이터를 빈 (bin, 범위) 으로 나누고 각 빈 내의 데이터 포인트 빈도를 표시합니다.
히스토그램 생성
Jupyter Notebook 의 새 셀에 다음 코드를 입력하고 실행합니다.
## Create a figure and axes
fig, ax = plt.subplots(figsize=(10, 6))

## Create a histogram with 50 bins
histogram = ax.hist(x, bins=50, color='skyblue', edgecolor='black')

## Add title and labels
ax.set_title('Distribution of Random Data', fontsize=16)
ax.set_xlabel('Value', fontsize=12)
ax.set_ylabel('Frequency', fontsize=12)

## Display the plot
plt.tight_layout()
plt.show()
이 셀을 실행하면 무작위 데이터의 분포를 표시하는 히스토그램이 표시됩니다. 출력은 0 근처에 중심을 둔 종 모양 곡선 (정규 분포) 처럼 보일 것입니다.
코드 이해
코드의 각 줄이 수행하는 작업을 자세히 살펴보겠습니다.
fig, ax = plt.subplots(figsize=(10, 6)): figure 및 axes 객체를 생성합니다.figsize매개변수는 플롯의 크기를 인치 단위로 설정합니다 (너비, 높이).histogram = ax.hist(x, bins=50, color='skyblue', edgecolor='black'): 50 개의 빈으로 데이터x의 히스토그램을 생성합니다. 빈은 하늘색으로 칠해지고 검은색 테두리가 있습니다.ax.set_title('Distribution of Random Data', fontsize=16): 글꼴 크기가 16 인 플롯에 제목을 추가합니다.ax.set_xlabel('Value', fontsize=12)및ax.set_ylabel('Frequency', fontsize=12): 글꼴 크기가 12 인 x 및 y 축에 레이블을 추가합니다.plt.tight_layout(): 플롯이 figure 영역에 맞게 자동으로 조정됩니다.plt.show(): 플롯을 표시합니다.
히스토그램은 데이터가 어떻게 분포되어 있는지 보여줍니다. 정규 분포에서 데이터를 생성하는 np.random.randn()을 사용했으므로 히스토그램은 0 을 중심으로 하는 종 모양을 갖습니다. 각 막대의 높이는 해당 범위 내에 속하는 데이터 포인트의 수를 나타냅니다.
통계 정보가 있는 텍스트 상자 추가
이제 기본 히스토그램이 있으므로 데이터에 대한 통계 정보를 표시하는 텍스트 상자를 추가하여 이를 향상시켜 보겠습니다. 이렇게 하면 시각화가 보는 사람에게 더 유익해집니다.
텍스트 내용 생성
먼저 텍스트 상자 안에 들어갈 텍스트 내용을 준비해야 합니다. 새 셀에 다음 코드를 입력하고 실행합니다.
## Create a string with the statistics
textstr = '\n'.join((
    r'$\mu=%.2f$' % (mu,),           ## Mean
    r'$\mathrm{median}=%.2f$' % (median,),  ## Median
    r'$\sigma=%.2f$' % (sigma,)       ## Standard deviation
))

print("Text content for our box:")
print(textstr)
다음과 유사한 출력이 표시됩니다.
Text content for our box:
$\mu=-0.31$
$\mathrm{median}=-0.28$
$\sigma=29.86$
이 코드는 데이터의 평균, 중앙값 및 표준 편차를 포함하는 여러 줄의 문자열을 생성합니다. 이 코드의 몇 가지 흥미로운 측면을 살펴보겠습니다.
\n'.join(...)메서드는 여러 문자열을 줄 바꿈 문자로 연결합니다.- 각 문자열 앞의
r은 특수 문자를 포함할 때 유용한 "raw" 문자열로 만듭니다. $...$표기법은 matplotlib 에서 LaTeX 스타일의 수학적 서식을 사용하는 데 사용됩니다.\mu및\sigma는 그리스 문자 μ(mu) 및 σ(sigma) 에 대한 LaTeX 기호입니다.%.2f는 소수점 두 자리로 부동 소수점 숫자를 표시하는 서식 지정자입니다.
텍스트 상자 생성 및 추가
이제 히스토그램을 다시 만들고 텍스트 상자를 추가해 보겠습니다. 새 셀에 다음 코드를 입력하고 실행합니다.
## Create a new figure and axes
fig, ax = plt.subplots(figsize=(10, 6))

## Create a histogram with 50 bins
histogram = ax.hist(x, bins=50, color='skyblue', edgecolor='black')

## Add title and labels
ax.set_title('Distribution of Random Data with Statistics', fontsize=16)
ax.set_xlabel('Value', fontsize=12)
ax.set_ylabel('Frequency', fontsize=12)

## Define the properties of the text box
properties = dict(boxstyle='round', facecolor='wheat', alpha=0.5)

## Add the text box to the plot
## Position the box in the top left corner (0.05, 0.95) in axes coordinates
ax.text(0.05, 0.95, textstr, transform=ax.transAxes, fontsize=14,
        verticalalignment='top', bbox=properties)

## Display the plot
plt.tight_layout()
plt.show()
이 셀을 실행하면 통계 정보가 표시된 텍스트 상자가 왼쪽 상단 모서리에 있는 히스토그램이 표시됩니다.
텍스트 상자 코드 이해
텍스트 상자를 생성하는 코드의 중요한 부분을 자세히 살펴보겠습니다.
properties = dict(boxstyle='round', facecolor='wheat', alpha=0.5):- 텍스트 상자 속성이 있는 사전을 생성합니다.
boxstyle='round': 상자에 둥근 모서리가 있도록 합니다.facecolor='wheat': 상자의 배경색을 밀색으로 설정합니다.alpha=0.5: 상자를 반투명하게 만듭니다 (50% 불투명도).
ax.text(0.05, 0.95, textstr, transform=ax.transAxes, fontsize=14, verticalalignment='top', bbox=properties):- (0.05, 0.95) 위치에 축에 텍스트를 추가합니다.
transform=ax.transAxes: 이것은 중요합니다. 즉, 좌표가 데이터 단위가 아닌 축 단위 (0-1) 로 표시된다는 의미입니다. 따라서 (0.05, 0.95) 는 "플롯의 왼쪽 가장자리에서 5% 및 하단 가장자리에서 95%"를 의미합니다.fontsize=14: 글꼴 크기를 설정합니다.verticalalignment='top': 텍스트의 맨 위가 지정된 y 좌표에 오도록 텍스트를 정렬합니다.bbox=properties: 텍스트 상자 속성을 적용합니다.
텍스트 상자는 플롯을 확대하거나 데이터 범위를 변경하더라도 플롯 축을 기준으로 동일한 위치에 유지됩니다. 이는 transform=ax.transAxes를 사용하여 데이터 좌표 대신 축 좌표를 사용했기 때문입니다.
텍스트 상자 사용자 정의
이제 플롯에 텍스트 상자를 성공적으로 추가했으므로 시각적으로 더 매력적이고 다양한 상황에 적합하도록 다양한 사용자 정의 옵션을 살펴보겠습니다.
다양한 스타일 실험
다양한 텍스트 상자 스타일을 더 쉽게 실험할 수 있도록 함수를 만들어 보겠습니다. 새 셀에 다음 코드를 입력하고 실행합니다.
def plot_with_textbox(boxstyle, facecolor, alpha, position=(0.05, 0.95)):
    """
    Create a histogram with a custom text box.

    Parameters:
    boxstyle (str): Style of the box ('round', 'square', 'round4', etc.)
    facecolor (str): Background color of the box
    alpha (float): Transparency of the box (0-1)
    position (tuple): Position of the box in axes coordinates (x, y)
    """
    ## Create figure and plot
    fig, ax = plt.subplots(figsize=(8, 5))
    ax.hist(x, bins=50, color='skyblue', edgecolor='black')

    ## Set title and labels
    ax.set_title(f'Text Box Style: {boxstyle}', fontsize=16)
    ax.set_xlabel('Value', fontsize=12)
    ax.set_ylabel('Frequency', fontsize=12)

    ## Create text box properties
    box_props = dict(boxstyle=boxstyle, facecolor=facecolor, alpha=alpha)

    ## Add text box
    ax.text(position[0], position[1], textstr, transform=ax.transAxes,
            fontsize=14, verticalalignment='top', bbox=box_props)

    plt.tight_layout()
    plt.show()
이제 이 함수를 사용하여 다양한 상자 스타일을 시도해 보겠습니다. 새 셀에 다음을 입력하고 실행합니다.
## Try a square box with light green color
plot_with_textbox('square', 'lightgreen', 0.7)

## Try a rounded box with light blue color
plot_with_textbox('round', 'lightblue', 0.5)

## Try a box with extra rounded corners
plot_with_textbox('round4', 'lightyellow', 0.6)

## Try a sawtooth style box
plot_with_textbox('sawtooth', 'lightcoral', 0.4)
이 셀을 실행하면 각기 다른 텍스트 상자 스타일이 있는 네 개의 서로 다른 플롯이 표시됩니다.
텍스트 상자 위치 변경
텍스트 상자의 위치는 시각화에 매우 중요할 수 있습니다. 플롯의 다른 모서리에 텍스트 상자를 배치해 보겠습니다. 새 셀에 다음을 입력하고 실행합니다.
## Create a figure with a 2x2 grid of subplots
fig, axes = plt.subplots(2, 2, figsize=(12, 10))
axes = axes.flatten()  ## Flatten to easily iterate

## Define positions for the four corners
positions = [
    (0.05, 0.95),  ## Top left
    (0.95, 0.95),  ## Top right
    (0.05, 0.05),  ## Bottom left
    (0.95, 0.05)   ## Bottom right
]

## Define alignments for each position
alignments = [
    ('top', 'left'),          ## Top left
    ('top', 'right'),         ## Top right
    ('bottom', 'left'),       ## Bottom left
    ('bottom', 'right')       ## Bottom right
]

## Corner labels
corner_labels = ['Top Left', 'Top Right', 'Bottom Left', 'Bottom Right']

## Create four plots with text boxes in different corners
for i, ax in enumerate(axes):
    ## Plot histogram
    ax.hist(x, bins=50, color='skyblue', edgecolor='black')

    ## Set title
    ax.set_title(f'Text Box in {corner_labels[i]}', fontsize=14)

    ## Create text box properties
    box_props = dict(boxstyle='round', facecolor='wheat', alpha=0.5)

    ## Add text box
    ax.text(positions[i][0], positions[i][1], textstr,
            transform=ax.transAxes, fontsize=12,
            verticalalignment=alignments[i][0],
            horizontalalignment=alignments[i][1],
            bbox=box_props)

plt.tight_layout()
plt.show()
이 코드는 각기 다른 모서리에 텍스트 상자가 있는 2x2 그리드의 히스토그램을 생성합니다.
텍스트 상자 위치 지정 이해
텍스트 상자 위치를 제어하는 몇 가지 주요 매개변수가 있습니다.
위치 좌표:
(x, y)좌표는 텍스트 상자가 배치되는 위치를 결정합니다.transform=ax.transAxes를 사용하는 경우, 이는(0, 0)이 왼쪽 하단 모서리이고(1, 1)이 오른쪽 상단 모서리인 축 좌표입니다.수직 정렬:
verticalalignment매개변수는 텍스트가 y 좌표를 기준으로 수직으로 정렬되는 방식을 제어합니다.'top': 텍스트의 맨 위가 지정된 y 좌표에 있습니다.'center': 텍스트의 중심이 지정된 y 좌표에 있습니다.'bottom': 텍스트의 맨 아래가 지정된 y 좌표에 있습니다.
수평 정렬:
horizontalalignment매개변수는 텍스트가 x 좌표를 기준으로 수평으로 정렬되는 방식을 제어합니다.'left': 텍스트의 왼쪽 가장자리가 지정된 x 좌표에 있습니다.'center': 텍스트의 중심이 지정된 x 좌표에 있습니다.'right': 텍스트의 오른쪽 가장자리가 지정된 x 좌표에 있습니다.
이러한 정렬 옵션은 모서리에 텍스트를 배치할 때 특히 중요합니다. 예를 들어, 오른쪽 상단 모서리에서는 horizontalalignment='right'를 사용하여 텍스트의 오른쪽 가장자리가 플롯의 오른쪽 가장자리에 정렬되도록 합니다.
여러 텍스트 요소를 사용하여 최종 시각화 생성
이 마지막 단계에서는 배운 모든 것을 결합하여 다양한 스타일의 여러 텍스트 요소를 포함하는 포괄적인 시각화를 생성합니다. 이는 텍스트 상자를 사용하여 데이터 스토리텔링을 향상시키는 방법을 보여줍니다.
고급 시각화 생성
히스토그램과 몇 가지 추가 시각적 요소를 모두 포함하는 더 정교한 플롯을 만들어 보겠습니다. 새 셀에 다음 코드를 입력하고 실행합니다.
## Create a figure with a larger size for our final visualization
fig, ax = plt.subplots(figsize=(12, 8))

## Plot the histogram with more bins and a different color
n, bins, patches = ax.hist(x, bins=75, color='lightblue',
                           edgecolor='darkblue', alpha=0.7)

## Add title and labels with improved styling
ax.set_title('Distribution of Random Data with Statistical Annotations',
             fontsize=18, fontweight='bold', pad=20)
ax.set_xlabel('Value', fontsize=14)
ax.set_ylabel('Frequency', fontsize=14)

## Add grid for better readability
ax.grid(True, linestyle='--', alpha=0.7)

## Mark the mean with a vertical line
ax.axvline(x=mu, color='red', linestyle='-', linewidth=2,
           label=f'Mean: {mu:.2f}')

## Mark one standard deviation range
ax.axvline(x=mu + sigma, color='green', linestyle='--', linewidth=1.5,
           label=f'Mean + 1σ: {mu+sigma:.2f}')
ax.axvline(x=mu - sigma, color='green', linestyle='--', linewidth=1.5,
           label=f'Mean - 1σ: {mu-sigma:.2f}')

## Create a text box with statistics in the top left
stats_box_props = dict(boxstyle='round', facecolor='lightyellow',
                      alpha=0.8, edgecolor='gold', linewidth=2)

stats_text = '\n'.join((
    r'$\mathbf{Statistics:}$',
    r'$\mu=%.2f$ (mean)' % (mu,),
    r'$\mathrm{median}=%.2f$' % (median,),
    r'$\sigma=%.2f$ (std. dev.)' % (sigma,)
))

ax.text(0.05, 0.95, stats_text, transform=ax.transAxes, fontsize=14,
        verticalalignment='top', bbox=stats_box_props)

## Add an informational text box in the top right
info_box_props = dict(boxstyle='round4', facecolor='lightcyan',
                     alpha=0.8, edgecolor='deepskyblue', linewidth=2)

info_text = '\n'.join((
    r'$\mathbf{About\ Normal\ Distributions:}$',
    r'$\bullet\ 68\%\ of\ data\ within\ 1\sigma$',
    r'$\bullet\ 95\%\ of\ data\ within\ 2\sigma$',
    r'$\bullet\ 99.7\%\ of\ data\ within\ 3\sigma$'
))

ax.text(0.95, 0.95, info_text, transform=ax.transAxes, fontsize=14,
        verticalalignment='top', horizontalalignment='right',
        bbox=info_box_props)

## Add a legend
ax.legend(fontsize=12)

## Tighten the layout and show the plot
plt.tight_layout()
plt.show()
이 셀을 실행하면 다음이 포함된 포괄적인 시각화가 표시됩니다.
- 스타일이 개선된 데이터의 히스토그램
- 평균 및 표준 편차 범위를 표시하는 수직선
- 왼쪽 상단 모서리에 있는 통계 텍스트 상자
- 오른쪽 상단 모서리에 있는 정규 분포에 대한 정보 텍스트 상자
- 수직선을 설명하는 범례
고급 요소 이해
추가한 몇 가지 새로운 요소를 살펴보겠습니다.
axvline()을 사용한 수직선:- 이러한 선은 플롯에 직접 중요한 통계를 표시합니다.
label매개변수를 사용하면 이러한 선을 범례에 포함할 수 있습니다.
다양한 스타일의 여러 텍스트 상자:
- 각 텍스트 상자는 다른 목적을 수행하고 고유한 스타일을 사용합니다.
- 통계 상자는 데이터에서 계산된 값을 표시합니다.
- 정보 상자는 정규 분포에 대한 컨텍스트를 제공합니다.
향상된 서식:
- LaTeX 서식은
\mathbf{}를 사용하여 굵은 텍스트를 생성하는 데 사용됩니다. - 글머리 기호는
\bullet로 생성됩니다. - 간격은
\(백슬래시 뒤에 공백) 으로 제어됩니다.
- LaTeX 서식은
그리드 및 범례:
- 그리드는 시청자가 차트에서 값을 더 정확하게 읽는 데 도움이 됩니다.
- 범례는 색상 선의 의미를 설명합니다.
텍스트 상자 배치에 대한 최종 참고 사항
시각화에 여러 텍스트 요소를 배치할 때는 다음 사항을 고려하십시오.
- 시각적 계층 구조: 가장 중요한 정보가 가장 눈에 띄어야 합니다.
- 위치 지정: 관련 정보를 시각화의 관련 부분 근처에 배치합니다.
- 대비: 텍스트가 배경에 대해 읽을 수 있는지 확인합니다.
- 일관성: 유사한 유형의 정보에 대해 일관된 스타일을 사용합니다.
- 혼잡: 너무 많은 텍스트 요소로 시각화를 과도하게 채우지 않도록 합니다.
텍스트 상자를 신중하게 배치하고 스타일을 지정하면 정보 제공과 시각적 매력을 모두 갖춘 시각화를 만들어 데이터에서 주요 통찰력을 이해하도록 시청자를 안내할 수 있습니다.
요약
이 랩에서는 Matplotlib 에서 텍스트 상자를 효과적으로 사용하여 데이터 시각화를 향상시키는 방법을 배웠습니다. 주요 내용을 다시 살펴보겠습니다.
다룬 주요 개념
기본 텍스트 상자 생성:
bbox매개변수를 사용하여matplotlib.pyplot.text()함수를 사용하여 플롯에 텍스트 상자를 추가하는 방법을 배웠습니다.텍스트 상자 위치 지정: 데이터 스케일링에 관계없이 텍스트를 고정된 위치에 유지하는
transform=ax.transAxes를 사용하여 축 좌표를 사용하여 텍스트 상자의 위치를 지정하는 방법을 배웠습니다.텍스트 상자 스타일 지정: 다양한 스타일 (
boxstyle), 색상 (facecolor), 투명도 수준 (alpha) 및 테두리 속성으로 텍스트 상자를 사용자 정의하는 방법을 살펴보았습니다.텍스트 정렬:
verticalalignment및horizontalalignment를 사용하여 시각화의 다른 부분에 텍스트를 적절하게 배치하는 연습을 했습니다.LaTeX 서식: LaTeX 표기법을 활용하여 텍스트에 수학 기호와 서식을 추가했습니다.
포괄적인 시각화: 여러 텍스트 요소를 다양한 스타일로 결합하여 일관된 데이터 스토리를 전달하는 완전한 시각화를 만들었습니다.
실용적인 응용
이 랩에서 배운 기술은 다음 사항에 적용할 수 있습니다.
- 플롯에 통계 요약 추가
- 데이터의 주요 기능 레이블 지정
- 시각화 내에서 컨텍스트 또는 설명 제공
- 사용자 정의 서식으로 범례 또는 키 생성
- 중요한 결과 또는 통찰력 강조
다음 단계
Matplotlib 로 데이터 시각화 기술을 더욱 향상시키려면 다음을 살펴보세요.
- 화살표 및 주석 상자와 같은 고급 주석 기술
- Matplotlib 의 이벤트 처리를 사용한 대화형 텍스트 요소
- 다양한 글꼴 및 스타일로 텍스트 사용자 정의
- 조정된 주석으로 서브플롯 생성
- 게시를 위해 텍스트 요소로 시각화 저장
Matplotlib 에서 텍스트 주석 기술을 마스터하면 청중에게 통찰력을 효과적으로 전달하는 더 유익하고 전문적인 데이터 시각화를 만들 수 있습니다.