소개
데이터 시각화에서 로고, 워터마크 또는 기타 이미지 요소를 플롯에 추가하고 싶을 때가 있습니다. 이 튜토리얼에서는 플롯 콘텐츠 앞에 이미지를 배치하고 반투명하게 만들어 Matplotlib 플롯에 이미지를 오버레이하는 방법을 보여줍니다.
matplotlib.figure.Figure 클래스의 figimage 메서드를 사용하여 플롯에 이미지를 배치하는 방법과 matplotlib.image 모듈의 imread 메서드를 사용하여 이미지 데이터를 로드하는 방법을 배우게 됩니다.
이 튜토리얼을 마치면 브랜딩, 워터마킹 또는 데이터 프레젠테이션의 시각적 매력을 향상시키는 데 유용한 사용자 정의 이미지 오버레이를 사용하여 전문적인 모습의 시각화를 만들 수 있습니다.
VM 팁
VM 시작이 완료되면 왼쪽 상단을 클릭하여 Notebook 탭으로 전환하여 실습을 위한 Jupyter Notebook 에 액세스하십시오.
 때로는 Jupyter Notebook 이 로딩을 완료하는 데 몇 초 정도 기다려야 할 수 있습니다. Jupyter Notebook 의 제한으로 인해 작업의 유효성 검사는 자동화할 수 없습니다.
학습 중에 문제가 발생하면 Labby 에게 문의하십시오. 세션 후 피드백을 제공하면 문제를 즉시 해결해 드리겠습니다.
Jupyter Notebook 생성 및 필수 라이브러리 가져오기
노트북의 첫 번째 셀에 다음 코드를 입력하여 필요한 라이브러리를 가져옵니다.
import matplotlib.pyplot as plt
import numpy as np
import matplotlib.cbook as cbook
import matplotlib.image as image
각 라이브러리가 수행하는 작업을 이해해 보겠습니다.
matplotlib.pyplot(별칭plt): matplotlib 을 MATLAB 처럼 작동하게 해주는 함수의 모음으로, 플롯을 생성하기 위한 편리한 인터페이스를 제공합니다.numpy(별칭np): Python 에서 과학적 계산을 위한 기본 패키지로, 데이터 조작에 사용합니다.matplotlib.cbook: 샘플 데이터를 가져오는 함수를 포함하여 matplotlib 에 대한 유틸리티 함수의 모음입니다.matplotlib.image: matplotlib 에서 이미지 관련 기능을 위한 모듈로, 이미지를 읽고 표시하는 데 사용합니다.
노트북 상단의 "Run" 버튼을 클릭하거나 Shift+Enter 를 눌러 셀을 실행합니다.
이 셀 실행은 모든 라이브러리가 성공적으로 가져와졌음을 나타내며, 어떤 출력도 없이 완료되어야 합니다.
이미지 로드 및 검사
이제 라이브러리를 가져왔으므로 플롯에 오버레이할 이미지를 로드해야 합니다. Matplotlib 은 연습에 사용할 수 있는 몇 가지 샘플 이미지를 제공합니다.
- 노트북에 새 셀을 만들고 다음 코드를 입력합니다.
## Load the sample image
with cbook.get_sample_data('logo2.png') as file:
    im = image.imread(file)

## Display information about the image
print(f"Image shape: {im.shape}")
print(f"Image data type: {im.dtype}")

## Display the image
plt.figure(figsize=(4, 4))
plt.imshow(im)
plt.axis('off')  ## Hide axis
plt.title('Matplotlib Logo')
plt.show()
이 코드는 다음을 수행합니다.
cbook.get_sample_data()를 사용하여 Matplotlib 의 샘플 데이터 컬렉션에서 'logo2.png'라는 샘플 이미지를 로드합니다.image.imread()를 사용하여 이미지 파일을 NumPy 배열로 읽습니다.- 이미지 치수 및 데이터 유형에 대한 정보를 출력합니다.
- 그림을 만들고
plt.imshow()를 사용하여 이미지를 표시합니다. plt.axis('off')로 축 눈금과 레이블을 숨깁니다.- 그림에 제목을 추가합니다.
plt.show()를 사용하여 그림을 표시합니다.
- Shift+Enter 를 눌러 셀을 실행합니다.
출력은 이미지에 대한 정보를 표시하고 Matplotlib 로고를 표시해야 합니다. 이미지 모양은 이미지의 치수 (높이, 너비, 색상 채널) 를 나타내고 데이터 유형은 이미지 데이터가 저장되는 방식을 알려줍니다.
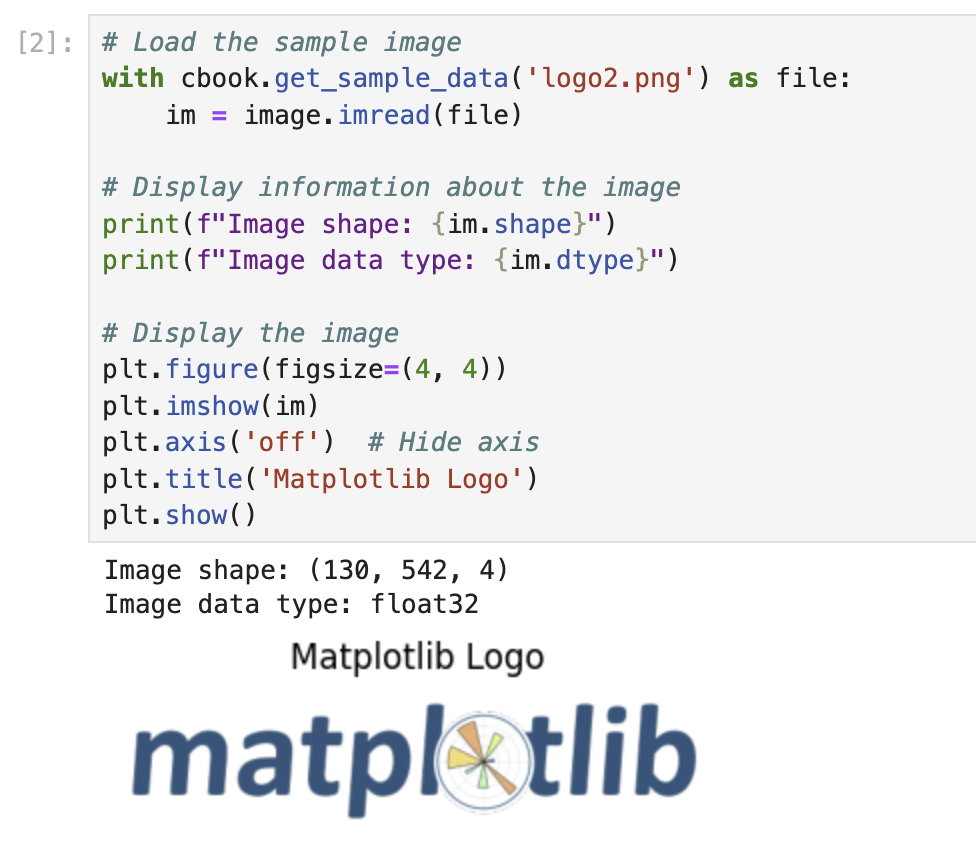
이 단계는 오버레이로 사용할 이미지를 이해하는 데 도움이 되므로 중요합니다. 모양과 치수를 볼 수 있으며, 이는 플롯에 이미지를 배치하는 방법을 결정할 때 유용합니다.
임의 데이터를 사용한 기본 플롯 생성
이미지 오버레이를 추가하기 전에 시각화의 기반이 될 플롯을 만들어야 합니다. 임의 데이터를 사용하여 간단한 막대 차트를 만들어 보겠습니다.
- 노트북에 새 셀을 만들고 다음 코드를 입력합니다.
## Create a figure and axes for our plot
fig, ax = plt.subplots(figsize=(10, 6))

## Set a random seed for reproducibility
np.random.seed(19680801)

## Generate random data
x = np.arange(30)  ## x-axis values (0 to 29)
y = x + np.random.randn(30)  ## y-axis values (x plus random noise)

## Create a bar chart
bars = ax.bar(x, y, color='#6bbc6b')  ## Green bars

## Add grid lines
ax.grid(linestyle='--', alpha=0.7)

## Add labels and title
ax.set_xlabel('X-axis Label')
ax.set_ylabel('Y-axis Label')
ax.set_title('Bar Chart with Random Data')

## Display the plot
plt.tight_layout()
plt.show()
이 코드는 다음을 수행합니다.
plt.subplots()를 사용하여 특정 크기의 figure 와 axes 를 생성합니다.- 코드를 실행할 때마다 동일한 임의 값을 얻을 수 있도록 임의 시드를 설정합니다.
- 30 개의 x 값 (0 에서 29 까지) 과 해당 y 값 (x + 임의 노이즈) 을 생성합니다.
ax.bar()를 사용하여 녹색 막대가 있는 막대 차트를 생성합니다.ax.grid()를 사용하여 플롯에 격자선을 추가합니다.- x 축, y 축 레이블과 플롯 제목을 추가합니다.
plt.tight_layout()을 사용하여 모양을 개선하기 위해 간격을 조정합니다.plt.show()를 사용하여 플롯을 표시합니다.
- Shift+Enter 를 눌러 셀을 실행합니다.
출력은 임의 데이터를 나타내는 녹색 막대가 있는 막대 차트를 표시해야 합니다. x 축은 0 에서 29 까지의 정수를 표시하고 y 축은 임의 노이즈가 추가된 해당 값을 표시합니다.
이 플롯은 다음 단계에서 이미지를 오버레이할 기반이 됩니다. figure 객체를 변수 fig에, axes 객체를 변수 ax에 저장했음을 확인하십시오. 이미지 오버레이를 추가하려면 이러한 변수가 필요합니다.
플롯에 이미지 오버레이
이제 기본 플롯을 만들었으므로 이미지를 오버레이해 보겠습니다. figimage 메서드를 사용하여 그림에 이미지를 추가하고, 아래의 플롯이 계속 보이도록 반투명하게 만들 것입니다.
- 노트북에 새 셀을 만들고 다음 코드를 입력합니다.
## Create a figure and axes for our plot (same as before)
fig, ax = plt.subplots(figsize=(10, 6))

## Set a random seed for reproducibility
np.random.seed(19680801)

## Generate random data
x = np.arange(30)  ## x-axis values (0 to 29)
y = x + np.random.randn(30)  ## y-axis values (x plus random noise)

## Create a bar chart
bars = ax.bar(x, y, color='#6bbc6b')  ## Green bars

## Add grid lines
ax.grid(linestyle='--', alpha=0.7)

## Add labels and title
ax.set_xlabel('X-axis Label')
ax.set_ylabel('Y-axis Label')
ax.set_title('Bar Chart with Image Overlay')

## Load the image
with cbook.get_sample_data('logo2.png') as file:
    im = image.imread(file)

## Overlay the image on the plot
## Parameters:
## - im: the image data
## - 25, 25: x and y position in pixels from the bottom left
## - zorder=3: controls the drawing order (higher numbers are drawn on top)
## - alpha=0.5: controls the transparency (0 = transparent, 1 = opaque)
fig.figimage(im, 25, 25, zorder=3, alpha=0.5)

## Display the plot
plt.tight_layout()
plt.show()
이 코드는 이전 단계에서 수행한 작업을 결합하고 figimage 메서드를 추가하여 플롯에 이미지를 오버레이합니다. figimage 매개변수에 대한 설명은 다음과 같습니다.
im: NumPy 배열로 된 이미지 데이터.25, 25: 그림의 왼쪽 하단 모서리에서 픽셀 단위의 x 및 y 위치.zorder=3: 그리기 순서를 제어합니다. 숫자가 높을수록 숫자가 낮은 요소 위에 그려집니다.alpha=0.5: 이미지의 투명도를 제어합니다. 값 0 은 완전히 투명하고 1 은 완전히 불투명합니다.
- Shift+Enter 를 눌러 셀을 실행합니다.
출력은 이전과 동일한 막대 차트를 표시하지만 이제 Matplotlib 로고가 왼쪽 하단 모서리에 오버레이됩니다. 로고는 반투명하여 아래의 플롯이 계속 보이도록 합니다.
- 다양한 위치와 투명도 수준을 실험해 보겠습니다. 새 셀을 만들고 다음 코드를 입력합니다.
## Create a figure and axes for our plot
fig, ax = plt.subplots(figsize=(10, 6))

## Set a random seed for reproducibility
np.random.seed(19680801)

## Generate random data
x = np.arange(30)
y = x + np.random.randn(30)

## Create a bar chart
bars = ax.bar(x, y, color='#6bbc6b')
ax.grid(linestyle='--', alpha=0.7)
ax.set_xlabel('X-axis Label')
ax.set_ylabel('Y-axis Label')
ax.set_title('Bar Chart with Centered Image Overlay')

## Load the image
with cbook.get_sample_data('logo2.png') as file:
    im = image.imread(file)

## Get figure dimensions
fig_width, fig_height = fig.get_size_inches() * fig.dpi

## Calculate center position (this is approximate)
x_center = fig_width / 2 - im.shape[1] / 2
y_center = fig_height / 2 - im.shape[0] / 2

## Overlay the image at the center with higher transparency
fig.figimage(im, x_center, y_center, zorder=3, alpha=0.3)

## Display the plot
plt.tight_layout()
plt.show()
이 코드는 이미지를 그림의 중앙에 배치하고 투명도 수준을 높여 (alpha=0.3) 워터마크로 사용하기에 더 적합하게 만듭니다.
- Shift+Enter 를 눌러 셀을 실행합니다.
출력은 이전보다 더 투명한 로고가 중앙에 배치된 막대 차트를 표시하여 워터마크 효과를 만듭니다.
이미지 오버레이를 위한 재사용 가능한 함수 생성
코드를 더 재사용 가능하게 만들기 위해, 모든 Matplotlib figure 에 이미지 오버레이를 추가할 수 있는 함수를 만들어 보겠습니다. 이렇게 하면 동일한 효과를 다양한 플롯에 쉽게 적용할 수 있습니다.
- 노트북에 새 셀을 만들고 다음 코드를 입력합니다.
def add_image_overlay(fig, image_path, x_pos=25, y_pos=25, alpha=0.5, zorder=3):
    """
    Add an image overlay to a matplotlib figure.

    Parameters:
    -----------
    fig : matplotlib.figure.Figure
        The figure to add the image to
    image_path : str
        Path to the image file
    x_pos : int
        X position in pixels from the bottom left
    y_pos : int
        Y position in pixels from the bottom left
    alpha : float
        Transparency level (0 to 1)
    zorder : int
        Drawing order (higher numbers are drawn on top)

    Returns:
    --------
    fig : matplotlib.figure.Figure
        The figure with the image overlay
    """
    ## Load the image
    with cbook.get_sample_data(image_path) as file:
        im = image.imread(file)

    ## Add the image to the figure
    fig.figimage(im, x_pos, y_pos, zorder=zorder, alpha=alpha)

    return fig

## Example usage: Create a scatter plot with an image overlay
fig, ax = plt.subplots(figsize=(10, 6))

## Set a random seed for reproducibility
np.random.seed(19680801)

## Generate random data for a scatter plot
x = np.random.rand(50) * 10
y = np.random.rand(50) * 10

## Create a scatter plot
ax.scatter(x, y, s=100, c=np.random.rand(50), cmap='viridis', alpha=0.7)
ax.grid(linestyle='--', alpha=0.7)
ax.set_xlabel('X-axis Label')
ax.set_ylabel('Y-axis Label')
ax.set_title('Scatter Plot with Image Overlay')

## Add the image overlay using our function
add_image_overlay(fig, 'logo2.png', x_pos=50, y_pos=50, alpha=0.4)

## Display the plot
plt.tight_layout()
plt.show()
이 코드는 add_image_overlay라는 함수를 정의합니다. 이 함수는 다음과 같은 기능을 수행합니다.
- figure, 이미지 경로, 위치, 투명도 및 z-order 에 대한 매개변수를 사용합니다.
- 지정된 이미지를 로드합니다.
figimage를 사용하여 이미지를 figure 에 추가합니다.- 수정된 figure 를 반환합니다.
함수를 정의한 후, 임의 데이터를 사용하여 산점도를 만들고 Matplotlib 로고를 오버레이로 추가하여 사용법을 시연합니다.
- Shift+Enter 를 눌러 셀을 실행합니다.
출력은 임의로 배치되고 색상이 지정된 점이 있는 산점도와 40% 불투명도로 위치 (50, 50) 에 오버레이된 Matplotlib 로고를 표시해야 합니다.
- 선 그래프로 예제를 하나 더 시도해 보겠습니다. 새 셀을 만들고 다음 코드를 입력합니다.
## Example usage: Create a line plot with an image overlay
fig, ax = plt.subplots(figsize=(10, 6))

## Generate data for a line plot
x = np.linspace(0, 10, 100)
y = np.sin(x)

## Create a line plot
ax.plot(x, y, linewidth=2, color='#d62728')
ax.grid(linestyle='--', alpha=0.7)
ax.set_xlabel('X-axis Label')
ax.set_ylabel('Y-axis Label')
ax.set_title('Sine Wave with Image Overlay')
ax.set_ylim(-1.5, 1.5)

## Add the image overlay using our function
## Place it in the bottom right corner
fig_width, fig_height = fig.get_size_inches() * fig.dpi
with cbook.get_sample_data('logo2.png') as file:
    im = image.imread(file)
    x_pos = fig_width - im.shape[1] - 50  ## 50 pixels from the right edge

add_image_overlay(fig, 'logo2.png', x_pos=x_pos, y_pos=50, alpha=0.6)

## Display the plot
plt.tight_layout()
plt.show()
이 코드는 사인파를 보여주는 선 그래프를 만들고, 플롯의 오른쪽 하단 모서리에 Matplotlib 로고를 추가합니다.
- Shift+Enter 를 눌러 셀을 실행합니다.
출력은 60% 불투명도로 오른쪽 하단 모서리에 Matplotlib 로고가 오버레이된 사인파의 선 그래프를 표시해야 합니다.
이러한 예제는 add_image_overlay 함수를 사용하여 다양한 유형의 플롯에 이미지 오버레이를 쉽게 추가하여 시각화를 사용자 정의하는 데 유용한 도구임을 보여줍니다.
요약
이 튜토리얼에서는 시각화를 향상시키는 워터마크, 로고 또는 기타 시각적 요소를 만들기 위해 Matplotlib 플롯에 이미지를 오버레이하는 방법을 배웠습니다. 다음은 다룬 내용에 대한 요약입니다.
라이브러리 가져오기 (Importing Libraries): Matplotlib 플롯 및 이미지 작업을 위해 필요한 라이브러리를 가져오는 것으로 시작했습니다.
이미지 로드 및 검사 (Loading and Examining Images):
imread함수를 사용하여 이미지를 로드하고 속성을 검사하는 방법을 배웠습니다.기본 플롯 생성 (Creating Base Plots): 이미지 오버레이의 기반 역할을 하는 다양한 유형의 플롯 (막대 차트, 산점도 및 선 그래프) 을 만들었습니다.
이미지 오버레이 (Overlaying Images):
figimage메서드를 사용하여 플롯에 이미지를 배치하고 위치, 투명도 및 그리기 순서를 제어했습니다.재사용 가능한 함수 생성 (Creating a Reusable Function): 모든 Matplotlib figure 에 이미지 오버레이를 더 쉽게 추가할 수 있도록 재사용 가능한 함수를 개발했습니다.
이 튜토리얼에서 배운 기술은 다음 사항에 적용할 수 있습니다.
- 저작권 보호를 위해 플롯에 워터마크 추가
- 시각화에 브랜딩을 위한 로고 포함
- 미적으로 보기 좋은 차트를 위한 사용자 정의 배경 요소 생성
- 프레젠테이션 및 보고서를 위해 이미지와 데이터 시각화 결합
특정 요구 사항을 충족하는 독창적이고 전문적인 시각화를 만들기 위해 다양한 유형의 플롯, 이미지, 위치 및 투명도 수준을 계속 실험할 수 있습니다.