소개
이 튜토리얼에서는 Python 의 Matplotlib 라이브러리를 사용하여 x 축 눈금 레이블을 플롯 상단으로 이동하는 방법을 배웁니다. 기본적으로 Matplotlib 는 x 축 레이블을 플롯 하단에 배치합니다. 그러나 때로는 시각화를 개선하기 위해, 특히 혼잡한 플롯이나 다른 요소와 겹칠 수 있는 긴 레이블을 다룰 때 상단에 배치하고 싶을 수 있습니다.
이 기술은 공간 사용을 최적화하고 플롯의 가독성을 향상시켜야 하는 데이터 시각화 시나리오에서 특히 유용합니다. 간단한 플롯을 만들고 눈금 레이블의 위치를 단계별로 조작하는 방법을 배웁니다.
VM 팁
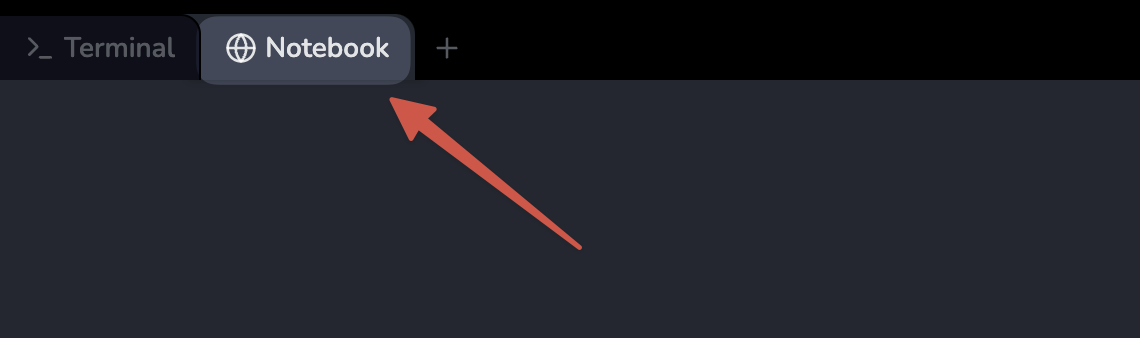
VM 시작이 완료되면 왼쪽 상단을 클릭하여 Notebook 탭으로 전환하여 실습을 위한 Jupyter Notebook 에 액세스하십시오.
Jupyter Notebook 이 로딩을 완료하는 데 몇 초 정도 걸릴 수 있습니다. Jupyter Notebook 의 제한으로 인해 작업의 유효성 검사는 자동화될 수 없습니다.
이 튜토리얼 중에 문제가 발생하면 언제든지 Labby 에게 문의하십시오. 세션 후 피드백을 제공하여 문제를 신속하게 해결할 수 있도록 해주세요.
Matplotlib 이해 및 Notebook 생성
이 첫 번째 단계에서는 Matplotlib 에 대해 배우고 시각화 작업을 위한 새로운 Jupyter Notebook 을 생성합니다.
Matplotlib 란 무엇인가요?
Matplotlib 는 Python 에서 정적, 애니메이션 및 대화형 시각화를 생성하기 위한 포괄적인 라이브러리입니다. 응용 프로그램에 플롯을 포함하기 위한 객체 지향 API 를 제공하며 과학자, 엔지니어 및 데이터 분석가들이 데이터 시각화에 널리 사용합니다.
새로운 Notebook 생성
Notebook 의 첫 번째 셀에서 Matplotlib 라이브러리를 가져오겠습니다. 다음 코드를 입력하고 Shift+Enter 를 눌러 셀을 실행합니다.
import matplotlib.pyplot as plt
import numpy as np

## Check the Matplotlib version
print(f"NumPy version: {np.__version__}")
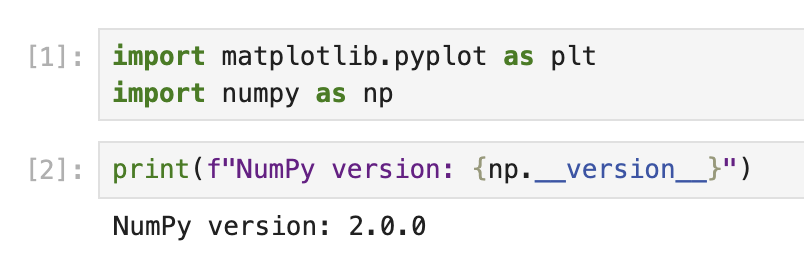
이 코드를 실행하면 다음과 유사한 출력이 표시됩니다.
NumPy version: 2.0.0
정확한 버전 번호는 환경에 따라 다를 수 있습니다.
이제 Matplotlib 를 가져와 사용할 준비가 되었습니다. plt는 플롯을 생성하기 위한 MATLAB 과 유사한 인터페이스를 제공하는 pyplot 모듈에 사용되는 일반적인 별칭입니다.
기본 설정을 사용하여 기본 플롯 생성
이제 Matplotlib 를 가져왔으므로 기본 설정을 사용하여 간단한 플롯을 생성하여 축과 눈금 레이블이 기본적으로 어떻게 배치되는지 이해해 보겠습니다.
Matplotlib 구성 요소 이해
Matplotlib 에서 플롯은 여러 구성 요소로 구성됩니다.
- Figure (그림): 플롯의 전체 컨테이너
- Axes (축): 자체 좌표계를 사용하여 데이터가 플롯되는 영역
- Axis (축): 좌표계를 정의하는 숫자선과 같은 객체
- Ticks (눈금): 특정 값을 나타내는 축의 표시
- Tick Labels (눈금 레이블): 각 눈금의 값을 나타내는 텍스트 레이블
기본적으로 x 축 눈금 레이블은 플롯 하단에 나타납니다.
간단한 플롯 생성
Notebook 의 새 셀에서 간단한 선 플롯을 생성해 보겠습니다.
## Create a figure and a set of axes
fig, ax = plt.subplots(figsize=(8, 5))

## Generate some data
x = np.arange(0, 10, 1)
y = np.sin(x)

## Plot the data
ax.plot(x, y, marker='o', linestyle='-', color='blue', label='sin(x)')

## Add a title and labels
ax.set_title('A Simple Sine Wave Plot')
ax.set_xlabel('X-axis')
ax.set_ylabel('Y-axis (sin(x))')

## Add a grid and legend
ax.grid(True, linestyle='--', alpha=0.7)
ax.legend()

## Display the plot
plt.show()

print("Notice that the x-axis tick labels are at the bottom of the plot by default.")
이 코드를 실행하면 Matplotlib 의 기본 위치인 플롯 하단에 x 축 눈금 레이블이 있는 사인파 플롯이 표시됩니다.
플롯이 어떻게 구성되어 있는지, 눈금 레이블이 어디에 배치되어 있는지 잠시 살펴보십시오. 이 이해는 다음 단계에서 변경할 사항을 이해하는 데 도움이 됩니다.
X 축 눈금 레이블을 상단으로 이동
이제 눈금 레이블의 기본 위치를 이해했으므로 x 축 눈금 레이블을 플롯 상단으로 이동해 보겠습니다.
눈금 매개변수 이해
Matplotlib 는 tick_params() 메서드를 제공하여 눈금 및 눈금 레이블의 모양을 제어합니다. 이 메서드를 사용하면 다음을 수행할 수 있습니다.
- 눈금 및 눈금 레이블 표시/숨기기
- 위치 변경 (상단, 하단, 왼쪽, 오른쪽)
- 크기, 색상 및 기타 속성 조정
X 축 눈금 레이블을 상단에 배치하여 플롯 생성
x 축 눈금 레이블을 상단으로 이동하여 새 플롯을 생성해 보겠습니다.
## Create a new figure and a set of axes
fig, ax = plt.subplots(figsize=(8, 5))

## Generate some data
x = np.arange(0, 10, 1)
y = np.cos(x)

## Plot the data
ax.plot(x, y, marker='s', linestyle='-', color='green', label='cos(x)')

## Move the x-axis tick labels to the top
ax.tick_params(
    axis='x',         ## Apply changes to the x-axis
    top=True,         ## Show ticks on the top side
    labeltop=True,    ## Show tick labels on the top side
    bottom=False,     ## Hide ticks on the bottom side
    labelbottom=False ## Hide tick labels on the bottom side
)

## Add a title and labels
ax.set_title('Cosine Wave with X-Axis Tick Labels at the Top')
ax.set_xlabel('X-axis (now at the top!)')
ax.set_ylabel('Y-axis (cos(x))')

## Add a grid and legend
ax.grid(True, linestyle='--', alpha=0.7)
ax.legend()

## Display the plot
plt.show()

print("Now the x-axis tick labels are at the top of the plot!")
이 코드를 실행하면 x 축 눈금 레이블이 플롯 상단에 있는 코사인파 플롯이 표시됩니다.
tick_params() 메서드가 여러 매개변수와 함께 어떻게 사용되는지 확인하십시오.
axis='x': x 축을 수정하려는 것을 지정합니다.top=True및labeltop=True: 상단에 눈금과 레이블을 표시합니다.bottom=False및labelbottom=False: 하단에 눈금과 레이블을 숨깁니다.
이렇게 하면 하단이 아닌 상단에 x 축 레이블이 배치된 데이터를 깔끔하게 볼 수 있습니다.
플롯 추가 사용자 정의
이제 x 축 눈금 레이블을 상단으로 이동했으므로 플롯을 더욱 시각적으로 매력적이고 유익하게 만들기 위해 추가로 사용자 정의해 보겠습니다.
고급 플롯 사용자 정의 기술
Matplotlib 는 플롯을 사용자 정의하기 위한 다양한 옵션을 제공합니다. 이러한 옵션 중 일부를 살펴보겠습니다.
## Create a new figure and a set of axes
fig, ax = plt.subplots(figsize=(10, 6))

## Generate some data with more points for a smoother curve
x = np.linspace(0, 2*np.pi, 100)
y1 = np.sin(x)
y2 = np.cos(x)

## Plot multiple datasets
ax.plot(x, y1, linewidth=2, color='blue', label='sin(x)')
ax.plot(x, y2, linewidth=2, color='red', label='cos(x)')

## Fill the area between curves
ax.fill_between(x, y1, y2, where=(y1 > y2), alpha=0.3, color='green', interpolate=True)
ax.fill_between(x, y1, y2, where=(y1 <= y2), alpha=0.3, color='purple', interpolate=True)

## Move the x-axis tick labels to the top
ax.tick_params(
    axis='x',
    top=True,
    labeltop=True,
    bottom=False,
    labelbottom=False
)

## Customize tick labels
ax.set_xticks(np.arange(0, 2*np.pi + 0.1, np.pi/2))
ax.set_xticklabels(['0', 'π/2', 'π', '3π/2', '2π'])

## Add title and labels with custom styles
ax.set_title('Sine and Cosine Functions with Customized X-Axis Labels at the Top',
             fontsize=14, fontweight='bold', pad=20)
ax.set_xlabel('Angle (radians)', fontsize=12)
ax.set_ylabel('Function Value', fontsize=12)

## Add a grid and customize its appearance
ax.grid(True, linestyle='--', alpha=0.7, which='both')

## Customize the axis limits
ax.set_ylim(-1.2, 1.2)

## Add a legend with custom location and style
ax.legend(loc='upper right', fontsize=12, framealpha=0.8)

## Add annotations to highlight important points
ax.annotate('Maximum', xy=(np.pi/2, 1), xytext=(np.pi/2, 1.1),
            arrowprops=dict(facecolor='black', shrink=0.05, width=1.5),
            fontsize=10, ha='center')

## Display the plot
plt.tight_layout()  ## Adjust spacing for better appearance
plt.show()

print("We have created a fully customized plot with x-axis tick labels at the top!")
이 코드를 실행하면 다음과 같은 훨씬 더 정교하고 전문적인 모양의 플롯이 표시됩니다.
- 두 개의 곡선 (사인 및 코사인)
- 곡선 사이의 색상 영역
- 사용자 정의 눈금 레이블 (π 표기법 사용)
- 주요 기능을 가리키는 주석
- 더 나은 간격 및 스타일 지정
tick_params() 메서드를 사용하여 x 축 눈금 레이블을 상단에 유지하면서 추가 사용자 정의로 플롯을 향상시킨 방법을 확인하십시오.
사용자 정의 이해
추가한 주요 사용자 정의 중 일부를 살펴보겠습니다.
fill_between(): 사인 및 코사인 곡선 사이에 색상 영역을 만듭니다.set_xticks()및set_xticklabels(): 눈금 위치 및 레이블을 사용자 정의합니다.tight_layout(): 더 나은 모양을 위해 플롯 간격을 자동으로 조정합니다.annotate(): 특정 지점을 가리키는 화살표와 함께 텍스트를 추가합니다.- 다양한 요소에 대한 사용자 정의 글꼴, 색상 및 스타일
이러한 사용자 정의는 x 축 눈금 레이블을 상단에 유지하면서 시각적으로 매력적이고 유익한 플롯을 만드는 방법을 보여줍니다.
플롯 저장 및 공유
마지막 단계는 사용자 정의 플롯을 저장하여 보고서, 프레젠테이션에 포함하거나 다른 사람과 공유할 수 있도록 하는 것입니다.
다양한 형식으로 플롯 저장
Matplotlib 를 사용하면 PNG, JPG, PDF, SVG 등을 포함한 다양한 형식으로 플롯을 저장할 수 있습니다. 다양한 형식으로 플롯을 저장하는 방법을 알아보겠습니다.
## Create a plot similar to our previous customized one
fig, ax = plt.subplots(figsize=(10, 6))

## Generate data
x = np.linspace(0, 2*np.pi, 100)
y1 = np.sin(x)
y2 = np.cos(x)

## Plot the data
ax.plot(x, y1, linewidth=2, color='blue', label='sin(x)')
ax.plot(x, y2, linewidth=2, color='red', label='cos(x)')

## Move the x-axis tick labels to the top
ax.tick_params(
    axis='x',
    top=True,
    labeltop=True,
    bottom=False,
    labelbottom=False
)

## Customize tick labels
ax.set_xticks(np.arange(0, 2*np.pi + 0.1, np.pi/2))
ax.set_xticklabels(['0', 'π/2', 'π', '3π/2', '2π'])

## Add title and labels
ax.set_title('Plot with X-Axis Labels at the Top', fontsize=14)
ax.set_xlabel('X-axis at the top')
ax.set_ylabel('Y-axis')

## Add grid and legend
ax.grid(True)
ax.legend()

## Save the figure in different formats
plt.savefig('plot_with_top_xlabels.png', dpi=300, bbox_inches='tight')
plt.savefig('plot_with_top_xlabels.pdf', bbox_inches='tight')
plt.savefig('plot_with_top_xlabels.svg', bbox_inches='tight')

## Show the plot
plt.show()

print("The plot has been saved in PNG, PDF, and SVG formats in the current directory.")
이 코드를 실행하면 플롯이 세 가지 다른 형식으로 저장됩니다.
- PNG: 웹 및 일반 사용에 적합한 래스터 이미지 형식
- PDF: 출판물 및 보고서에 이상적인 벡터 형식
- SVG: 웹 및 편집 가능한 그래픽에 탁월한 벡터 형식
파일은 Jupyter 노트북의 현재 작업 디렉토리에 저장됩니다.
저장 매개변수 이해
savefig()와 함께 사용된 매개변수를 살펴보겠습니다.
dpi=300: PNG 와 같은 래스터 형식의 해상도 (dots per inch) 를 설정합니다.bbox_inches='tight': 불필요한 공백 없이 모든 요소를 포함하도록 그림 경계를 자동으로 조정합니다.
저장된 파일 보기
Jupyter 에서 파일 브라우저로 이동하여 저장된 파일을 볼 수 있습니다.
- 왼쪽 상단의 "Jupyter" 로고를 클릭합니다.
- 파일 브라우저에서 저장된 이미지 파일을 볼 수 있습니다.
- 파일을 클릭하여 보거나 다운로드합니다.
추가 플롯 내보내기 옵션
저장된 플롯을 더 세밀하게 제어하려면 필요에 따라 그림 크기를 사용자 정의하거나 배경을 조정하거나 DPI 를 변경할 수 있습니다.
## Control the background color and transparency
fig.patch.set_facecolor('white')  ## Set figure background color
fig.patch.set_alpha(0.8)          ## Set background transparency

## Save with custom settings
plt.savefig('custom_background_plot.png',
            dpi=400,              ## Higher resolution
            facecolor=fig.get_facecolor(),  ## Use the figure's background color
            edgecolor='none',     ## No edge color
            bbox_inches='tight',  ## Tight layout
            pad_inches=0.1)       ## Add a small padding

print("A customized plot has been saved with specialized export settings.")
이것은 출력 형식과 모양을 정밀하게 제어하여 플롯을 저장하는 방법을 보여줍니다.
요약
이 튜토리얼에서는 Matplotlib 를 사용하여 x 축 눈금 레이블을 기본 위치인 하단에서 플롯 상단으로 이동하는 방법을 배웠습니다. 이 기술은 긴 레이블이 있는 플롯을 사용하거나 공간 사용을 최적화해야 할 때 유용할 수 있습니다.
다음 주요 사항을 다루었습니다.
- 그림, 축 및 눈금 레이블을 포함한 Matplotlib 의 기본 사항과 구성 요소 이해
- x 축 눈금 레이블의 표준 배치를 관찰하기 위해 기본 설정으로 간단한 플롯 만들기
tick_params()메서드를 사용하여 x 축 눈금 레이블을 플롯 상단으로 이동- 플롯을 추가로 사용자 정의하여 더 유익하고 시각적으로 매력적으로 만들기
- 공유 및 게시를 위해 다양한 형식으로 플롯 저장
이 지식을 통해 특히 복잡한 데이터 세트를 처리하거나 특정 레이아웃 요구 사항이 있는 플롯을 사용할 때 더 읽기 쉽고 전문적인 시각화를 만들 수 있습니다.
학습을 더 진행하려면 다음과 같은 다른 Matplotlib 사용자 정의 옵션을 탐색할 수 있습니다.
- 서로 다른 눈금 레이블 위치로 서브플롯 만들기
- 눈금 및 눈금 레이블의 모양 사용자 정의 (색상, 글꼴, 크기 등)
- 사용자 정의 눈금 위치가 있는 막대 차트, 산점도 또는 히스토그램과 같은 다양한 유형의 플롯 사용
Matplotlib 의 유연성을 통해 특정 시각화 요구 사항에 맞게 광범위한 사용자 정의가 가능합니다.