Guardar la Gráfica y Crear una Función Reutilizable
En este último paso, crearemos una función reutilizable para generar gráficas con formato de moneda y guardaremos nuestra visualización en un archivo. Este enfoque facilita aplicar el mismo formato a diferentes conjuntos de datos financieros en el futuro.
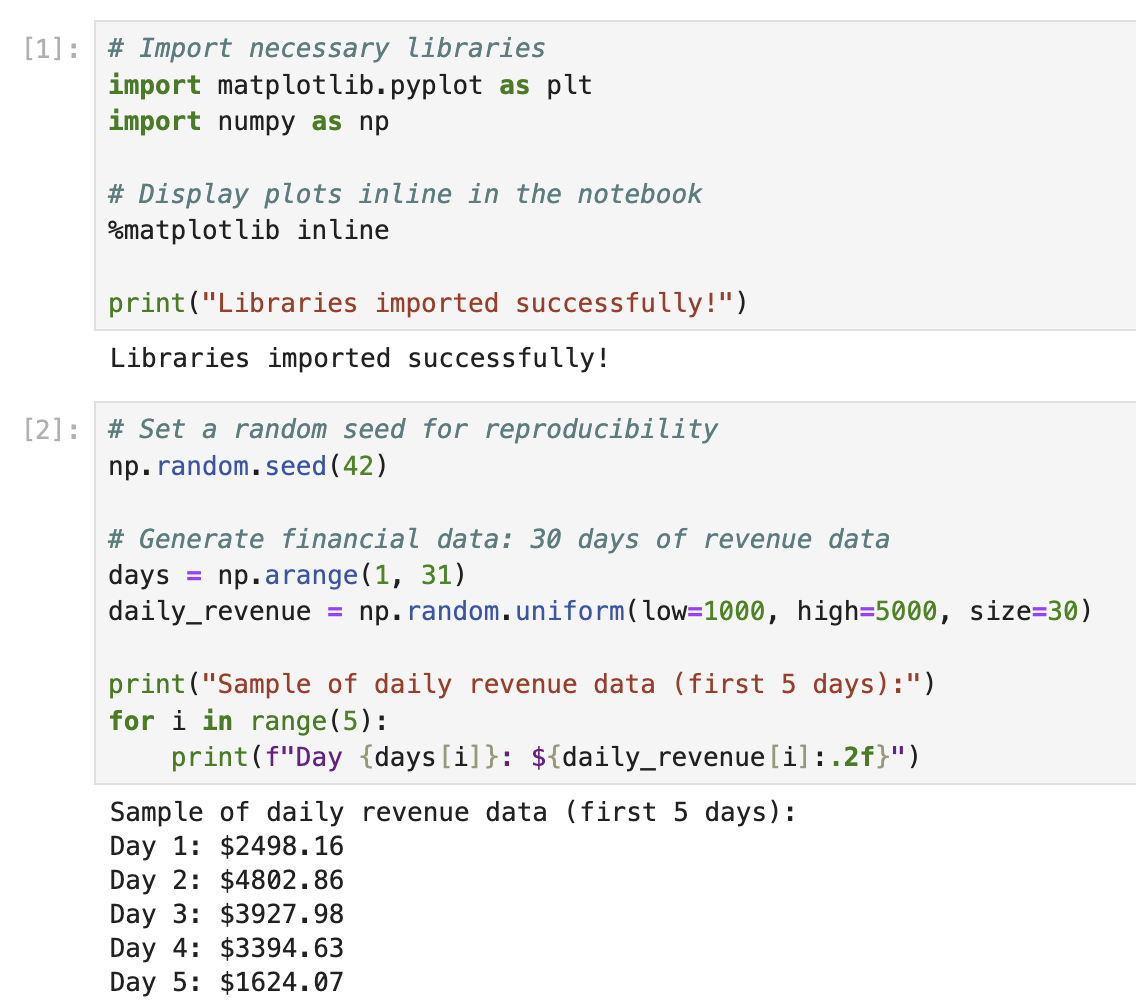
En una nueva celda de su cuaderno (notebook), agregue y ejecute el siguiente código:
def create_currency_plot(x_data, y_data, title='Financial Data',
xlabel='X-Axis', ylabel='Amount ($)',
filename=None, show_stats=True):
"""
Create a plot with currency formatting on the y-axis.
Parameters:
-----------
x_data : array-like
Data for the x-axis
y_data : array-like
Data for the y-axis (currency values)
title : str
Title of the plot
xlabel : str
Label for the x-axis
ylabel : str
Label for the y-axis
filename : str, optional
If provided, save the plot to this filename
show_stats : bool
Whether to show statistics (average, min, max)
Returns:
--------
fig, ax : tuple
The figure and axes objects
"""
## Import the necessary module for formatting
import matplotlib.ticker as ticker
## Create a figure and axes
fig, ax = plt.subplots(figsize=(12, 7))
## Plot the data
ax.plot(x_data, y_data, marker='o', linestyle='-', color='blue',
linewidth=2, markersize=6, label='Data')
if show_stats:
## Calculate statistics
avg_value = np.mean(y_data)
max_value = np.max(y_data)
min_value = np.min(y_data)
max_x = x_data[np.argmax(y_data)]
min_x = x_data[np.argmin(y_data)]
## Add a horizontal line for average value
ax.axhline(y=avg_value, color='r', linestyle='--', alpha=0.7,
label=f'Average: ${avg_value:.2f}')
## Add annotations for max and min values
ax.annotate(f'Max: ${max_value:.2f}', xy=(max_x, max_value),
xytext=(max_x+1, max_value+200),
arrowprops=dict(facecolor='black', shrink=0.05, width=1.5))
ax.annotate(f'Min: ${min_value:.2f}', xy=(min_x, min_value),
xytext=(min_x+1, min_value-200),
arrowprops=dict(facecolor='black', shrink=0.05, width=1.5))
## Format y-axis with dollar signs
formatter = ticker.StrMethodFormatter('${x:,.2f}')
ax.yaxis.set_major_formatter(formatter)
## Customize tick parameters
ax.tick_params(axis='both', which='major', labelsize=10)
## Add labels and title
ax.set_xlabel(xlabel, fontsize=12)
ax.set_ylabel(ylabel, fontsize=12)
ax.set_title(title, fontsize=14, fontweight='bold')
## Add grid for better readability
ax.grid(True, linestyle='--', alpha=0.7)
## Add legend
if show_stats:
ax.legend(loc='best', fontsize=10)
## Adjust layout
plt.tight_layout()
## Save the plot if filename is provided
if filename:
plt.savefig(filename, dpi=300, bbox_inches='tight')
print(f"Plot saved as '{filename}'")
return fig, ax
## Use our function to create and save a plot
fig, ax = create_currency_plot(
days,
daily_revenue,
title='Monthly Revenue Report',
xlabel='Day of Month',
ylabel='Daily Revenue ($)',
filename='revenue_plot.png'
)
## Display the plot
plt.show()
print("Function created and plot saved successfully!")
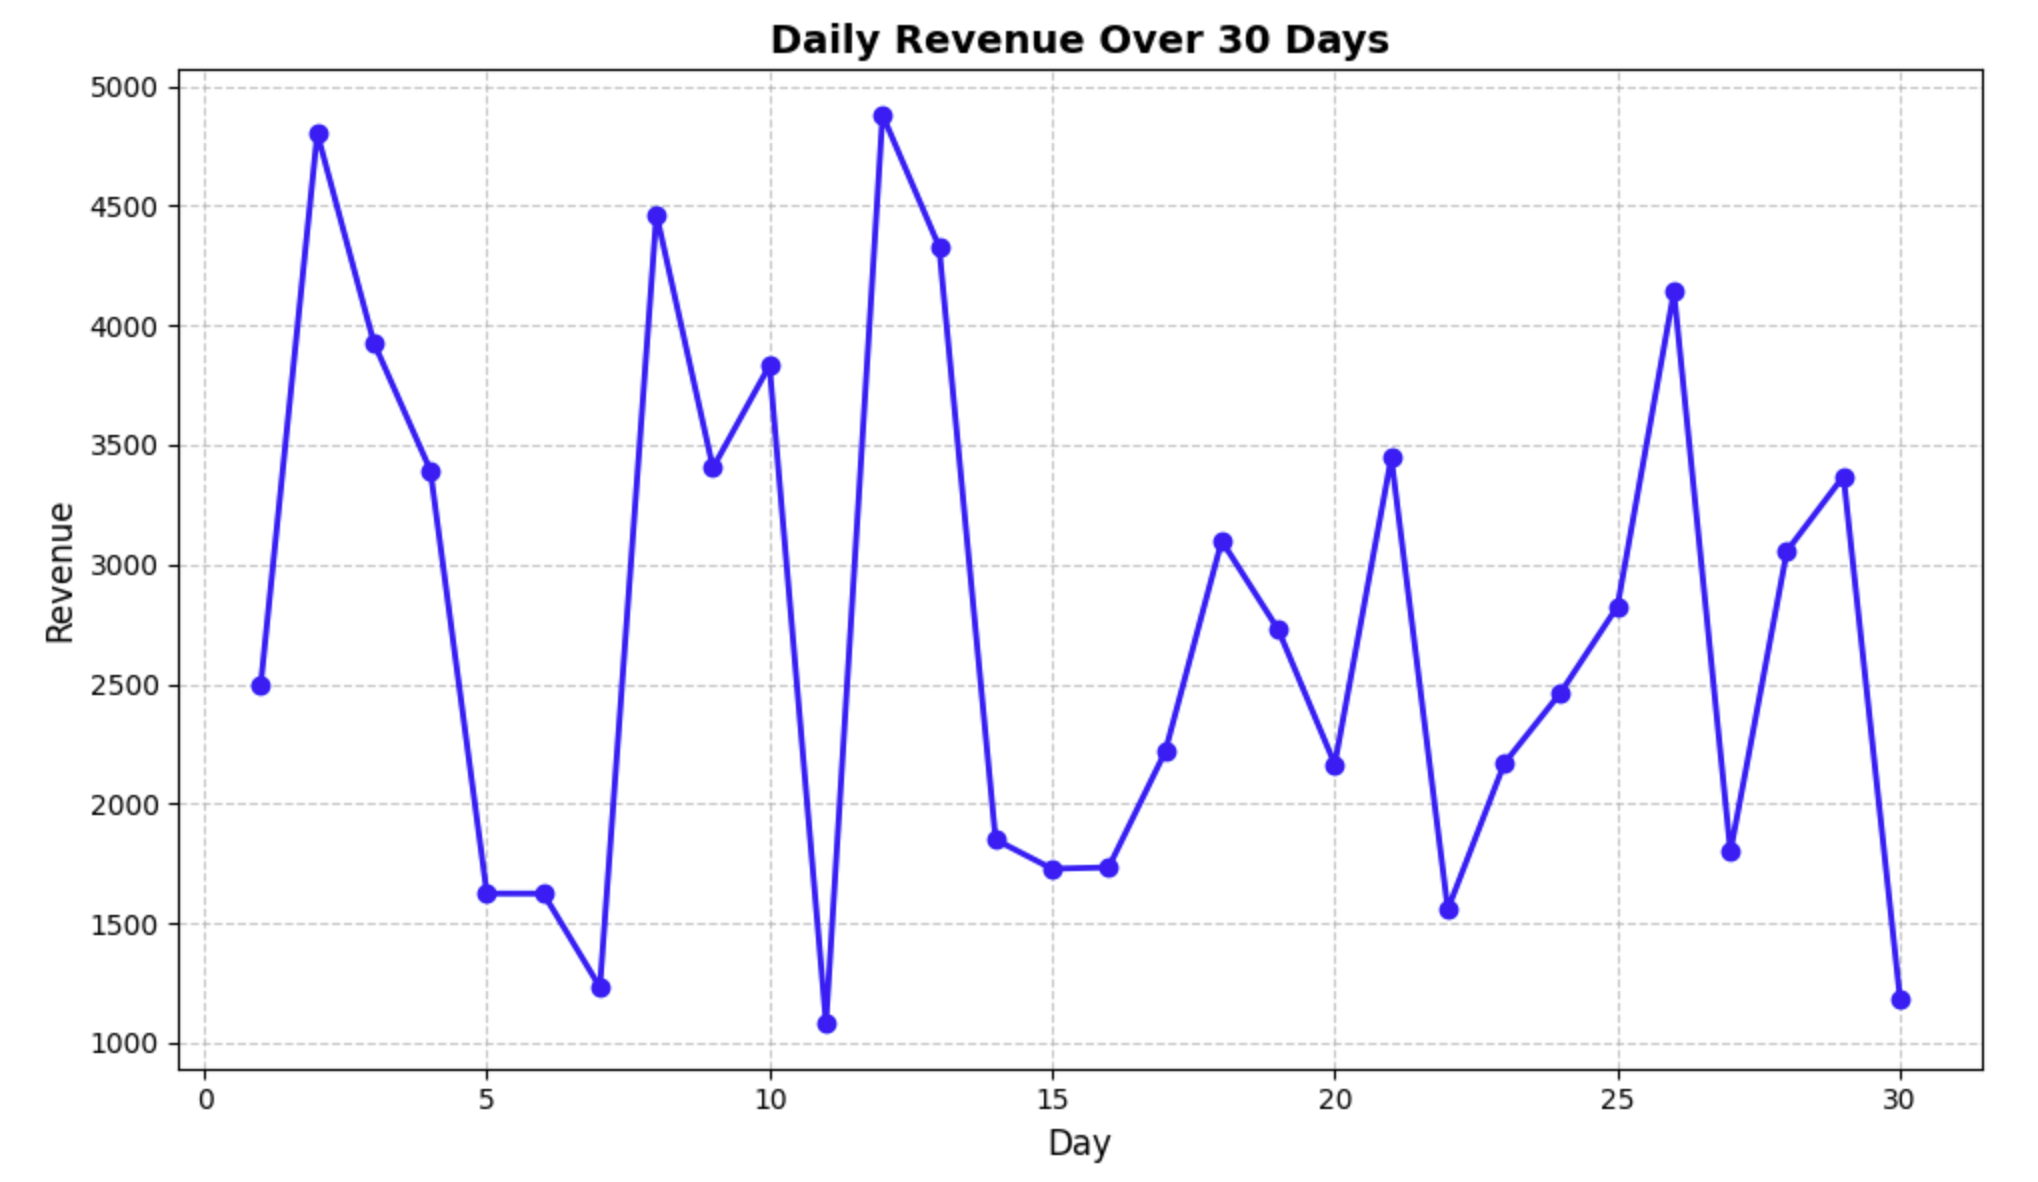
Después de ejecutar este código, debería ver:
- Una gráfica similar a la que creamos en el paso anterior, pero generada utilizando nuestra función personalizada.
- Un mensaje que confirma que la gráfica se ha guardado en un archivo llamado
revenue_plot.png.
La función que creamos:
- Toma datos para los ejes x e y.
- Permite personalizar las etiquetas y el título.
- Tiene una opción para guardar la gráfica en un archivo.
- Puede mostrar u ocultar estadísticas como el promedio, el mínimo y el máximo.
- Devuelve los objetos de la figura y los ejes para una mayor personalización si es necesario.
Esta función reutilizable facilita crear gráficas financieras con un formato consistente en el futuro. Simplemente puede llamar a esta función con diferentes conjuntos de datos, y manejará automáticamente todo el formato de moneda y las anotaciones estadísticas.
Para verificar que nuestra gráfica se haya guardado correctamente, comprobemos si el archivo existe:
import os
if os.path.exists('revenue_plot.png'):
    print("Plot file exists! Size:", os.path.getsize('revenue_plot.png'), "bytes")
else:
    print("Plot file was not saved correctly.")
Debería ver un mensaje que confirme que el archivo existe y su tamaño.
¡Felicidades! Ha aprendido con éxito cómo formatear gráficas con signos de dólar y crear visualizaciones financieras de aspecto profesional utilizando Matplotlib.