Introdução
Neste laboratório, você aprenderá como posicionar títulos em gráficos criados com Matplotlib. Os títulos dos gráficos ajudam os espectadores a entender qual informação uma visualização transmite. Matplotlib oferece várias opções para posicionar esses títulos - centralizado (o padrão), alinhado à esquerda, alinhado à direita ou com posicionamento vertical personalizado.
Ao final deste laboratório, você será capaz de:
- Criar um gráfico básico com um título centralizado
- Posicionar títulos à esquerda ou à direita de um gráfico
- Criar um gráfico com o título em uma posição personalizada
- Usar diferentes métodos para ajustar o posicionamento do título
Criação de Gráficos Básicos com Posição de Título Padrão
Nesta etapa, você criará um gráfico de linha simples e adicionará um título centralizado, que é a posição padrão no Matplotlib.
Criando um Jupyter Notebook
Após a inicialização da VM ser concluída, clique no canto superior esquerdo para mudar para a aba Notebook para acessar o Jupyter Notebook.

Você pode precisar esperar alguns segundos para que o Jupyter Notebook termine de carregar. Devido a limitações no Jupyter Notebook, a validação das operações não pode ser automatizada.
Se você encontrar algum problema durante o laboratório, sinta-se à vontade para pedir ajuda ao Labby. Por favor, forneça feedback após a sessão para que possamos resolver prontamente quaisquer problemas.
Importando Matplotlib
Agora, vamos começar importando a biblioteca Matplotlib. Na primeira célula do seu notebook, digite o seguinte código e execute-o pressionando Shift+Enter:
import matplotlib.pyplot as plt
Isso importa o módulo pyplot do Matplotlib e atribui a ele o alias plt, que é uma convenção comum.
Criando um Gráfico Simples
Em seguida, vamos criar um gráfico de linha básico. Em uma nova célula, insira o seguinte código e execute-o:
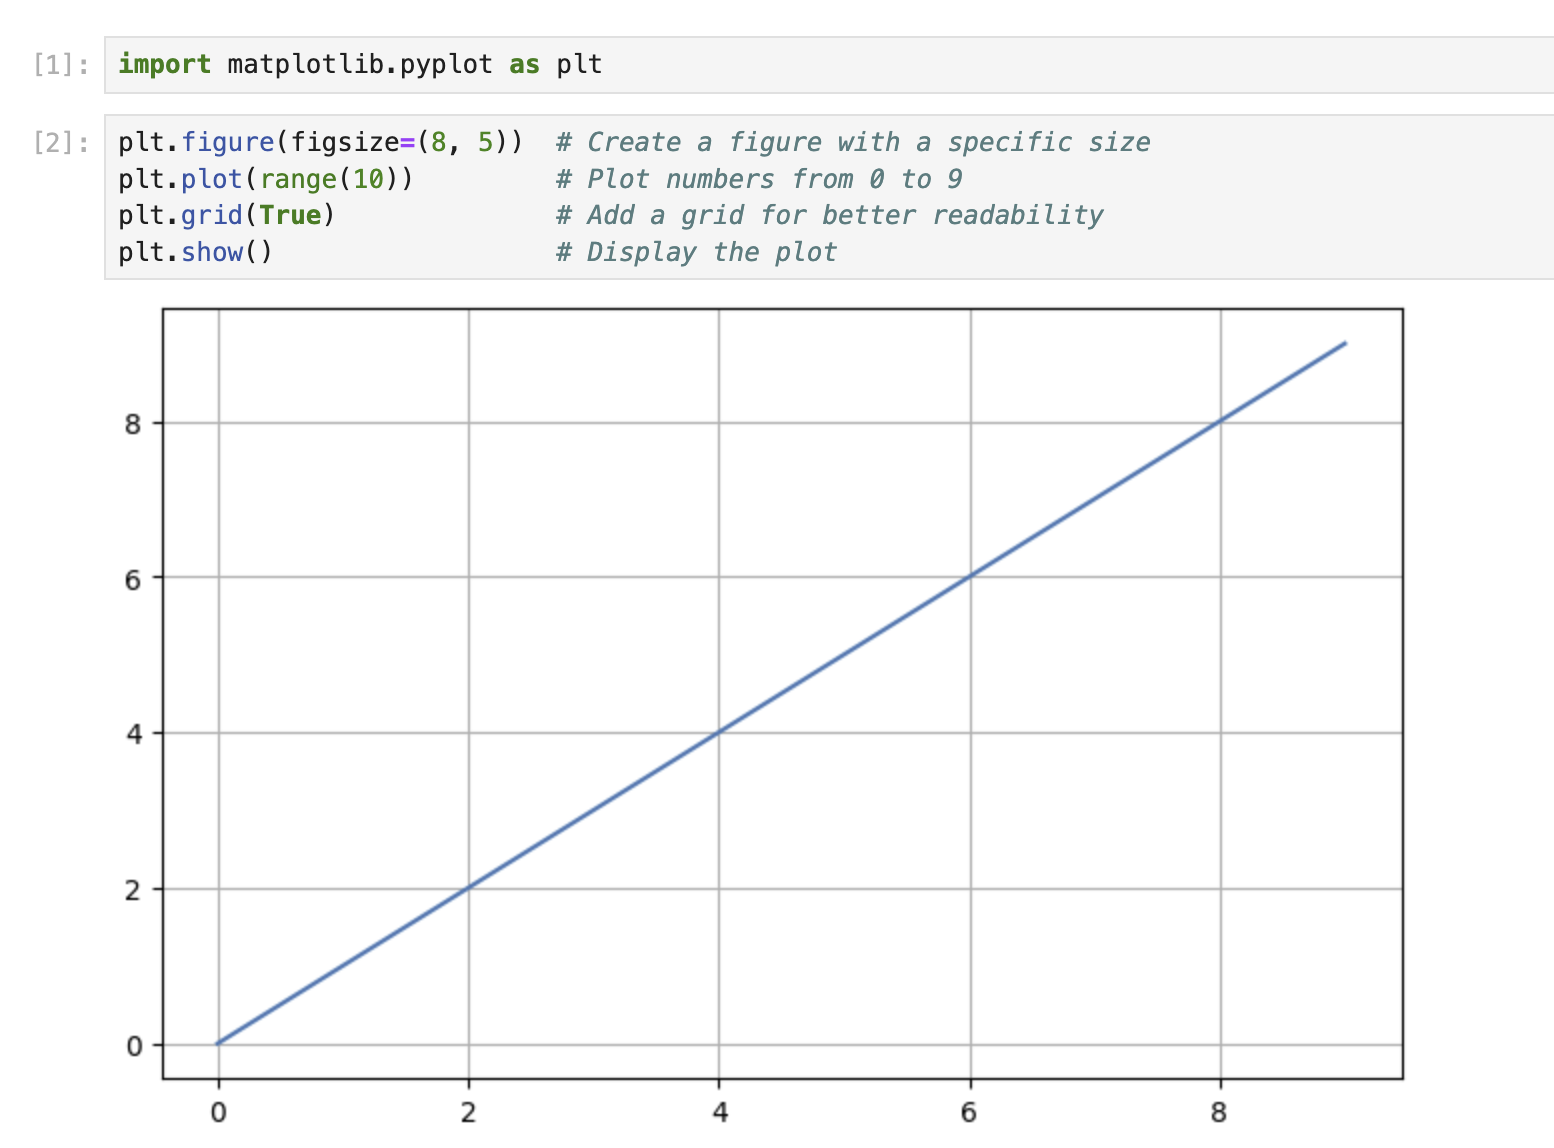
plt.figure(figsize=(8, 5))  ## Create a figure with a specific size
plt.plot(range(10))         ## Plot numbers from 0 to 9
plt.grid(True)              ## Add a grid for better readability
plt.show()                  ## Display the plot
Você deve ver um gráfico de linha simples com valores de 0 a 9 exibidos na saída.
Adicionando um Título Padrão (Centralizado)
Agora, vamos adicionar um título ao nosso gráfico. A posição padrão para um título é centralizada ao longo da parte superior do gráfico. Em uma nova célula, insira o seguinte código:
plt.figure(figsize=(8, 5))
plt.plot(range(10))
plt.grid(True)
plt.title('My First Matplotlib Plot')  ## Add a centered title
plt.show()
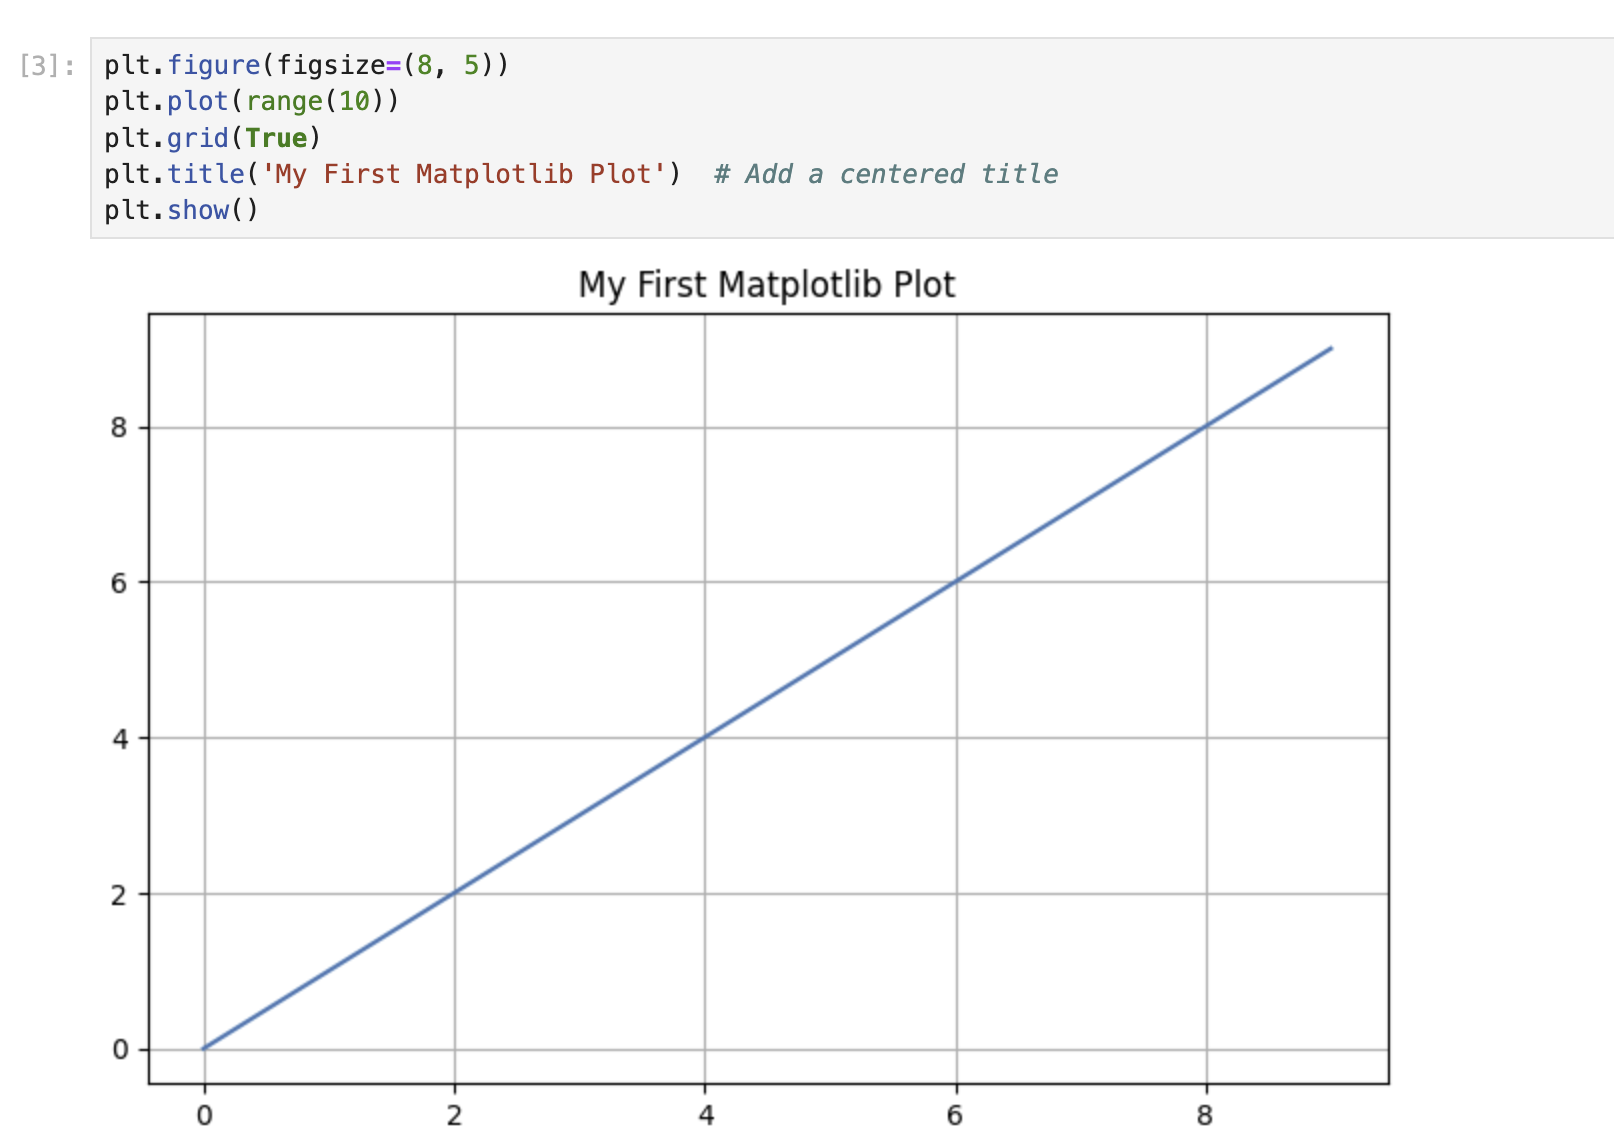
Execute a célula e você deverá ver o gráfico com um título centralizado na parte superior.
A função title() sem nenhum parâmetro adicional colocará o título no centro, que é a posição padrão.
Posicionamento de Títulos à Esquerda e à Direita
Matplotlib permite que você posicione o título no lado esquerdo ou direito do gráfico usando o parâmetro loc. Nesta etapa, você aprenderá como alinhar títulos aos lados esquerdo e direito de seus gráficos.
Criando um Gráfico com um Título Alinhado à Esquerda
Vamos criar um gráfico com o título posicionado no lado esquerdo. Em uma nova célula, insira o seguinte código:
plt.figure(figsize=(8, 5))
plt.plot(range(10))
plt.grid(True)
plt.title('Left-Aligned Title', loc='left')  ## Position the title at the left
plt.show()
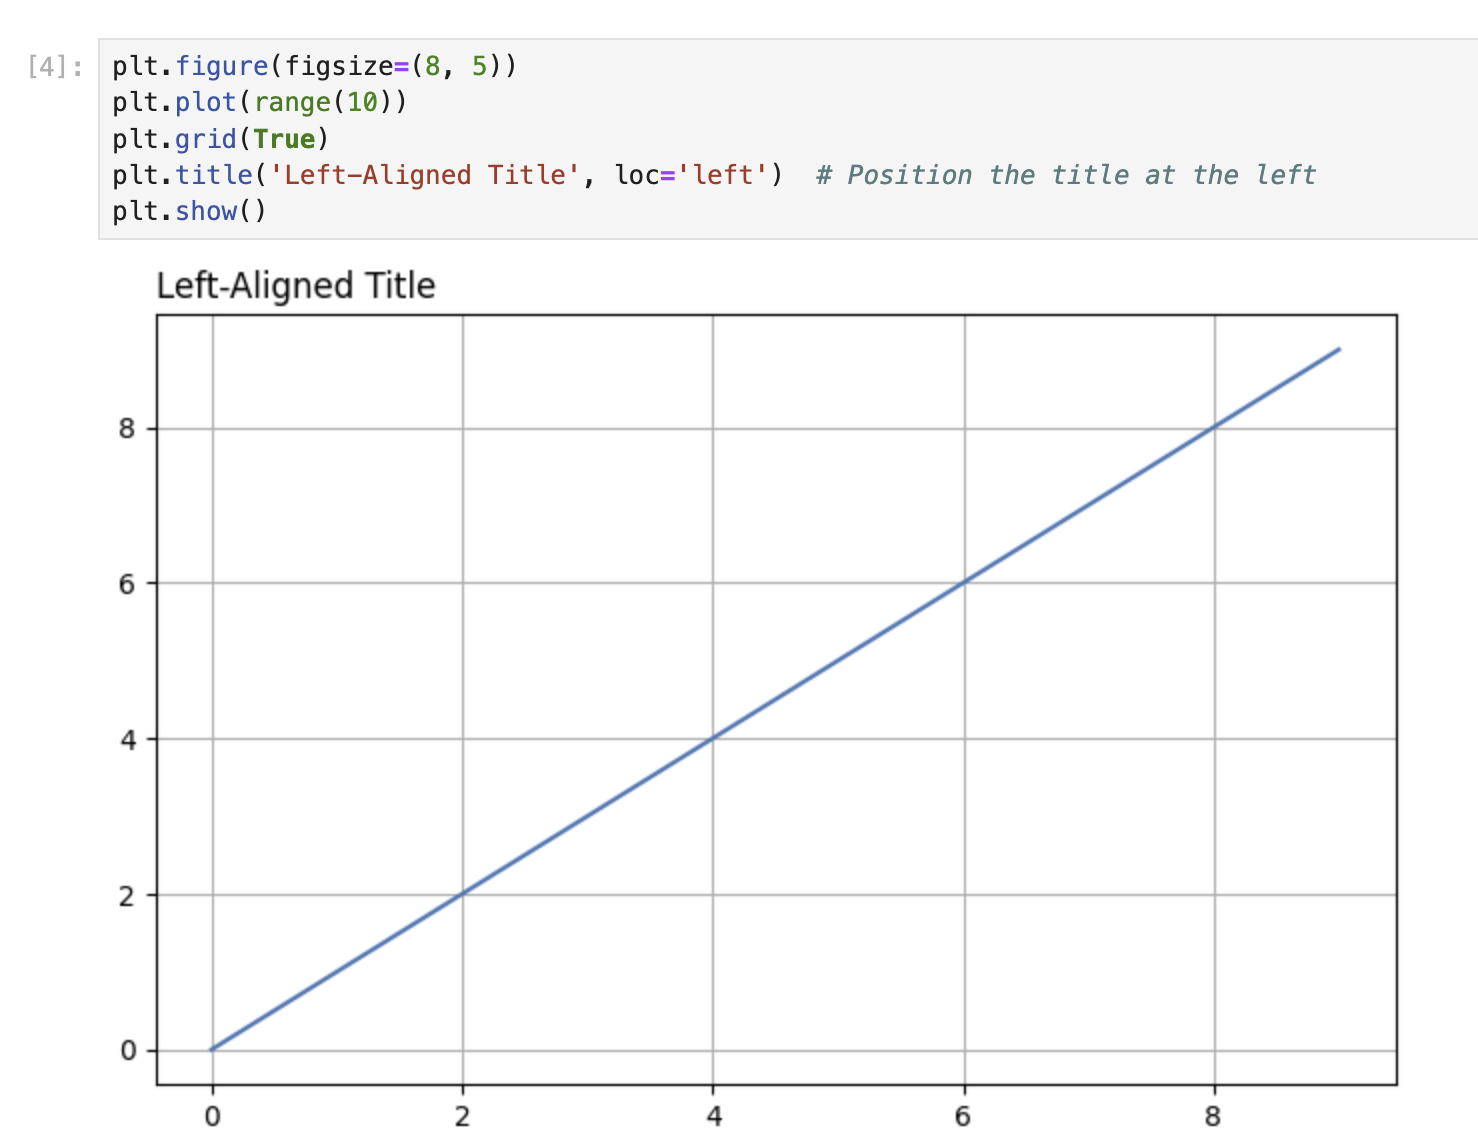
Execute a célula. Observe como o título agora aparece alinhado com a borda esquerda do gráfico, em vez de centralizado.
O parâmetro loc na função title() determina a posição horizontal do título. Ao definir loc='left', você está dizendo ao Matplotlib para posicionar o título no lado esquerdo do gráfico.
Criando um Gráfico com um Título Alinhado à Direita
Agora, vamos criar outro gráfico com o título posicionado no lado direito. Em uma nova célula, insira o seguinte código:
plt.figure(figsize=(8, 5))
plt.plot(range(10))
plt.grid(True)
plt.title('Right-Aligned Title', loc='right')  ## Position the title at the right
plt.show()
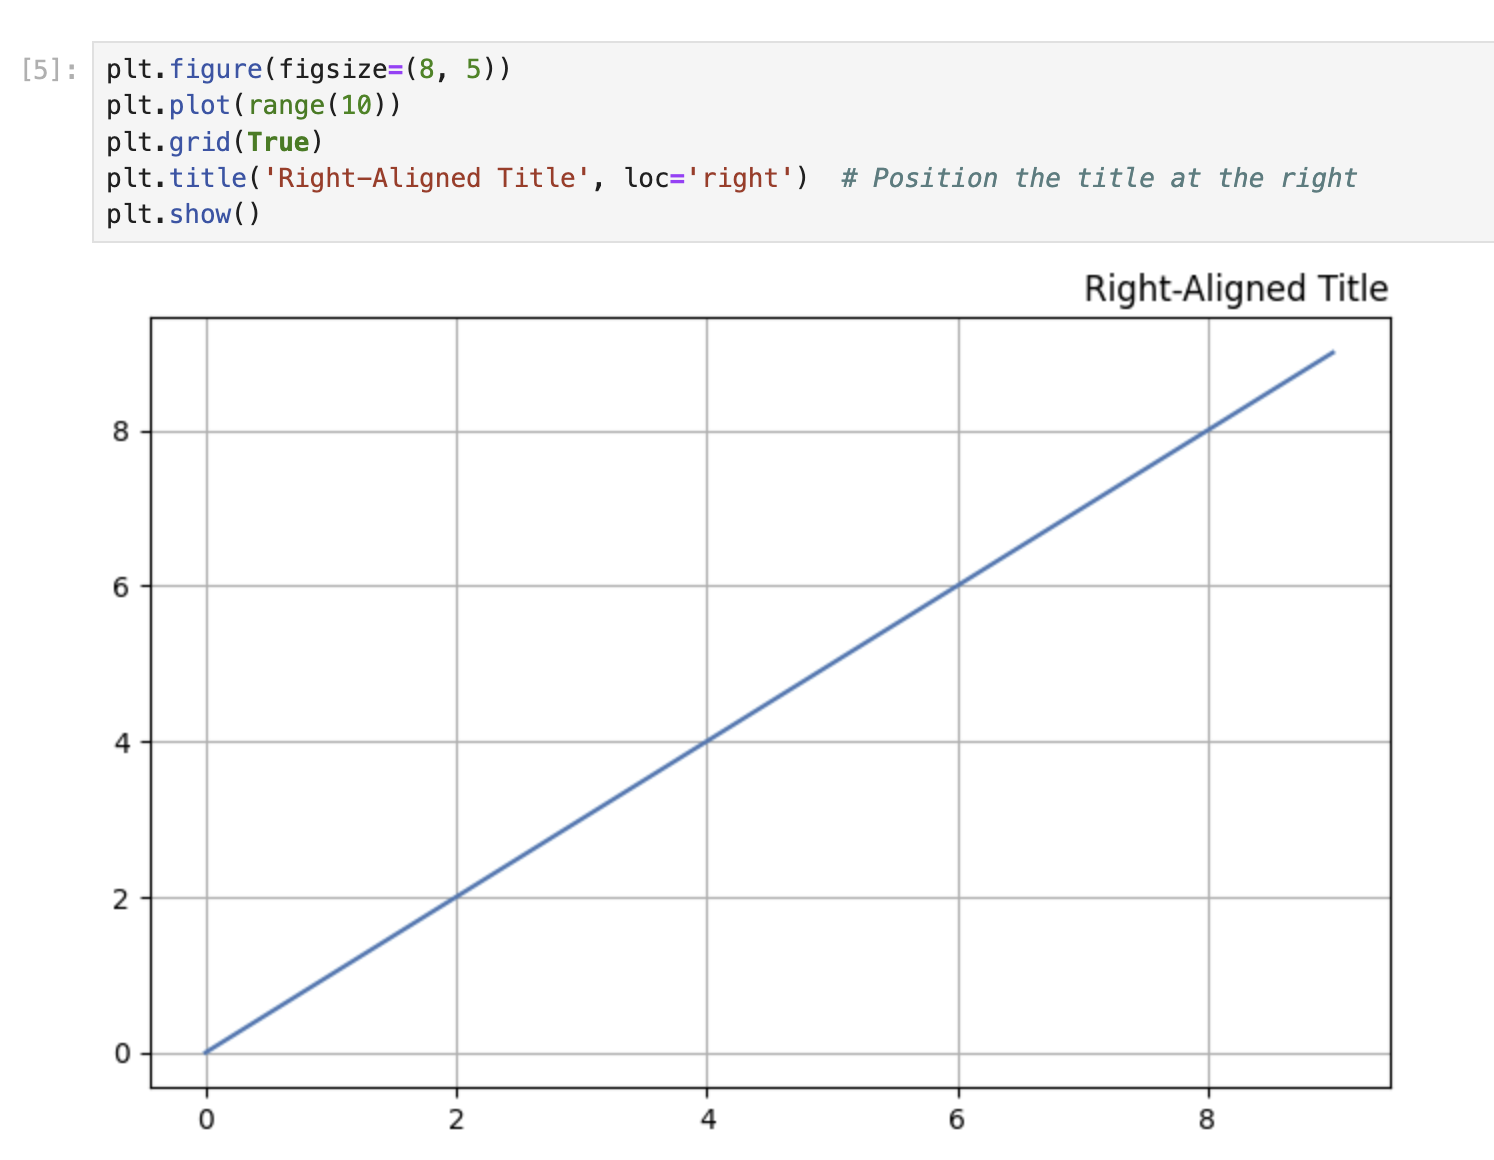
Execute a célula. O título agora deve aparecer alinhado com a borda direita do gráfico.
Comparando Diferentes Posições de Título
Vamos criar uma sequência de três gráficos para comparar as diferentes posições do título (centro, esquerda e direita). Em uma nova célula, insira o seguinte código:
## Create a figure with 3 subplots arranged horizontally
fig, axes = plt.subplots(1, 3, figsize=(15, 4))

## Plot 1: Center-aligned title (default)
axes[0].plot(range(10))
axes[0].grid(True)
axes[0].set_title('Center Title')

## Plot 2: Left-aligned title
axes[1].plot(range(10))
axes[1].grid(True)
axes[1].set_title('Left Title', loc='left')

## Plot 3: Right-aligned title
axes[2].plot(range(10))
axes[2].grid(True)
axes[2].set_title('Right Title', loc='right')

plt.tight_layout()  ## Adjust spacing between subplots
plt.show()
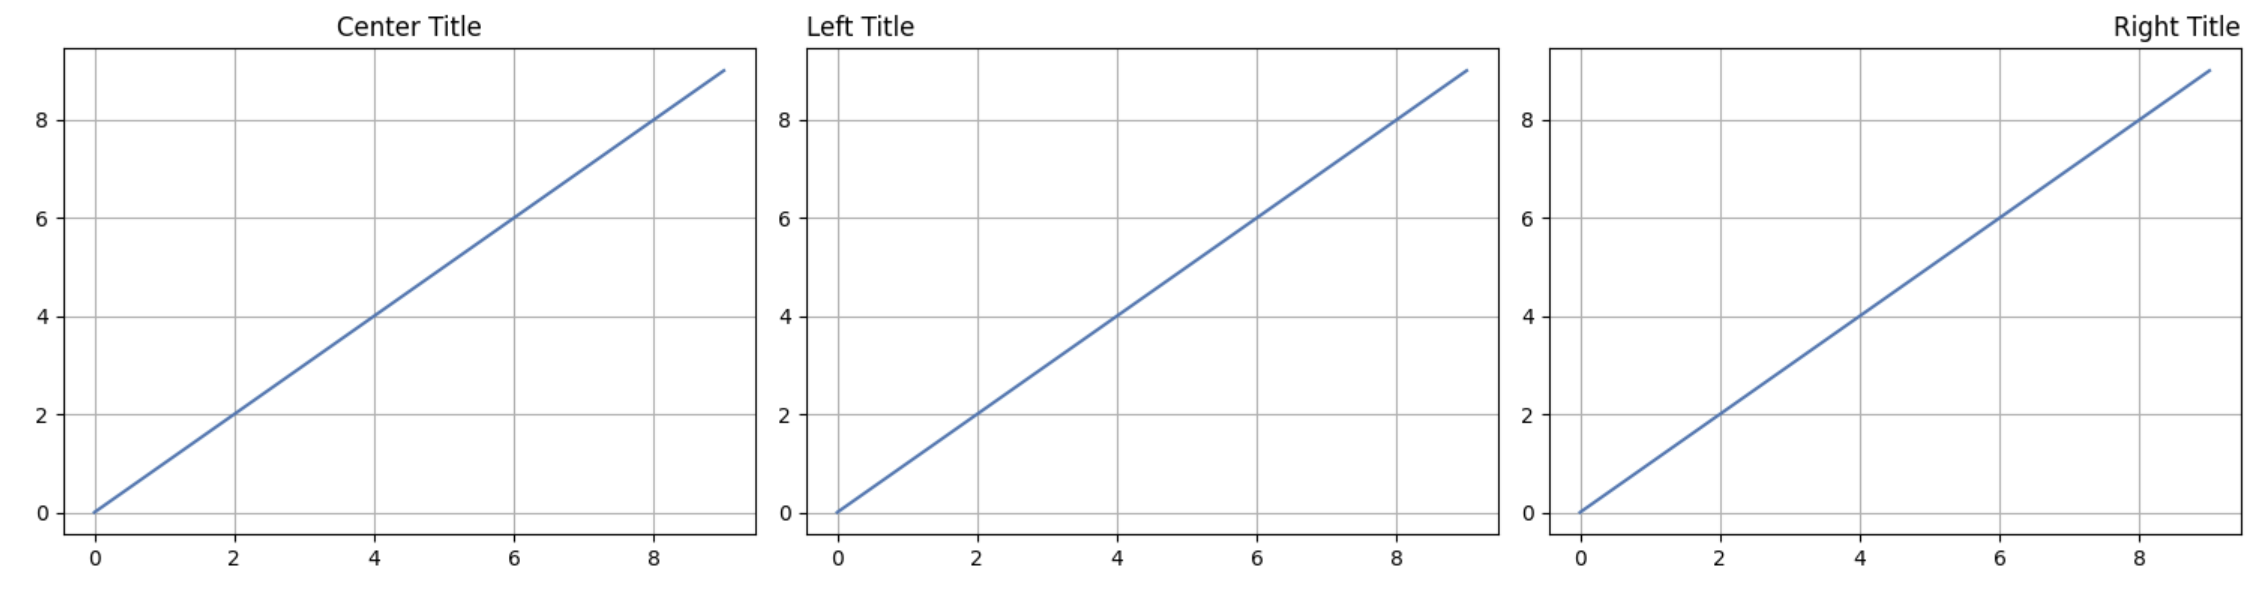
Execute a célula para ver todas as três posições do título lado a lado. Essa comparação visual ajuda você a entender como o parâmetro loc afeta o posicionamento do título.
Observe que, ao trabalhar com subplots, usamos o método set_title() nos objetos de eixo individuais, em vez da função global plt.title().
Posicionamento Vertical Personalizado do Título
Às vezes, você pode querer ajustar a posição vertical do seu título. Nesta etapa, você aprenderá como controlar manualmente a posição vertical (eixo y) dos títulos do seu gráfico.
Entendendo a Posição Y nos Títulos
A posição vertical de um título pode ser ajustada usando o parâmetro y na função title(). O parâmetro y aceita valores em coordenadas normalizadas, onde:
y=1.0(padrão) coloca o título no topo do gráficoy>1.0coloca o título acima do topo do gráficoy<1.0coloca o título abaixo do topo do gráfico, movendo-o mais perto do conteúdo do gráfico
Criando um Gráfico com Posição Y de Título Personalizada
Vamos criar um gráfico com o título posicionado mais alto do que o padrão. Em uma nova célula, insira o seguinte código:
plt.figure(figsize=(8, 5))
plt.plot(range(10))
plt.grid(True)
plt.title('Higher Title Position', y=1.1)  ## Position the title higher
plt.show()
Execute a célula. Observe como o título agora aparece ligeiramente mais alto acima do gráfico em comparação com a posição padrão.
Agora, vamos criar um gráfico com o título posicionado mais baixo do que o padrão:
plt.figure(figsize=(8, 5))
plt.plot(range(10))
plt.grid(True)
plt.title('Lower Title Position', y=0.9)  ## Position the title lower
plt.show()
Execute a célula. O título agora deve aparecer mais próximo do conteúdo do gráfico.
Comparando Diferentes Posições Y
Vamos criar vários gráficos lado a lado para comparar diferentes posições verticais do título:
## Create a figure with 3 subplots arranged horizontally
fig, axes = plt.subplots(1, 3, figsize=(15, 4))

## Plot 1: Default Y-position
axes[0].plot(range(10))
axes[0].grid(True)
axes[0].set_title('Default Position (y=1.0)')

## Plot 2: Higher Y-position
axes[1].plot(range(10))
axes[1].grid(True)
axes[1].set_title('Higher Position', y=1.15)

## Plot 3: Lower Y-position
axes[2].plot(range(10))
axes[2].grid(True)
axes[2].set_title('Lower Position', y=0.85)

plt.tight_layout()  ## Adjust spacing between subplots
plt.show()
Execute a célula para ver todas as três posições verticais lado a lado. Essa comparação ajuda você a entender como o parâmetro y afeta a posição vertical do título.
Combinando Posicionamento Horizontal e Vertical
Você pode combinar o parâmetro loc (para alinhamento horizontal) com o parâmetro y (para posição vertical) para colocar seu título exatamente onde você deseja:
plt.figure(figsize=(8, 5))
plt.plot(range(10))
plt.grid(True)
plt.title('Custom Positioned Title', loc='right', y=1.1)  ## Right-aligned and higher
plt.show()
Execute a célula. O título agora deve aparecer alinhado com a borda direita do gráfico e posicionado mais alto do que o padrão.
Posicionamento Avançado de Títulos com Subplots
Nesta etapa, você aprenderá técnicas avançadas para o posicionamento de títulos ao trabalhar com layouts de subplot e objetos de eixos. Você também aprenderá como usar a função suptitle() para adicionar um título geral a uma figura com vários subplots.
Criando uma Figura com Subplots e Títulos Individuais
Vamos criar uma grade 2x2 de subplots, cada um com seu próprio título posicionado de forma diferente:
## Create a figure with a 2x2 grid of subplots
fig, axes = plt.subplots(2, 2, figsize=(10, 8))

## Flatten the 2D array of axes for easier iteration
axes = axes.flatten()

## Plot data and set titles with different positions for each subplot
for i, ax in enumerate(axes):
    ax.plot(range(10))
    ax.grid(True)

## Top-left subplot: Default centered title
axes[0].set_title('Default (Centered)')

## Top-right subplot: Left-aligned title
axes[1].set_title('Left-Aligned', loc='left')

## Bottom-left subplot: Right-aligned title
axes[2].set_title('Right-Aligned', loc='right')

## Bottom-right subplot: Custom positioned title
axes[3].set_title('Custom Position', y=0.85, loc='center')

## Add spacing between subplots
plt.tight_layout()
plt.show()
Execute a célula. Você deve ver quatro subplots, cada um com um título posicionado de forma diferente.
Adicionando um Título em Nível de Figura com suptitle()
Ao trabalhar com vários subplots, você pode querer adicionar um título geral para toda a figura. Isso pode ser feito usando a função suptitle():
## Create a figure with a 2x2 grid of subplots
fig, axes = plt.subplots(2, 2, figsize=(10, 8))

## Flatten the 2D array of axes for easier iteration
axes = axes.flatten()

## Plot data on each subplot
for i, ax in enumerate(axes):
    ax.plot(range(10))
    ax.grid(True)
    ax.set_title(f'Subplot {i+1}')

## Add an overall title to the figure
fig.suptitle('Multiple Subplots with an Overall Title', fontsize=16)

## Add spacing between subplots
plt.tight_layout()
## Add top spacing for the suptitle
plt.subplots_adjust(top=0.9)
plt.show()
Execute a célula. Você deve ver quatro subplots, cada um com seu próprio título, e um título geral para a figura no topo.
Combinando Títulos de Eixos e Títulos de Figura
Você pode combinar títulos de subplot individuais com um título geral da figura:
## Create a figure with a 2x2 grid of subplots
fig, axes = plt.subplots(2, 2, figsize=(10, 8))

## Plot data on each subplot with different title positions
axes[0, 0].plot(range(10))
axes[0, 0].grid(True)
axes[0, 0].set_title('Centered Title', loc='center')

axes[0, 1].plot(range(10))
axes[0, 1].grid(True)
axes[0, 1].set_title('Left-Aligned Title', loc='left')

axes[1, 0].plot(range(10))
axes[1, 0].grid(True)
axes[1, 0].set_title('Right-Aligned Title', loc='right')

axes[1, 1].plot(range(10))
axes[1, 1].grid(True)
axes[1, 1].set_title('Lower Title', y=0.85)

## Add an overall title to the figure
fig.suptitle('Advanced Title Positioning Demo', fontsize=16)

## Add spacing between subplots
plt.tight_layout()
## Add top spacing for the suptitle
plt.subplots_adjust(top=0.9)
plt.show()
Execute a célula. Você deve ver uma figura com quatro subplots, cada um com um título posicionado de forma diferente, e um título geral no topo da figura.
A função suptitle() é útil para adicionar um título principal que descreve toda a figura, enquanto as chamadas individuais set_title() nos objetos de eixos adicionam títulos mais específicos a cada subplot.
Posicionamento Global de Títulos com RCParams
Nesta etapa final, você aprenderá como usar os parâmetros de configuração de tempo de execução (RCParams) do Matplotlib para definir padrões globais para o posicionamento de títulos. Isso é útil quando você deseja que todos os gráficos em seu notebook ou script usem um posicionamento de título consistente sem ter que especificá-lo para cada gráfico individualmente.
Entendendo RCParams no Matplotlib
O comportamento do Matplotlib pode ser personalizado usando uma variável semelhante a um dicionário chamada rcParams. Isso permite que você defina padrões globais para várias propriedades, incluindo o posicionamento do título.
Definindo o Posicionamento Global do Título com rcParams
Vamos definir padrões globais para o posicionamento do título e, em seguida, criar alguns gráficos que usarão automaticamente essas configurações:
## View the current default values
print("Default title y position:", plt.rcParams['axes.titley'])
print("Default title padding:", plt.rcParams['axes.titlepad'])
Execute a célula para ver os valores padrão. Agora, vamos modificar essas configurações:
## Set new global defaults for title positioning
plt.rcParams['axes.titley'] = 1.05     ## Set title y position higher
plt.rcParams['axes.titlepad'] = 10     ## Set padding between title and plot
plt.rcParams['axes.titlelocation'] = 'left'  ## Set default alignment to left

## Create a plot that will use the new defaults
plt.figure(figsize=(8, 5))
plt.plot(range(10))
plt.grid(True)
plt.title('This Title Uses Global RCParams Settings')
plt.show()
Execute a célula. Observe como o título é posicionado de acordo com as configurações globais que definimos, mesmo que não tenhamos especificado nenhum parâmetro de posicionamento na função title().
Criando Vários Gráficos com as Mesmas Configurações
Vamos criar vários gráficos que usam todas as nossas configurações globais:
## Create a figure with a 2x2 grid of subplots
fig, axes = plt.subplots(2, 2, figsize=(10, 8))

## Flatten the 2D array of axes for easier iteration
axes = axes.flatten()

## Plot data on each subplot with titles that use global settings
for i, ax in enumerate(axes):
    ax.plot(range(10))
    ax.grid(True)
    ax.set_title(f'Subplot {i+1} Using Global Settings')

plt.tight_layout()
plt.show()
Execute a célula. Todos os quatro títulos de subplot devem ser posicionados de acordo com as configurações globais que definimos anteriormente.
Redefinindo RCParams para os Padrões
Se você quiser redefinir os RCParams para seus valores padrão, você pode usar a função rcdefaults():
## Reset to default settings
plt.rcdefaults()

## Create a plot with default settings
plt.figure(figsize=(8, 5))
plt.plot(range(10))
plt.grid(True)
plt.title('This Title Uses Default Settings Again')
plt.show()
Execute a célula. O título agora deve ser posicionado usando as configurações padrão do Matplotlib.
Mudanças Temporárias nos RCParams
Se você quiser alterar temporariamente os RCParams apenas para uma seção específica do seu código, você pode usar um gerenciador de contexto:
## Create a plot with default settings
plt.figure(figsize=(8, 5))
plt.plot(range(10))
plt.grid(True)
plt.title('Default Settings')
plt.show()

## Temporarily change RCParams for just this section
with plt.rc_context({'axes.titlelocation': 'right', 'axes.titley': 1.1}):
    plt.figure(figsize=(8, 5))
    plt.plot(range(10))
    plt.grid(True)
    plt.title('Temporary Settings Change')
    plt.show()

## Create another plot that will use default settings again
plt.figure(figsize=(8, 5))
plt.plot(range(10))
plt.grid(True)
plt.title('Back to Default Settings')
plt.show()
Execute a célula. Você deve ver três gráficos:
- O primeiro com posicionamento de título padrão
- O segundo com título alinhado à direita e posicionado mais alto (devido às configurações temporárias)
- O terceiro com posicionamento de título padrão novamente (pois as configurações temporárias só se aplicaram dentro do gerenciador de contexto)
Essa abordagem permite que você faça alterações temporárias nas configurações globais sem afetar o restante de seus gráficos.
Resumo
Neste laboratório, você aprendeu a controlar o posicionamento dos títulos dos gráficos no Matplotlib:
Posicionamento Básico do Título: Você criou gráficos simples com títulos centralizados usando o posicionamento padrão.
Posicionamento Horizontal: Você aprendeu a alinhar títulos à esquerda ou à direita de um gráfico usando o parâmetro
loc.Posicionamento Vertical: Você descobriu como ajustar a posição vertical dos títulos usando o parâmetro
y, colocando-os mais altos ou mais baixos em relação ao gráfico.Técnicas Avançadas com Subplots: Você explorou como posicionar títulos em subplots individuais e como adicionar um título geral à figura usando
suptitle().Configurações Globais com RCParams: Você aprendeu a definir padrões globais para o posicionamento do título usando os parâmetros de configuração de tempo de execução do Matplotlib, permitindo um estilo consistente em vários gráficos.
Essas habilidades ajudarão você a criar visualizações de dados mais profissionais e visualmente atraentes, onde os títulos são posicionados exatamente onde você deseja que eles estejam. O posicionamento do título é um aspecto pequeno, mas importante, da visualização de dados eficaz, ajudando a direcionar a atenção do seu público e melhorar a clareza geral de seus gráficos.
Para uma exploração mais aprofundada, considere experimentar outras opções de personalização de títulos, como propriedades de fonte, rotação e cores, para tornar suas visualizações ainda mais impactantes.