介绍
欢迎来到 Matplotlib 散点图实验!散点图是数据可视化中的一个基本工具,用于显示一组数据中通常两个变量的值。它们非常适合观察变量之间的关系或相关性。
在这个实验中,你将使用 Python 中的 Matplotlib 库来创建散点图。你将学习如何:
- 使用 NumPy 生成数据数组。
- 使用
plt.scatter()创建一个基本的散点图。 - 自定义图的外观,包括标记大小和颜色。
- 添加网格以提高可读性。
你所有的工作都将在 WebIDE 环境中完成。你将在一个文件中编写 Python 代码,并从终端运行它。由于此环境是非交互式的,你将使用 plt.savefig() 将图保存到图像文件,而不是使用 plt.show() 显示它们。
让我们开始吧!
生成 x 和 y 数据数组
在此步骤中,你将创建将用于散点图的数据。散点图至少需要两个相同长度的数据数组:一个用于 x 轴坐标,一个用于 y 轴坐标。我们将使用 NumPy 库,它是 Python 中数值运算的标准库。
首先,从 WebIDE 左侧面板的文件浏览器中打开 main.py 文件。你将在此处编写此实验的所有代码。
现在,将以下代码添加到 main.py 中以导入 NumPy 并创建两个简单的数据数组。
import numpy as np

## Data for plotting
x = np.array([5, 7, 8, 7, 2, 17, 2, 9, 4, 11, 12, 9, 6])
y = np.array([99, 86, 87, 88, 111, 86, 103, 87, 94, 78, 77, 85, 86])
让我们分解一下代码:
import numpy as np: 此行导入 NumPy 库并为其指定约定俗成的别名np。x = np.array([...]): 这会创建一个名为x的 NumPy 数组,其中包含我们用于水平轴的数据点。y = np.array([...]): 这会创建一个名为y的 NumPy 数组,其中包含我们用于垂直轴的数据点。
你的 main.py 文件现在应该包含此代码。在下一步中,我们将使用这些数据创建我们的第一个图。
使用 plt.scatter(x, y) 绘制散点图
在此步骤中,你将使用生成的数据创建基本的散点图。我们将使用 matplotlib.pyplot 模块,它提供了一个简单的绘图接口。
首先,你需要导入 matplotlib.pyplot。然后,你可以使用 plt.scatter() 函数来创建图。最后,你必须将图保存到文件。正如在介绍中所提到的,在此环境中我们不能使用 plt.show() 直接显示图。相反,我们将使用 plt.savefig() 将其保存为图像。
使用以下代码更新你的 main.py 文件。将新行添加到现有代码下方。
import numpy as np
import matplotlib.pyplot as plt
## Data for plotting
x = np.array([5, 7, 8, 7, 2, 17, 2, 9, 4, 11, 12, 9, 6])
y = np.array([99, 86, 87, 88, 111, 86, 103, 87, 94, 78, 77, 85, 86])
## Create scatter plot
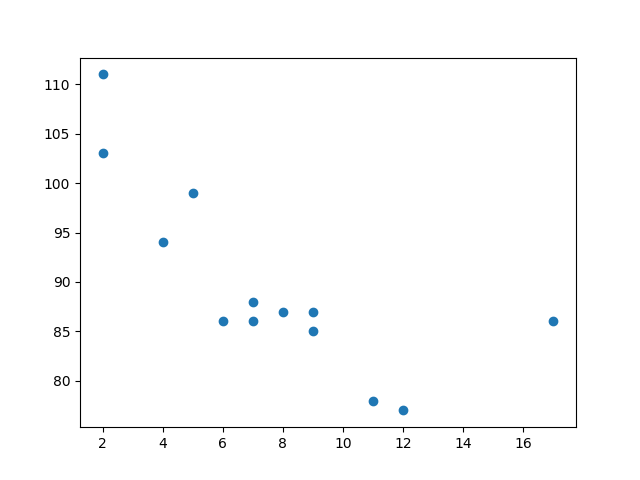
plt.scatter(x, y)
## Save the plot to a file
plt.savefig('/home/labex/project/scatter_plot.png')
print("Scatter plot saved to scatter_plot.png")
代码解释:
import matplotlib.pyplot as plt: 导入绘图模块并为其指定标准别名plt。plt.scatter(x, y): 这是核心函数。它接收x和y数组,并将每对(x, y)值绘制为一个点。plt.savefig('/home/labex/project/scatter_plot.png'): 此函数将当前图形保存到~/project目录中名为scatter_plot.png的文件中。
现在,在 WebIDE 底部的终端中运行你的脚本:
python3 main.py
你应该会在终端中看到以下输出:
Scatter plot saved to scatter_plot.png
一个名为 scatter_plot.png 的新文件将出现在左侧的文件浏览器中。双击它即可查看你的第一个散点图!
使用 s 参数自定义标记大小
在此步骤中,你将学习如何自定义散点图中标记(即点)的大小。plt.scatter() 函数有一个可选参数 s,用于控制标记的大小。
你可以提供一个单一数字来使所有标记大小相同,或者提供一个数字数组(长度与你的 x 和 y 数据相同)来为每个标记指定唯一的大小。让我们尝试后者,使图更具趣味性。
修改你的 main.py 文件。我们将创建一个 sizes 数组,并将其传递给 plt.scatter() 函数中的 s 参数。
import numpy as np
import matplotlib.pyplot as plt
## Data for plotting
x = np.array([5, 7, 8, 7, 2, 17, 2, 9, 4, 11, 12, 9, 6])
y = np.array([99, 86, 87, 88, 111, 86, 103, 87, 94, 78, 77, 85, 86])
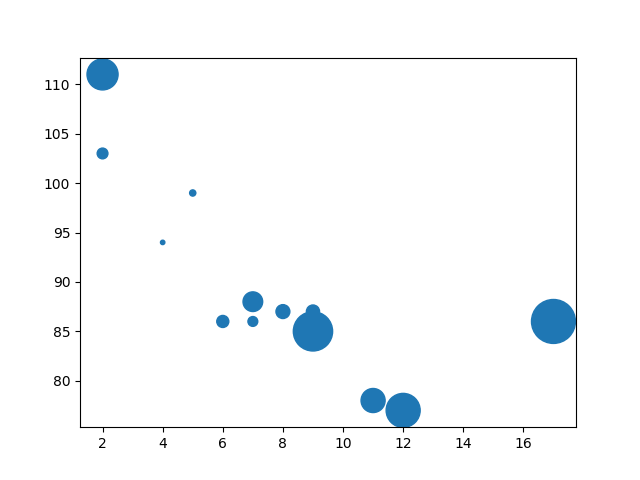
sizes = np.array([20, 50, 100, 200, 500, 1000, 60, 90, 10, 300, 600, 800, 75])
## Create scatter plot with custom sizes
plt.scatter(x, y, s=sizes)
## Save the plot to a file
plt.savefig('/home/labex/project/scatter_plot_sizes.png')
print("Scatter plot with custom sizes saved to scatter_plot_sizes.png")
在更新的代码中,我们添加了一个 sizes 数组,并将 plt.scatter() 调用修改为 plt.scatter(x, y, s=sizes)。现在,每个点都将使用 sizes 数组中对应的尺寸进行绘制。
再次运行脚本以查看更改:
python3 main.py
脚本完成后,再次打开 scatter_plot_sizes.png。你将注意到标记现在具有不同的尺寸,这使得图更具视觉信息量。
使用 c 参数更改标记颜色
在此步骤中,我们将自定义标记的颜色。与大小类似,你可以使用 plt.scatter() 函数中的 c 参数来控制颜色。
你可以传递一个单一的颜色名称(例如 'red')来使所有标记颜色相同,或者传递一个颜色数组来为每个标记指定特定颜色。让我们为每个点分配一个唯一的颜色。
更新你的 main.py 文件,以包含一个 colors 数组并将其传递给 c 参数。
import numpy as np
import matplotlib.pyplot as plt
## Data for plotting
x = np.array([5, 7, 8, 7, 2, 17, 2, 9, 4, 11, 12, 9, 6])
y = np.array([99, 86, 87, 88, 111, 86, 103, 87, 94, 78, 77, 85, 86])
sizes = np.array([20, 50, 100, 200, 500, 1000, 60, 90, 10, 300, 600, 800, 75])
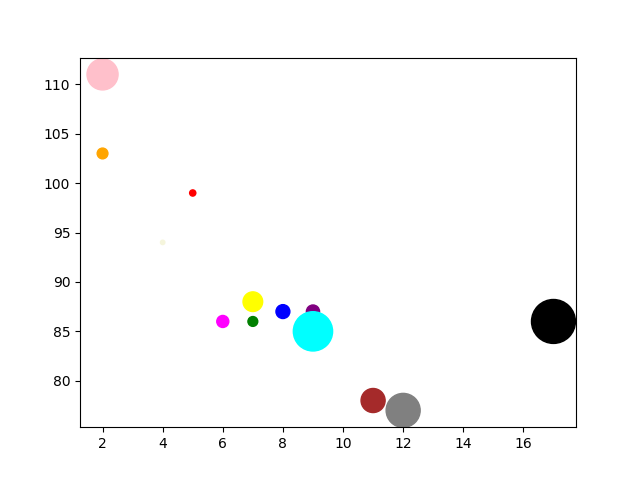
colors = np.array(["red", "green", "blue", "yellow", "pink", "black", "orange", "purple", "beige", "brown", "gray", "cyan", "magenta"])
## Create scatter plot with custom sizes and colors
plt.scatter(x, y, s=sizes, c=colors)
## Save the plot to a file
plt.savefig('/home/labex/project/scatter_plot_colors.png')
print("Scatter plot with custom colors saved to scatter_plot_colors.png")
我们现在已经添加了一个包含颜色名称的 colors 数组,并将函数调用更新为 plt.scatter(x, y, s=sizes, c=colors)。
从终端执行脚本:
python3 main.py
再打开一次 scatter_plot_colors.png。你将看到一个多彩的散点图,其中每个点的大小和颜色都与我们在数组中定义的相同,但颜色不同。
使用 plt.grid() 添加网格
在最后一步中,你将为散点图添加网格。网格可以使坐标轴上数据点的数值更容易读取。
在 Matplotlib 中添加网格非常简单。你只需要在保存图之前调用 plt.grid() 函数即可。默认情况下,plt.grid(True) 会显示网格。
让我们将此添加到我们的脚本中。修改 main.py 以包含 plt.grid() 调用。
import numpy as np
import matplotlib.pyplot as plt
## Data for plotting
x = np.array([5, 7, 8, 7, 2, 17, 2, 9, 4, 11, 12, 9, 6])
y = np.array([99, 86, 87, 88, 111, 86, 103, 87, 94, 78, 77, 85, 86])
sizes = np.array([20, 50, 100, 200, 500, 1000, 60, 90, 10, 300, 600, 800, 75])
colors = np.array(["red", "green", "blue", "yellow", "pink", "black", "orange", "purple", "beige", "brown", "gray", "cyan", "magenta"])
## Create scatter plot
plt.scatter(x, y, s=sizes, c=colors)
## Add a grid
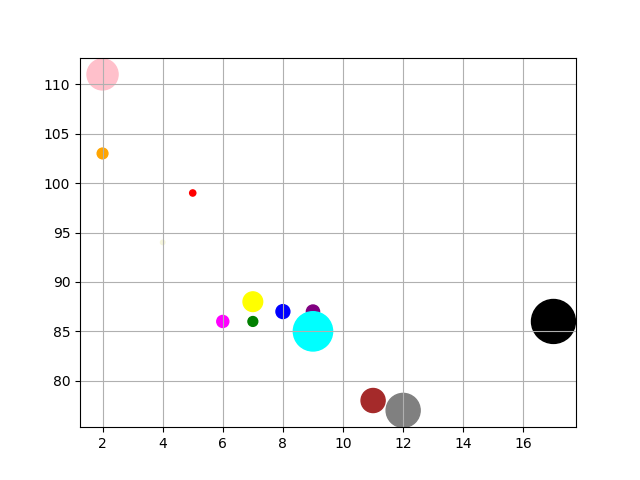
plt.grid(True)
## Save the plot to a file
plt.savefig('/home/labex/project/scatter_plot_grid.png')
print("Scatter plot with grid saved to scatter_plot_grid.png")
我们在 plt.savefig() 之前添加了 plt.grid(True)。这告诉 Matplotlib 在图上绘制一个网格。
运行你脚本的最终版本:
python3 main.py
现在,查看 scatter_plot_grid.png 图像。你的图现在应该在背景中有一个网格,完成了我们自定义的散点图。
总结
恭喜你完成了本次实验!你已成功掌握了使用 Matplotlib 创建和自定义散点图的基础知识。
在本次实验中,你练习了:
- 使用 NumPy 生成绘图数据。
- 使用
plt.scatter()创建基础散点图。 - 使用
s参数自定义标记大小。 - 使用
c参数更改标记颜色。 - 使用
plt.grid()为图添加网格。 - 使用
plt.savefig()将图保存到文件。
这些是在 Python 中进行数据可视化的基本技能。现在你可以创建信息丰富且视觉吸引人的散点图来探索数据中的关系。为了继续学习,你可以探索添加标题和标签、使用不同的标记样式或应用颜色映射以获得更高级的可视化效果。