
Introduction
In this lab, you will learn network analysis techniques using Wireshark, the industry-standard network protocol analyzer. This powerful tool enables you to examine network traffic at the packet level, providing valuable insights for troubleshooting and security analysis.
You will gain practical skills in capturing, filtering, and interpreting network packets. Through hands-on exercises, you'll understand how different protocols communicate and identify potential network issues.
Installing Wireshark
In this step, we'll install Wireshark on our Ubuntu system. Wireshark is a network protocol analyzer that lets you capture and interactively browse network traffic. It's available in the default Ubuntu repositories, making the installation process straightforward for beginners.
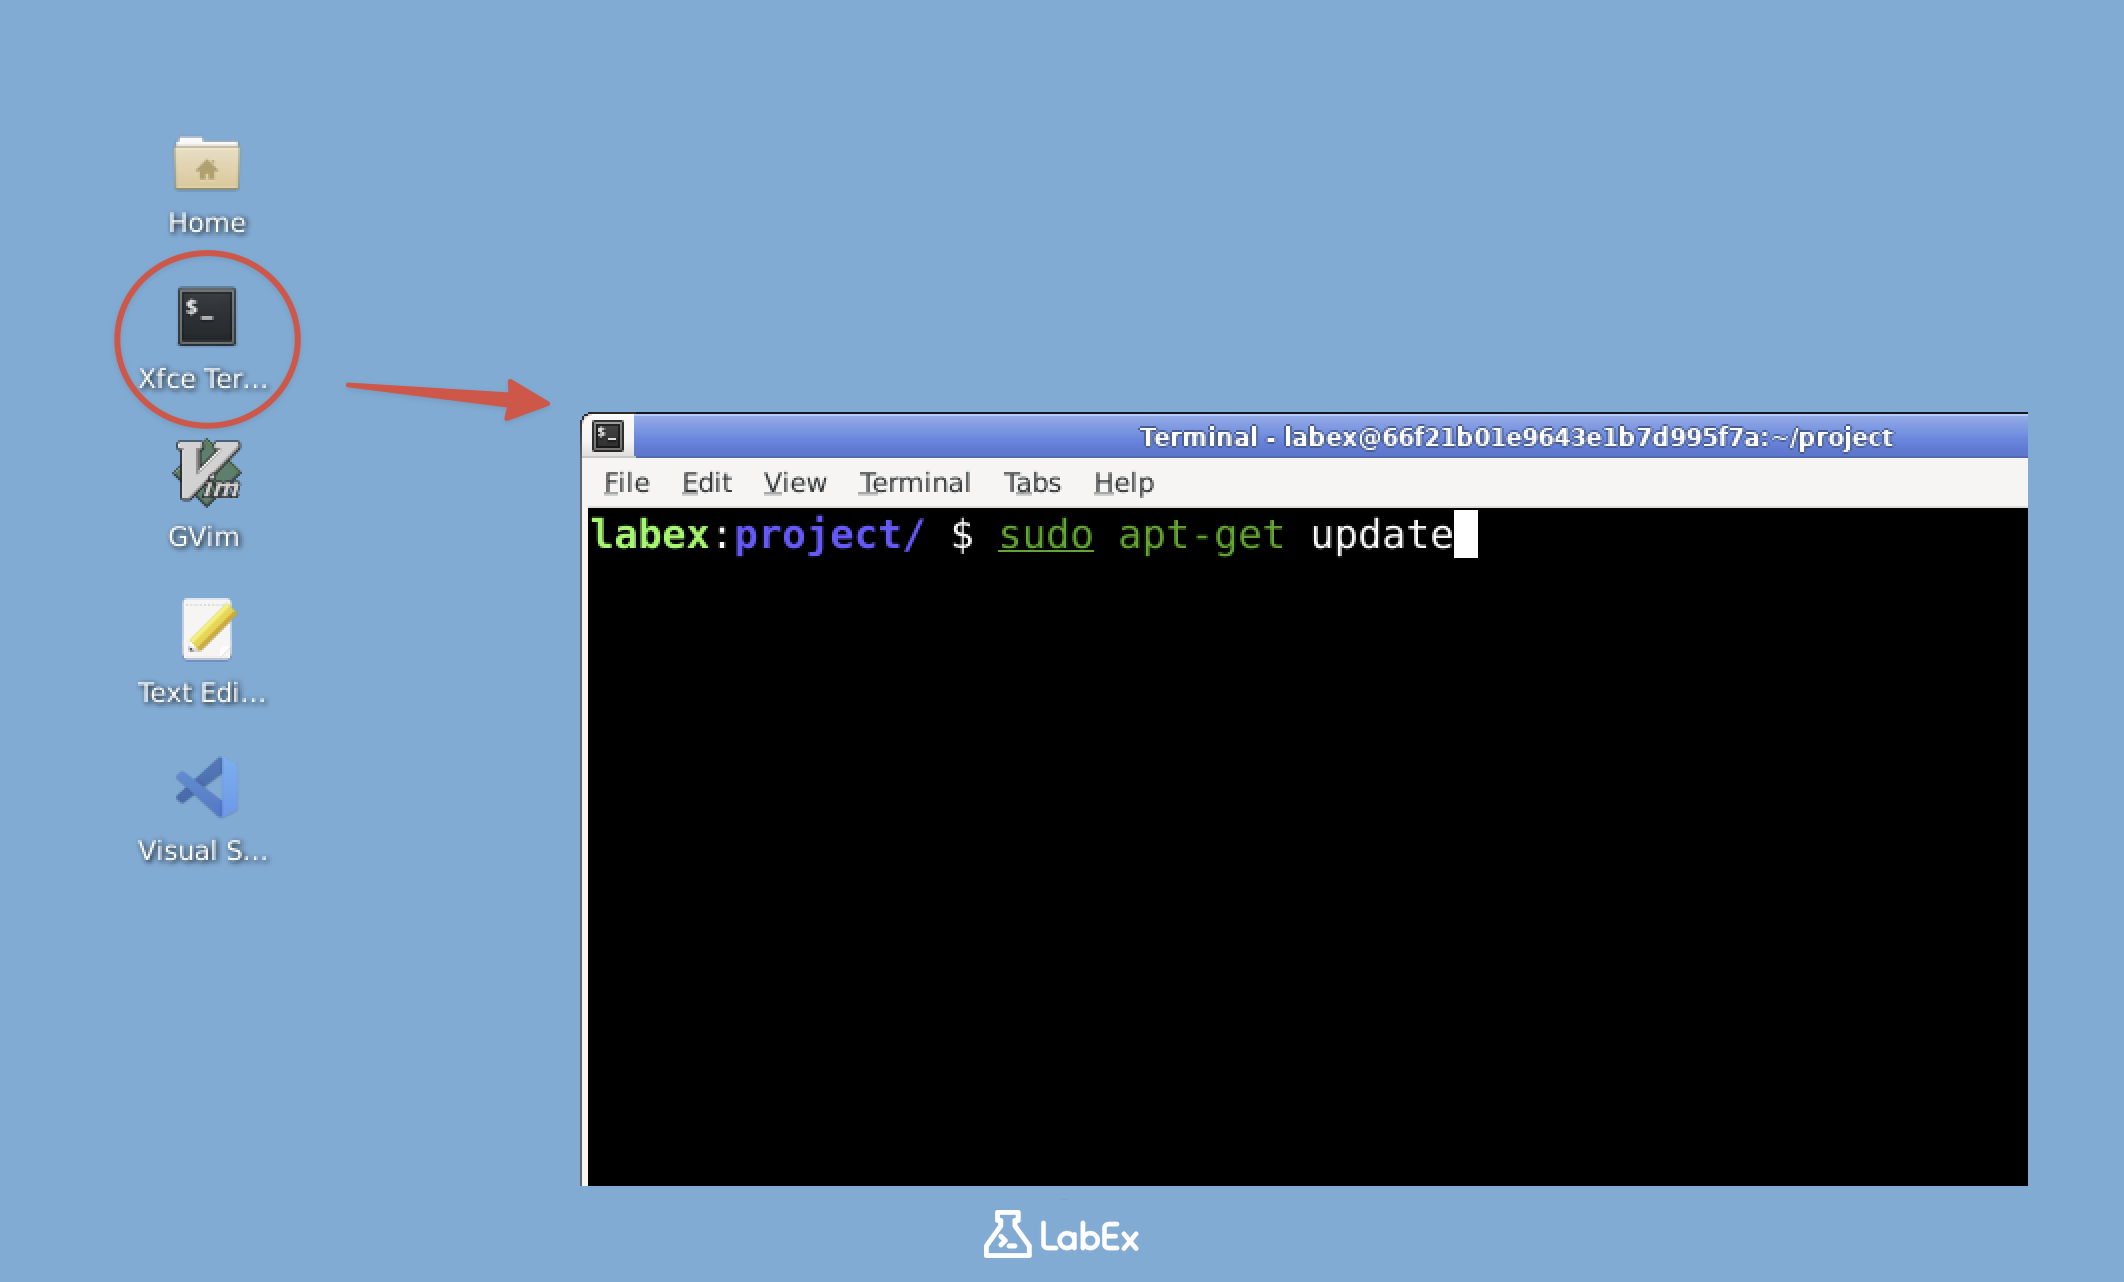
- First, let's open the terminal. On your desktop, locate and open the Xfce Terminal. The terminal is where we'll execute all our commands for installing and configuring Wireshark.
Note: Free users can't connect to the internet, so Wireshark is already pre-installed in the lab environment, You can jump to item 5 in the list (check if Wireshark is installed). Upgrade to a pro user to practice installing Wireshark by yourself.
Pro Users Only
- Before installing any software, it's good practice to update the package lists. This ensures we're installing the latest available version of Wireshark. Run the following command:
sudo apt update
- Now we'll install Wireshark itself. The
-yflag automatically answers "yes" to any prompts during installation, making the process smoother:
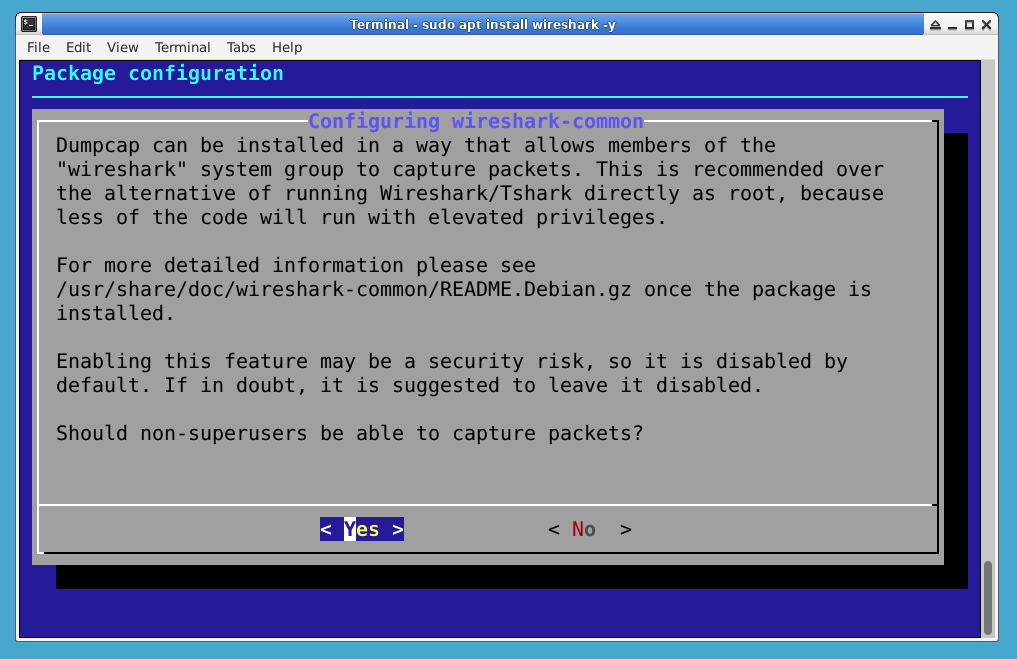
sudo apt install wireshark -y
- During installation, you'll encounter an important security prompt about allowing non-superusers to capture packets. This is a key configuration choice - selecting "Yes" means you won't need root privileges to run Wireshark, which is safer for everyday use. Use the arrow keys to select "Yes" and press Enter.
- After installation completes, let's verify Wireshark was installed correctly. The version check confirms the installation was successful and shows which version you're running:
wireshark --version
- To capture network traffic, we need to configure proper permissions. This involves adding your user to the
wiresharkgroup and setting up Dumpcap (Wireshark's packet capture tool) with the right permissions. In the LabEx desktop, do not log out and back in. Instead, configure Dumpcap so it can capture packets for Wireshark in the current session.
First, check if the wireshark group exists (it should have been created during installation):
getent group wireshark
If for some reason the group doesn't exist, create it with:
sudo groupadd wireshark
These commands configure Dumpcap to run with elevated privileges while keeping Wireshark itself running as a normal user - a security best practice:
sudo chgrp wireshark /usr/bin/dumpcap
sudo chmod 4755 /usr/bin/dumpcap
sudo gpasswd -a $USER wireshark
The chmod 4755 command applies the needed Dumpcap permission immediately, so you can continue to the next step without restarting your LabEx session. You've now successfully installed and configured Wireshark, ready to start analyzing network traffic!
Capturing Network Traffic
Now that we have Wireshark installed, let's capture some network traffic. Think of this like setting up a microphone to record all conversations happening on your network. Every time your computer sends or receives data online, it's broken down into small pieces called packets. Wireshark lets us see and analyze these packets.
Open Wireshark by typing
wiresharkin the terminal and pressing Enter. This launches the graphical interface where we'll do our packet capturing.When Wireshark opens, you'll see a list of network interfaces (the connections your computer uses to talk to networks). Look for an interface named "eth0" or "eth1" - these are typically your wired Ethernet connections. If you're using WiFi, you might see "wlan0" instead.
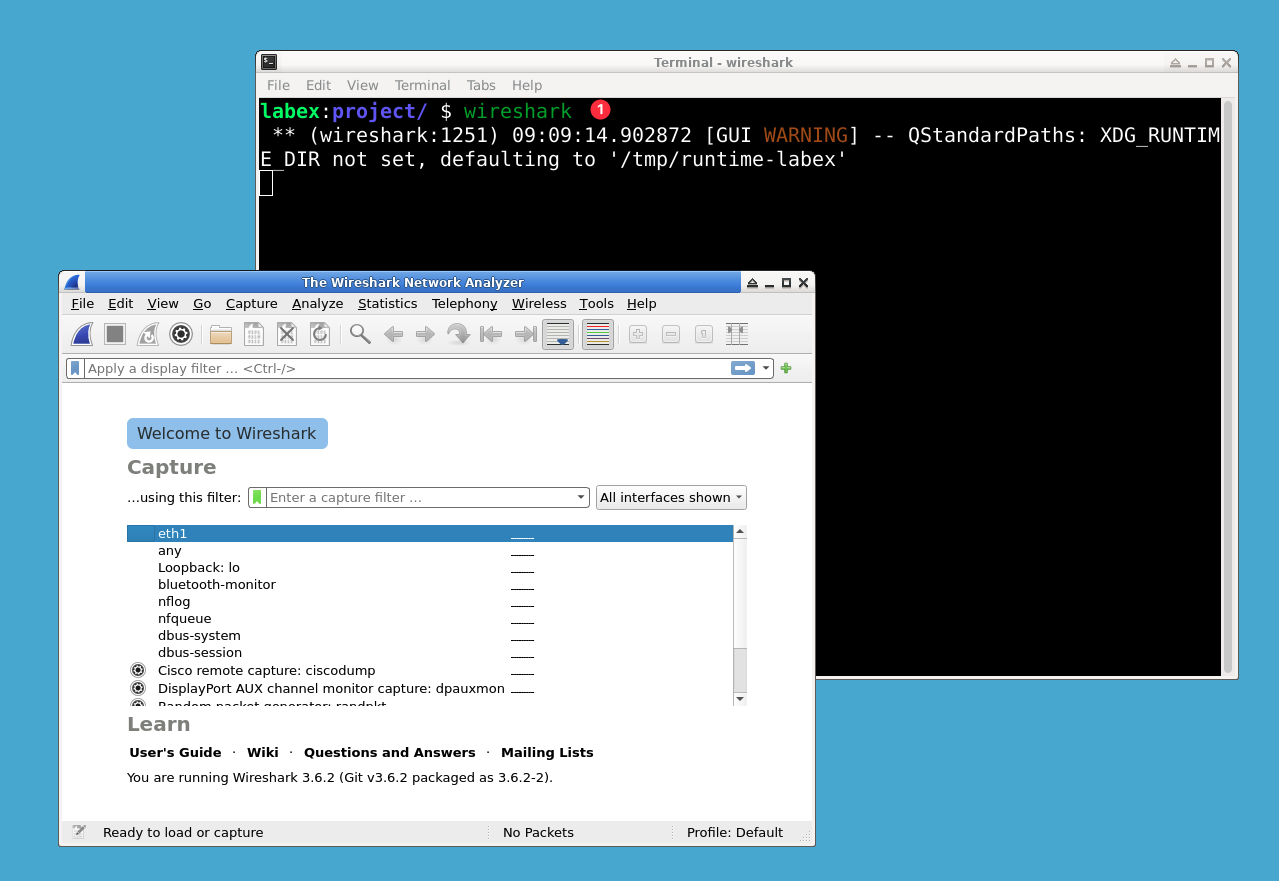
- Double-click on the active interface (the one showing packet counts increasing) to start capturing. The main window will now display a live stream of packets - each line represents a different network conversation happening right now.
Let's create some simple network activity to capture. Open a new terminal window and enter:
curl http://example.comThis command fetches the homepage of example.com, generating HTTP packets (web traffic) that Wireshark can capture. You'll see new packets appear in Wireshark immediately after running this.
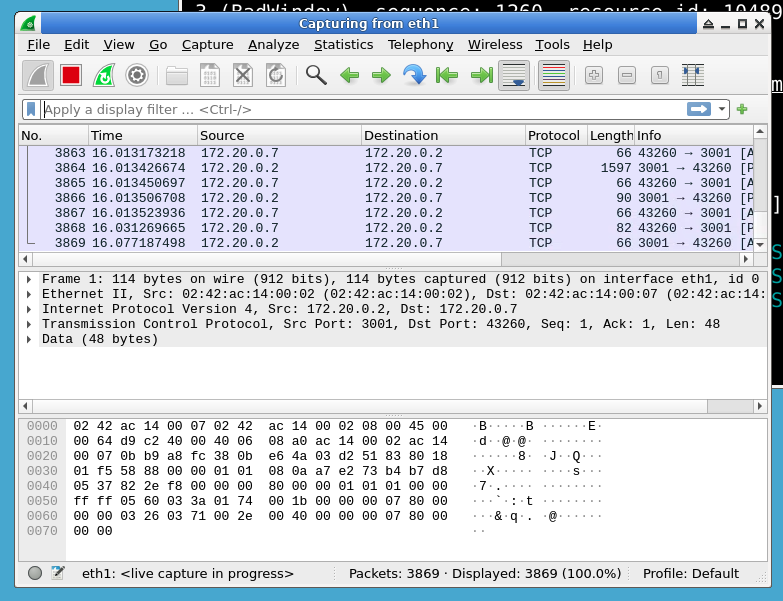
After seeing several packets (about 5-10 seconds is enough), click the red "Stop" button at the top. This freezes the capture so we can examine the packets without new ones constantly arriving.
Congratulations! You've captured your first network traffic. Each line represents a packet with details like source/destination addresses, protocol type, and timing. The three main panels show: the packet list (summary), packet details (technical breakdown), and raw packet data (hexadecimal view).
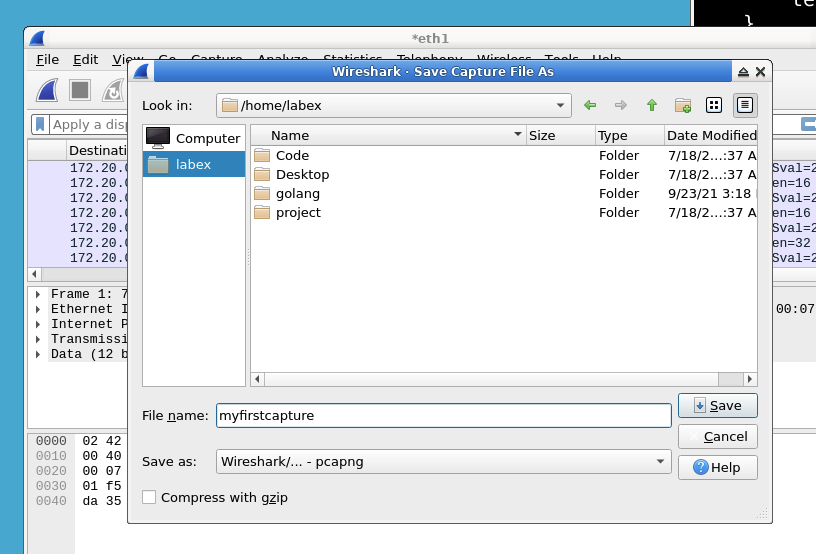
To save your work, go to File > Save and name the file
myfirstcapture.pcapngin/home/labex. The .pcapng format preserves all the packet details for future analysis.
This basic capture process is the foundation of network analysis. In upcoming steps, we'll learn how to filter and interpret these packets to understand network behavior and troubleshoot issues.
Analyzing Packet Data
Now that we've captured some network traffic, let's examine it step by step. Think of this like reading a digital conversation - we'll learn how to interpret the "language" computers use to communicate.
Opening the Capture File:
Start Wireshark and open your saved capture file (myfirstcapture.pcapng) either through File > Open or by double-clicking the file. This file contains all the network traffic we previously recorded, similar to a recording of phone calls.Understanding the Packet List:
The top pane shows all captured packets in chronological order. Each line represents one network message, showing:- Who sent it (Source IP)
- Who received it (Destination IP)
- What type of communication it was (Protocol)
- A brief summary (Info)
Examining Packet Details:
When you click any packet, the middle pane reveals its internal structure through protocol layers:- Frame: Physical network details
- Ethernet: Hardware addressing
- IP: Internet routing information
- TCP/UDP: Transport details
- Application data (like HTTP)
Filtering HTTP Traffic:
In the filter bar (top), typehttpand press Enter. This isolates web traffic, just like searching for only text messages in a phone log. HTTP is the protocol web browsers use to communicate with servers.
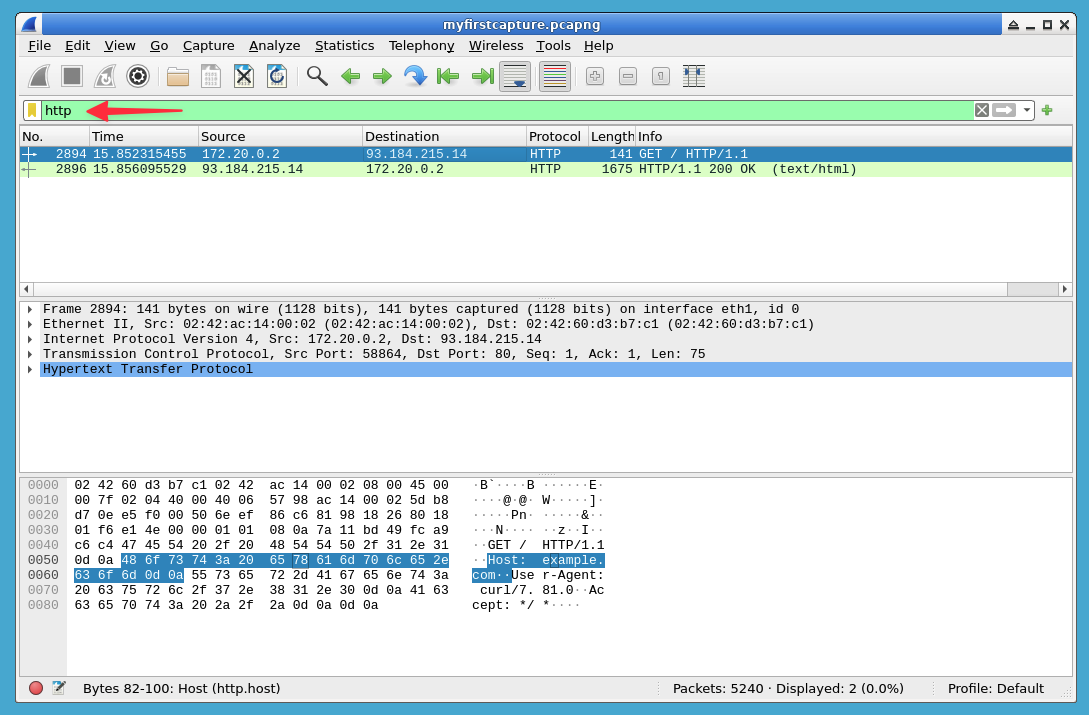
- Identifying Web Requests:
Look for packets with "GET" in the Info column. These represent your browser asking for web pages. Click one to see:- The exact URL requested
- Which website was contacted
- Technical details about the request
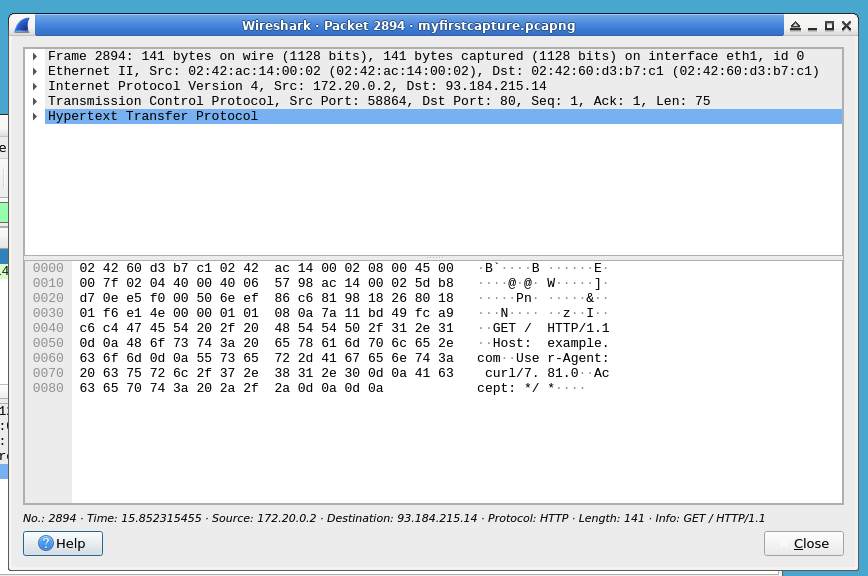
Analyzing HTTP Headers:
Expand the "Hypertext Transfer Protocol" section to see:- Request method (GET/POST)
- Requested resource (/index.html)
- Browser information
- Cookies and other metadata
Finding Server Responses:
Search for "HTTP/1.1 200 OK" packets. These show successful webpage deliveries. Notice:- Response codes (200=success, 404=not found)
- Server type (Apache/Nginx)
- Content type (HTML, images, etc.)
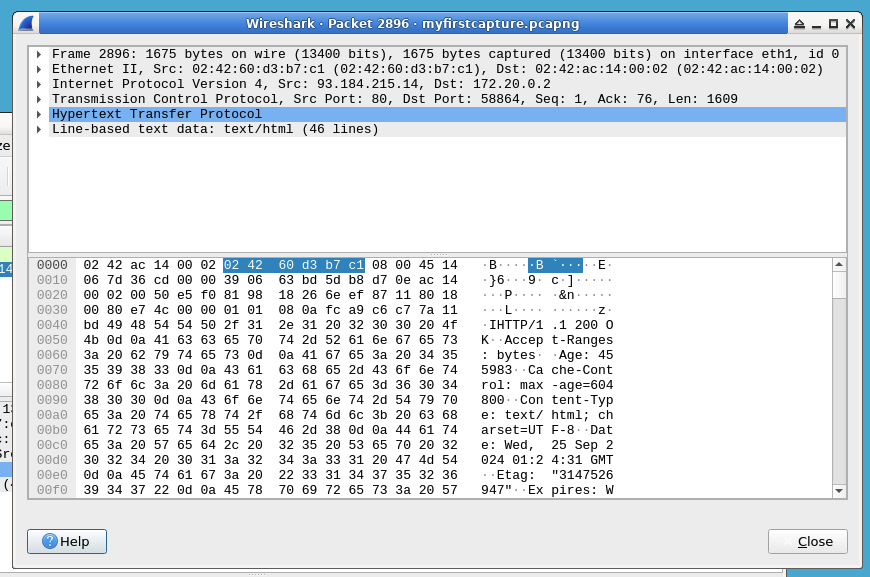
- Viewing Web Content:
In successful responses, check the "Line-based text data" section to see actual webpage content. This shows the HTML code the server sent to your browser.
This analysis reveals the hidden conversations happening across networks. By understanding these patterns, you can troubleshoot issues, identify suspicious activity, and comprehend how applications communicate.
Using Filters
Wireshark's real power comes from its ability to filter and analyze large amounts of network data quickly. In this step, we'll learn how to use filters to focus on specific types of traffic. Think of filters as search terms that help you find exactly what you're looking for in a sea of network packets.
With your capture file open in Wireshark, let's start by using some simple display filters. The filter bar is located just below the main toolbar:
- To show only TCP traffic (the most common transport protocol), type
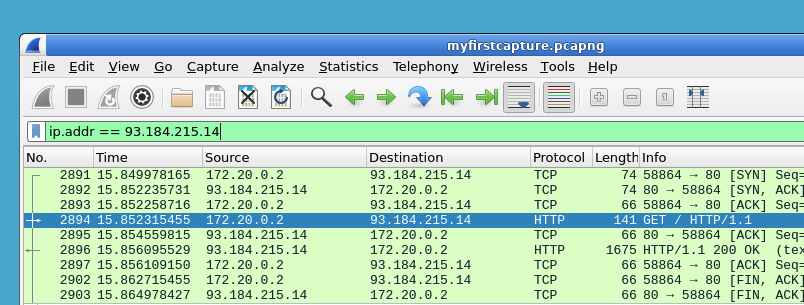
tcpin the filter bar and press Enter. This will hide all non-TCP packets from view. - To show traffic to or from a specific IP address, type
ip.addr == x.x.x.x, replacingx.x.x.xwith an address from your capture or from a DNS lookup. For example.com's current address, rundig example.com +shortin the Terminal and use one of the IPs it prints. The value93.184.215.14is only a placeholder in this lab text; real addresses change over time. The double equals sign (==) means "exactly matches".
- To show all HTTP GET requests (the most common type of web request), type
http.request.method == "GET". This helps you see what web pages are being requested.
- To show only TCP traffic (the most common transport protocol), type
Now let's create a more complex filter by combining conditions. We'll look for all HTTP GET requests specifically going to example.com:
- In the filter bar, enter:
http.request.method == "GET" && http.host contains "example.com" - The
&&means "AND", so both conditions must be true - The
containsoperator lets us match any domain with "example.com" in it
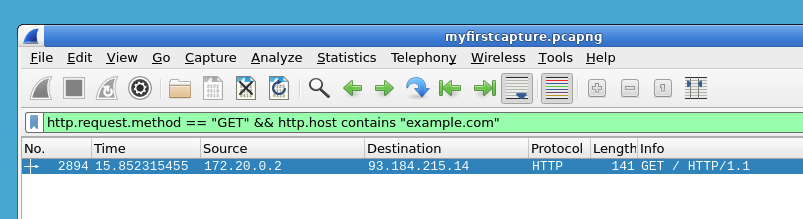
- This filter shows all GET requests to any domain containing "example.com", which is useful for monitoring traffic to specific websites.
- In the filter bar, enter:
Since you'll likely use certain filters repeatedly, Wireshark lets you save them. Let's save our HTTP GET filter:
- Click on the plus sign ("+") next to the filter bar. This opens the filter management window.
- Name the filter "HTTP GETs" and click Save. Choose a descriptive name you'll remember.
- You can now quickly apply this filter anytime by selecting it from the Saved Filters list (the bookmark icon next to the filter bar).
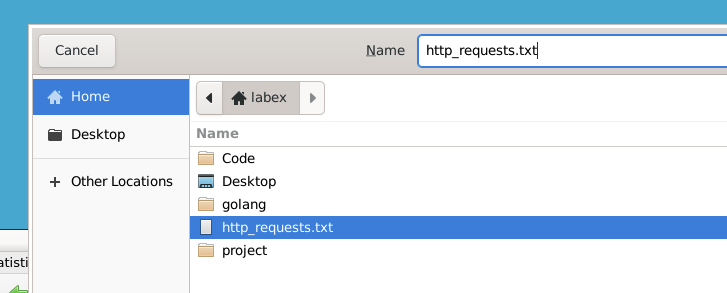
Finally, let's export some of our findings for documentation or further analysis:
- Go to Statistics > HTTP > Requests to see a summary of all HTTP requests
- Click on "Save as" to export the list to a file
- Choose
/home/labexas the location and save the file ashttp_requests.txt
Using filters in this way allows you to quickly sift through large amounts of network data and focus on what's important. It's like having a super-powered magnifying glass that can instantly show you specific types of network traffic. Mastering filters will save you hours when troubleshooting network issues or analyzing security events.
Summary
In this lab, you have learned the fundamentals of network analysis using Wireshark. You've mastered essential skills including installing Wireshark, capturing network traffic, analyzing packet data, and applying filters to isolate specific traffic types.
These core competencies provide a solid foundation for cybersecurity and network administration. Wireshark serves as a powerful tool for troubleshooting networks, monitoring traffic patterns, and identifying potential security threats. Continue practicing to further develop your network analysis expertise.

